Garland, Maine (ME) income map, earnings map, and wages data
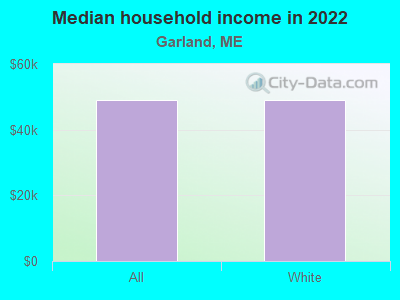
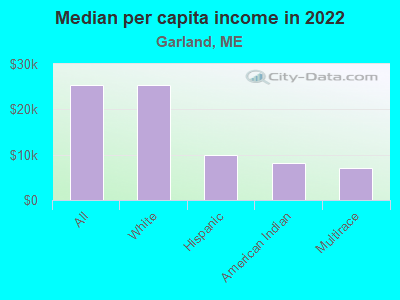
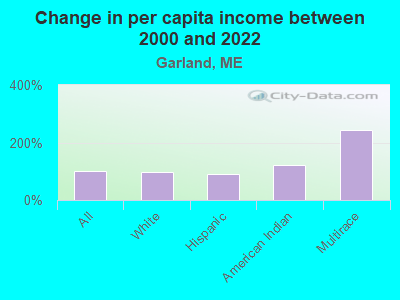
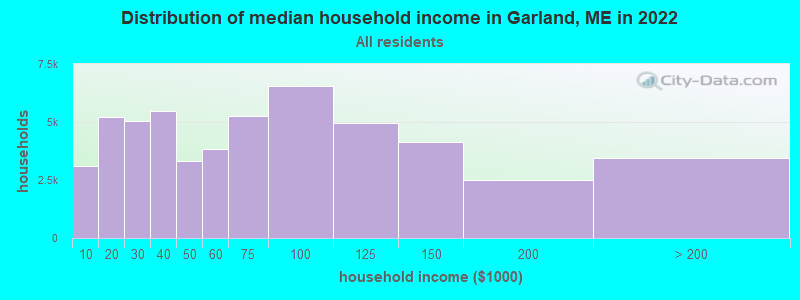
The median household income in Garland, ME in 2022 was $49,051, which was 41.8% less than the median annual income of $69,543 across the entire state of Maine. Compared to the median income of $27,500 in 2000 this represents an increase of 43.9%. The per capita income in 2022 was $25,377, which means an increase of 50.3% compared to 2000 when it was $12,624.
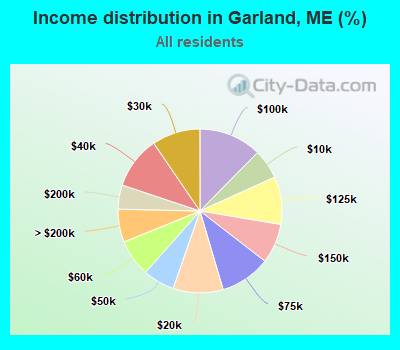
Income statistics for all residents
Median household income in Garland, ME in 2022:| Garland: | $49,051 |
| State: | $69,543 |
Change in median household income between 2000 and 2022:| Garland, Maine: | +78.4% |
| State: | +86.7% |
Number of households with income < $10k:| Garland: | 5.9% (3,101) |
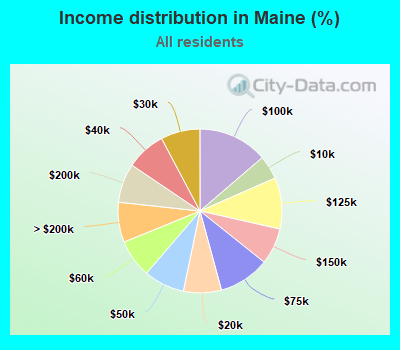
| State: | 4.7% (28,445) |
Number of households with income $10k - 20k:| Garland: | 9.9% (5,213) |
| Maine: | 7.5% (45,280) |
Number of households with income $20k - 30k:| Garland: | 9.5% (5,038) |
| State: | 7.7% (46,813) |
Number of households with income $30k - 40k:| Garland: | 10.4% (5,476) |
| State: | 7.8% (47,357) |
Number of households with income $40k - 50k:| Garland: | 6.3% (3,309) |
| State: | 8.0% (48,625) |
Number of households with income $50k - 60k:| Garland: | 7.3% (3,851) |
| State: | 7.5% (45,566) |
Number of households with income $60k - 75k:| Garland: | 10.0% (5,276) |
| State: | 10.1% (60,924) |
Number of households with income $75k - 100k:| Garland: | 12.4% (6,550) |
| State: | 13.7% (83,142) |
Number of households with income $100k - 125k:| Garland: | 9.4% (4,972) |
| State: | 10.1% (61,186) |
Number of households with income $125k - 150k:| Garland: | 7.8% (4,151) |
| Maine: | 7.2% (43,500) |
Number of households with income $150k - 200k:| Garland: | 4.8% (2,519) |
| State: | 7.7% (46,696) |
Number of households with income > $200k:| Garland: | 6.5% (3,450) |
| State: | 7.9% (47,804) |
Aggregate household income in Garland in 2022: $31,287,769
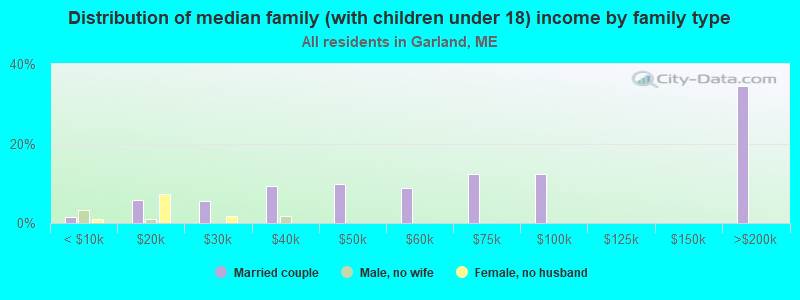
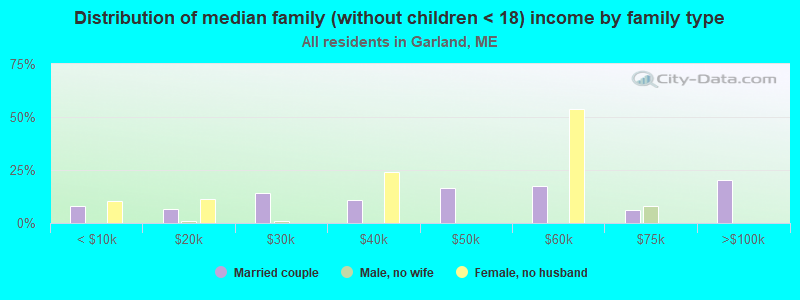
Median family income in Garland in 2022:| Garland: | $61,852 |
| State: | $88,063 |
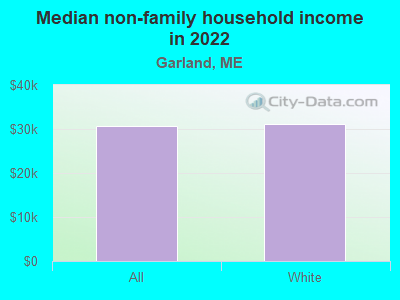
Median non-family income in Garland in 2022:| Garland: | $30,721 |
| State: | $40,639 |
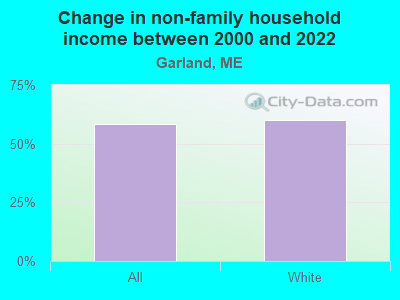
Change in median non-family income between 2000 and 2022:| Garland, Maine: | +58.3% |
| State: | +87.1% |
Median per capita income in Garland in 2022:| Garland: | $25,378 |
| State: | $41,188 |
Change in median per capita income between 2000 and 2022:| Garland, Maine: | +101.0% |
| Maine: | +110.9% |
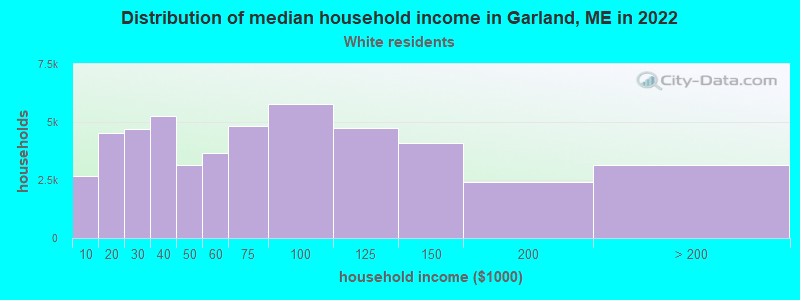
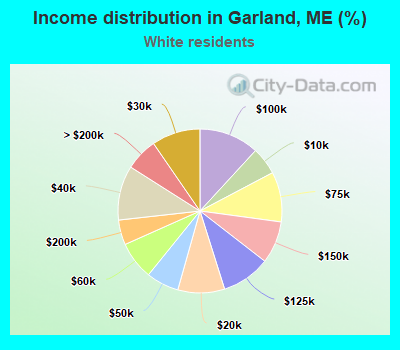
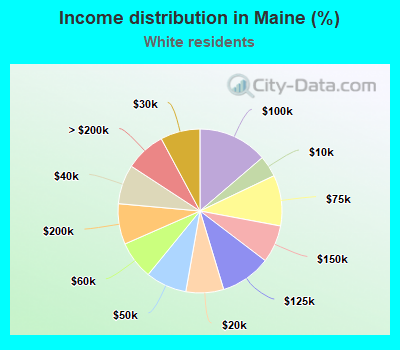
Income statistics for White residents
Median household income in Garland, ME in 2022:| Garland: | $48,923 |
| State: | $70,228 |
Change in median household income between 2000 and 2022:| Garland, Maine: | +77.9% |
| State: | +87.7% |
Number of households with income < $10k:| Garland: | 5.4% (2,664) |
| State: | 4.2% (23,567) |
Number of households with income $10k - 20k:| Garland: | 9.2% (4,513) |
| State: | 7.4% (41,770) |
Number of households with income $20k - 30k:| Garland: | 9.6% (4,690) |
| State: | 7.8% (43,842) |
Number of households with income $30k - 40k:| Garland: | 10.8% (5,266) |
| Maine: | 7.8% (43,575) |
Number of households with income $40k - 50k:| Garland: | 6.5% (3,159) |
| State: | 8.1% (45,444) |
Number of households with income $50k - 60k:| Garland: | 7.5% (3,665) |
| Maine: | 7.5% (42,240) |
Number of households with income $60k - 75k:| Garland: | 9.9% (4,823) |
| Maine: | 10.0% (56,153) |
Number of households with income $75k - 100k:| Garland: | 11.8% (5,797) |
| State: | 13.7% (76,982) |
Number of households with income $100k - 125k:| Garland: | 9.6% (4,722) |
| Maine: | 10.0% (55,945) |
Number of households with income $125k - 150k:| Garland: | 8.4% (4,091) |
| State: | 7.4% (41,559) |
Number of households with income $150k - 200k:| Garland: | 4.9% (2,408) |
| State: | 8.0% (44,909) |
Number of households with income > $200k:| Garland: | 6.4% (3,142) |
| State: | 8.0% (44,738) |
Aggregate household income in Garland in 2022: $29,251,826
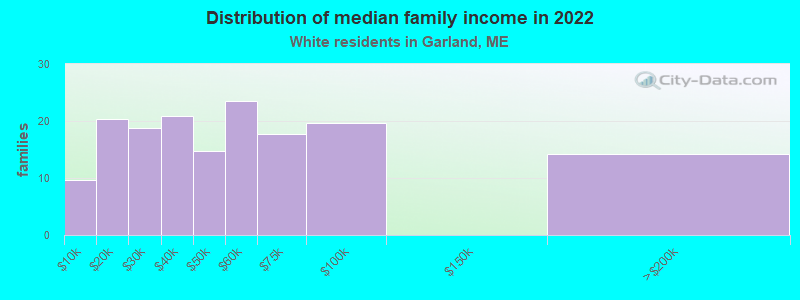
Median family income in Garland in 2022:| Garland: | $62,912 |
| State: | $89,589 |
Number of families with income < $10k:| Garland: | 6.1% (10) |
| State: | 1.7% (5,845) |
Number of families with income $10k - 20k:| Garland: | 12.8% (20) |
| State: | 3.2% (10,865) |
Number of families with income $20k - 30k:| Garland: | 11.8% (19) |
| State: | 4.4% (15,170) |
Number of families with income $30k - 40k:| Garland: | 13.0% (21) |
| State: | 6.2% (21,234) |
Number of families with income $40k - 50k:| Garland: | 9.2% (15) |
| State: | 7.0% (23,965) |
Number of families with income $50k - 60k:| Garland: | 14.8% (24) |
| Maine: | 7.6% (26,226) |
Number of families with income $60k - 75k:| Garland: | 11.1% (18) |
| State: | 10.6% (36,513) |
Number of families with income $75k - 100k:| Garland: | 12.3% (20) |
| State: | 15.3% (52,781) |
Number of families with income $150k - 200k:| Garland: | 8.9% (14) |
| State: | 10.6% (36,366) |
Median non-family income in Garland in 2022:| Garland: | $31,053 |
| State: | $40,779 |
Change in median non-family income between 2000 and 2022:| Garland, Maine: | +60.0% |
| State: | +87.4% |
Median per capita income in Garland in 2022:| Garland: | $25,348 |
| State: | $41,797 |
Change in median per capita income between 2000 and 2022:| Garland, Maine: | +98.7% |
| State: | +111.9% |
Income statistics for Hispanic or Latino residents
Number of households with income < $10k:| Garland: | 9.8% (315) |
| State: | 9.8% (882) |
Number of households with income $10k - 20k:| Garland: | 11.4% (367) |
| State: | 11.4% (1,027) |
Number of households with income $20k - 30k:| Garland: | 2.5% (79) |
| State: | 2.5% (221) |
Number of households with income $30k - 40k:| Garland: | 14.2% (458) |
| State: | 14.2% (1,284) |
Number of households with income $40k - 50k:| Garland: | 8.1% (259) |
| State: | 8.1% (727) |
Number of households with income $50k - 60k:| Garland: | 4.7% (151) |
| State: | 4.7% (423) |
Number of households with income $60k - 75k:| Garland: | 10.6% (341) |
| State: | 10.6% (956) |
Number of households with income $75k - 100k:| Garland: | 19.0% (611) |
| Maine: | 19.0% (1,711) |
Number of households with income $100k - 125k:| Garland: | 7.1% (229) |
| State: | 7.1% (642) |
Number of households with income $125k - 150k:| Garland: | 6.1% (196) |
| State: | 6.1% (549) |
Number of households with income $150k - 200k:| Garland: | 1.1% (35) |
| State: | 1.1% (99) |
Number of households with income > $200k:| Garland: | 5.5% (176) |
| State: | 5.5% (493) |
Median per capita income in Garland in 2022:| Garland: | $10,021 |
| State: | $31,794 |
Change in median per capita income between 2000 and 2022:| Garland, Maine: | +89.1% |
| State: | +114.2% |
Income statistics for American Indian and Alaska Native residents
Number of households with income < $10k:| Garland: | 15.5% (145) |
| State: | 15.5% (498) |
Number of households with income $10k - 20k:| Garland: | 10.9% (102) |
| State: | 11.0% (351) |
Number of households with income $20k - 30k:| Garland: | 10.0% (93) |
| State: | 10.0% (319) |
Number of households with income $30k - 40k:| Garland: | 4.2% (39) |
| Maine: | 4.1% (131) |
Number of households with income $40k - 50k:| Garland: | 1.5% (14) |
| State: | 1.5% (49) |
Number of households with income $50k - 60k:| Garland: | 2.4% (22) |
| State: | 2.4% (76) |
Number of households with income $60k - 75k:| Garland: | 22.4% (209) |
| State: | 22.4% (718) |
Number of households with income $75k - 100k:| Garland: | 17.0% (159) |
| Maine: | 17.0% (546) |
Number of households with income $100k - 125k:| Garland: | 5.4% (50) |
| State: | 5.4% (172) |
Number of households with income $125k - 150k:| Garland: | 5.8% (54) |
| State: | 5.8% (186) |
Number of households with income $150k - 200k:| Garland: | 1.1% (10) |
| State: | 1.1% (34) |
Number of households with income > $200k:| Garland: | 3.9% (36) |
| Maine: | 3.8% (123) |
Median per capita income in Garland in 2022:| Garland: | $8,161 |
| State: | $30,025 |
Change in median per capita income between 2000 and 2022:| Garland, Maine: | +120.6% |
| Maine: | +136.4% |
Income statistics for Multirace residents
Number of households with income < $10k:| Garland: | 11.0% (245) |
| State: | 11.2% (2,930) |
Number of households with income $10k - 20k:| Garland: | 7.8% (174) |
| State: | 7.7% (2,015) |
Number of households with income $20k - 30k:| Garland: | 5.3% (118) |
| State: | 5.5% (1,422) |
Number of households with income $30k - 40k:| Garland: | 9.3% (207) |
| State: | 9.5% (2,484) |
Number of households with income $40k - 50k:| Garland: | 9.6% (213) |
| Maine: | 9.2% (2,405) |
Number of households with income $50k - 60k:| Garland: | 7.3% (162) |
| State: | 7.3% (1,893) |
Number of households with income $60k - 75k:| Garland: | 9.0% (199) |
| State: | 8.9% (2,330) |
Number of households with income $75k - 100k:| Garland: | 15.9% (353) |
| Maine: | 15.9% (4,140) |
Number of households with income $100k - 125k:| Garland: | 11.4% (254) |
| Maine: | 11.4% (2,972) |
Number of households with income $125k - 150k:| Garland: | 4.2% (94) |
| Maine: | 4.2% (1,106) |
Number of households with income $150k - 200k:| Garland: | 3.8% (84) |
| State: | 3.9% (1,008) |
Number of households with income > $200k:| Garland: | 5.2% (116) |
| State: | 5.3% (1,377) |
Median per capita income in Garland in 2022:| Garland: | $7,020 |
| Maine: | $32,995 |