The median household income in Garden Grove, FL in 2022 was $86,365, which was 19.8% greater than the median annual income of $69,303 across the entire state of Florida. Compared to the median income of $32,572 in 2000 this represents an increase of 62.3%. The per capita income in 2022 was $40,793, which means an increase of 55.1% compared to 2000 when it was $18,321.
Whole page based on the data from 2000 / 2022 when the population of Garden Grove, Florida was 674 / 1,089
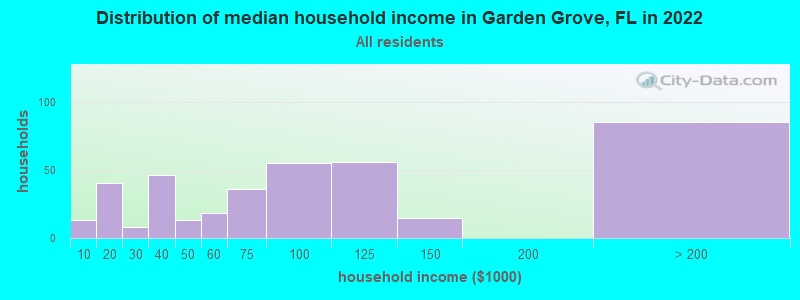
Income statistics for all residents
Median household income in Garden Grove, FL in 2022:
Garden Grove:
$86,366
State:
$69,303
Number of households with income < $10k:
Garden Grove:
3.4% (13)
State:
5.6% (495,572)
Number of households with income $10k - 20k:
Garden Grove:
10.4% (40)
Florida:
6.9% (612,816)
Number of households with income $20k - 30k:
Garden Grove:
2.1% (8)
Florida:
7.7% (679,608)
Number of households with income $30k - 40k:
Garden Grove:
11.9% (46)
Florida:
8.0% (710,126)
Number of households with income $40k - 50k:
Garden Grove:
3.4% (13)
Florida:
7.8% (687,940)
Number of households with income $50k - 60k:
Garden Grove:
4.7% (18)
State:
7.6% (675,076)
Number of households with income $60k - 75k:
Garden Grove:
9.4% (36)
Florida:
9.7% (858,354)
Number of households with income $75k - 100k:
Garden Grove:
14.3% (55)
State:
13.4% (1,181,540)
Number of households with income $100k - 125k:
Garden Grove:
14.5% (56)
Florida:
9.6% (851,620)
Number of households with income $125k - 150k:
Garden Grove:
3.9% (15)
Florida:
6.4% (560,854)
Number of households with income $150k - 200k:
Garden Grove:
0.0% (0)
State:
7.7% (677,227)
Number of households with income > $200k:
Garden Grove:
22.1% (85)
State:
9.5% (835,661)
Aggregate household income in Garden Grove in 2022: $41,609,662
Median family income in Garden Grove in 2022:
Garden Grove:
$83,928
State:
$83,410
Number of families with income < $10k:
Garden Grove:
4.1% (13)
State:
3.5% (196,709)
Number of families with income $10k - 20k:
Garden Grove:
8.7% (27)
State:
3.9% (220,255)
Number of families with income $30k - 40k:
Garden Grove:
14.6% (46)
State:
6.9% (391,565)
Number of families with income $40k - 50k:
Garden Grove:
2.4% (8)
State:
7.2% (407,691)
Number of families with income $60k - 75k:
Garden Grove:
12.5% (39)
State:
10.2% (580,095)
Number of families with income $75k - 100k:
Garden Grove:
28.4% (89)
State:
14.6% (830,079)
Number of families with income > $200k:
Garden Grove:
29.4% (92)
State:
12.2% (691,335)
Median income for 3 person families:
Garden Grove:
$92,091
State:
$86,353
Median income for families with 0 earners:
Garden Grove:
$35,805
State:
$52,758
Median income for families with 1 earner:
Garden Grove:
$0
Florida:
$60,483
Median income for families with 2 earners:
Garden Grove:
$0
State:
$104,935
Median income for families with 3+ earners:
Garden Grove:
$0
Florida:
$126,375
Median non-family income in Garden Grove in 2022:
Garden Grove:
$63,324
State:
$43,665
Median per capita income in Garden Grove in 2022:
Garden Grove:
$40,793
Florida:
$40,278
Change in median per capita income between 2000 and 2022:
Garden Grove, Florida:
+122.7%
Florida:
+86.8%
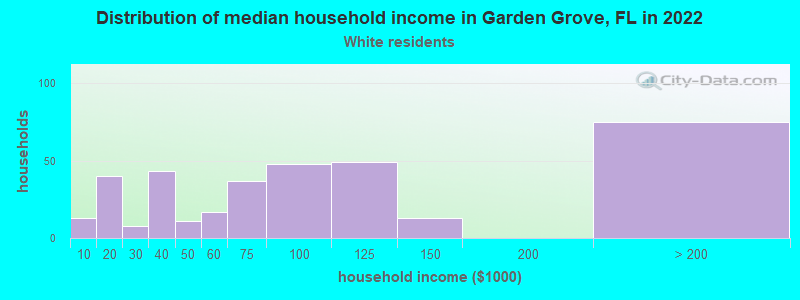
Income statistics for White residents
Median household income in Garden Grove, FL in 2022:
Garden Grove:
$84,053
State:
$74,559
Number of households with income < $10k:
Garden Grove:
3.7% (13)
State:
4.9% (270,741)
Number of households with income $10k - 20k:
Garden Grove:
11.3% (40)
State:
6.1% (337,688)
Number of households with income $20k - 30k:
Garden Grove:
2.3% (8)
State:
7.2% (395,954)
Number of households with income $30k - 40k:
Garden Grove:
12.1% (43)
State:
7.5% (411,553)
Number of households with income $40k - 50k:
Garden Grove:
3.1% (11)
State:
7.5% (410,613)
Number of households with income $50k - 60k:
Garden Grove:
4.8% (17)
State:
7.6% (416,709)
Number of households with income $60k - 75k:
Garden Grove:
10.5% (37)
State:
9.5% (523,639)
Number of households with income $75k - 100k:
Garden Grove:
13.6% (48)
Florida:
13.3% (732,030)
Number of households with income $100k - 125k:
Garden Grove:
13.8% (49)
Florida:
10.2% (559,463)
Number of households with income $125k - 150k:
Garden Grove:
3.7% (13)
Florida:
6.9% (379,323)
Number of households with income $150k - 200k:
Garden Grove:
0.0% (0)
State:
8.3% (456,076)
Number of households with income > $200k:
Garden Grove:
21.2% (75)
State:
11.1% (610,258)
Aggregate household income in Garden Grove in 2022: $38,646,749
Median family income in Garden Grove in 2022:
Garden Grove:
$83,366
State:
$93,222
Number of families with income < $10k:
Garden Grove:
4.1% (12)
State:
2.6% (89,721)
Number of families with income $10k - 20k:
Garden Grove:
8.6% (24)
Florida:
3.0% (101,720)
Number of families with income $30k - 40k:
Garden Grove:
13.3% (38)
State:
5.7% (194,218)
Number of families with income $40k - 50k:
Garden Grove:
2.4% (7)
State:
6.4% (219,550)
Number of families with income $60k - 75k:
Garden Grove:
14.3% (41)
State:
9.6% (328,141)
Number of families with income $75k - 100k:
Garden Grove:
27.0% (77)
State:
14.8% (503,988)
Number of families with income > $200k:
Garden Grove:
30.3% (86)
Florida:
14.9% (507,279)
Median non-family income in Garden Grove in 2022:
Garden Grove:
$57,717
State:
$46,674
Median per capita income in Garden Grove in 2022:
Garden Grove:
$49,998
State:
$48,094
Income statistics for Black or African American residents
Median per capita income in Garden Grove in 2022:
Garden Grove:
$29,394
Florida:
$26,700
Change in median per capita income between 2000 and 2022:
Garden Grove, Florida:
+134.0%
State:
+112.2%
Income statistics for Hispanic or Latino residents
Median per capita income in Garden Grove in 2022:
Garden Grove:
$28,778
State:
$30,491
Change in median per capita income between 2000 and 2022:
Garden Grove, Florida:
+149.7%
Florida:
+100.6%
Income statistics for American Indian and Alaska Native residents
Median per capita income in Garden Grove in 2022:
Garden Grove:
$24,381
State:
$25,874
Change in median per capita income between 2000 and 2022:
Garden Grove, Florida:
+64.9%
State:
+55.9%
Discuss Garden Grove, Florida (FL) on our hugely popular Florida forum.