Fox Run, Pennsylvania (PA) income map, earnings map, and wages data
The median household income in Fox Run, PA in 2022 was $121,808, which was 41.1% greater than the median annual income of $71,798 across the entire state of Pennsylvania. Compared to the median income of $68,182 in 2000 this represents an increase of 44.0%. The per capita income in 2022 was $47,379, which means an increase of 47.6% compared to 2000 when it was $24,810.
Whole page based on the data from 2000 / 2022 when the population of Fox Run, Pennsylvania was 3,044 / 3,727
Income statistics for all residents
Median household income in Fox Run, PA in 2022:| Fox Run: | $121,809 |
| State: | $71,798 |
Change in median household income between 2000 and 2022:| Fox Run, Pennsylvania: | +78.7% |
| State: | +79.0% |
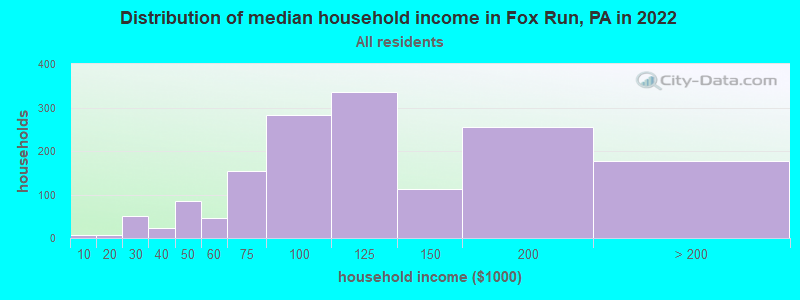
Number of households with income < $10k:| Fox Run: | 0.5% (8) |
| State: | 5.5% (291,562) |
Number of households with income $10k - 20k:| Fox Run: | 0.5% (7) |
| State: | 7.3% (384,726) |
Number of households with income $20k - 30k:| Fox Run: | 3.3% (50) |
| State: | 7.4% (389,464) |
Number of households with income $30k - 40k:| Fox Run: | 1.5% (23) |
| State: | 7.6% (402,138) |
Number of households with income $40k - 50k:| Fox Run: | 5.5% (84) |
| Pennsylvania: | 7.3% (387,945) |
Number of households with income $50k - 60k:| Fox Run: | 2.9% (45) |
| State: | 7.0% (372,468) |
Number of households with income $60k - 75k:| Fox Run: | 10.0% (154) |
| Pennsylvania: | 9.9% (524,786) |
Number of households with income $75k - 100k:| Fox Run: | 18.4% (283) |
| State: | 12.6% (666,253) |
Number of households with income $100k - 125k:| Fox Run: | 21.9% (336) |
| Pennsylvania: | 9.9% (526,402) |
Number of households with income $125k - 150k:| Fox Run: | 7.4% (113) |
| Pennsylvania: | 6.9% (362,702) |
Number of households with income $150k - 200k:| Fox Run: | 16.6% (255) |
| State: | 8.3% (440,827) |
Number of households with income > $200k:| Fox Run: | 11.5% (176) |
| State: | 10.3% (544,792) |
Aggregate household income in Fox Run in 2022: $176,419,733
Median family income in Fox Run in 2022:| Fox Run: | $140,795 |
| State: | $93,029 |
Number of families with income $10k - 20k:| Fox Run: | 2.5% (32) |
| State: | 3.5% (115,881) |
Number of families with income $20k - 30k:| Fox Run: | 1.6% (21) |
| State: | 4.8% (156,521) |
Number of families with income $30k - 40k:| Fox Run: | 0.6% (8) |
| State: | 5.8% (191,305) |
Number of families with income $40k - 50k:| Fox Run: | 3.7% (46) |
| State: | 6.4% (211,380) |
Number of families with income $50k - 60k:| Fox Run: | 1.8% (23) |
| State: | 6.4% (209,910) |
Number of families with income $60k - 75k:| Fox Run: | 6.7% (83) |
| Pennsylvania: | 9.7% (318,991) |
Number of families with income $75k - 100k:| Fox Run: | 19.0% (238) |
| Pennsylvania: | 14.0% (461,021) |
Number of families with income $100k - 125k:| Fox Run: | 22.0% (276) |
| Pennsylvania: | 12.2% (400,961) |
Number of families with income $125k - 150k:| Fox Run: | 7.7% (97) |
| State: | 8.8% (288,471) |
Number of families with income $150k - 200k:| Fox Run: | 19.7% (247) |
| State: | 11.2% (367,642) |
Number of families with income > $200k:| Fox Run: | 14.7% (184) |
| State: | 14.3% (470,863) |
Median non-family income in Fox Run in 2022:| Fox Run: | $60,884 |
| Pennsylvania: | $42,203 |
Change in median non-family income between 2000 and 2022:| Fox Run, Pennsylvania: | +23.1% |
| State: | +90.1% |
Median per capita income in Fox Run in 2022:| Fox Run: | $47,380 |
| State: | $41,489 |
Change in median per capita income between 2000 and 2022:| Fox Run, Pennsylvania: | +91.0% |
| Pennsylvania: | +98.7% |
Income statistics for White residents
Median household income in Fox Run, PA in 2022:| Fox Run: | $122,082 |
| State: | $76,765 |
Change in median household income between 2000 and 2022:| Fox Run, Pennsylvania: | +82.1% |
| State: | +84.3% |
Number of households with income < $10k:| Fox Run: | 0.5% (7) |
| State: | 4.3% (179,792) |
Number of households with income $10k - 20k:| Fox Run: | 0.4% (6) |
| State: | 6.5% (268,738) |
Number of households with income $20k - 30k:| Fox Run: | 3.3% (47) |
| State: | 7.0% (288,138) |
Number of households with income $30k - 40k:| Fox Run: | 1.5% (21) |
| State: | 7.2% (300,208) |
Number of households with income $40k - 50k:| Fox Run: | 5.5% (78) |
| State: | 7.2% (298,756) |
Number of households with income $50k - 60k:| Fox Run: | 2.9% (42) |
| State: | 6.8% (283,251) |
Number of households with income $60k - 75k:| Fox Run: | 10.1% (144) |
| State: | 9.9% (408,159) |
Number of households with income $75k - 100k:| Fox Run: | 18.2% (260) |
| Pennsylvania: | 13.2% (547,809) |
Number of households with income $100k - 125k:| Fox Run: | 21.4% (306) |
| State: | 10.5% (436,652) |
Number of households with income $125k - 150k:| Fox Run: | 7.6% (109) |
| Pennsylvania: | 7.3% (304,132) |
Number of households with income $150k - 200k:| Fox Run: | 16.9% (241) |
| State: | 9.0% (374,658) |
Number of households with income > $200k:| Fox Run: | 11.7% (167) |
| State: | 10.9% (452,618) |
Aggregate household income in Fox Run in 2022: $166,436,966
Median family income in Fox Run in 2022:| Fox Run: | $141,483 |
| State: | $99,396 |
Number of families with income $10k - 20k:| Fox Run: | 2.3% (26) |
| State: | 2.7% (69,032) |
Number of families with income $20k - 30k:| Fox Run: | 1.5% (17) |
| State: | 3.9% (100,065) |
Number of families with income $30k - 40k:| Fox Run: | 0.6% (7) |
| Pennsylvania: | 5.2% (134,367) |
Number of families with income $40k - 50k:| Fox Run: | 3.5% (40) |
| Pennsylvania: | 6.0% (154,327) |
Number of families with income $50k - 60k:| Fox Run: | 1.8% (21) |
| State: | 6.1% (157,983) |
Number of families with income $60k - 75k:| Fox Run: | 6.6% (77) |
| State: | 9.6% (249,292) |
Number of families with income $75k - 100k:| Fox Run: | 18.8% (219) |
| State: | 14.7% (379,316) |
Number of families with income $100k - 125k:| Fox Run: | 21.6% (252) |
| Pennsylvania: | 12.9% (333,626) |
Number of families with income $125k - 150k:| Fox Run: | 8.0% (93) |
| Pennsylvania: | 9.4% (243,915) |
Number of families with income $150k - 200k:| Fox Run: | 20.3% (236) |
| State: | 12.2% (314,926) |
Number of families with income > $200k:| Fox Run: | 15.1% (176) |
| State: | 15.1% (390,885) |
Median non-family income in Fox Run in 2022:| Fox Run: | $59,806 |
| State: | $44,251 |
Change in median non-family income between 2000 and 2022:| Fox Run, Pennsylvania: | +43.0% |
| State: | +94.2% |
Median per capita income in Fox Run in 2022:| Fox Run: | $48,068 |
| State: | $45,306 |
Change in median per capita income between 2000 and 2022:| Fox Run, Pennsylvania: | +96.1% |
| State: | +105.4% |
Income statistics for Black or African American residents
Median household income in Fox Run, PA in 2022:| Fox Run: | $110,945 |
| State: | $46,564 |
Change in median household income between 2000 and 2022:| Fox Run, Pennsylvania: | +64.4% |
| Pennsylvania: | +69.8% |
Aggregate household income in Fox Run in 2022: $9,936,951
Median non-family income in Fox Run in 2022:| Fox Run: | $123,080 |
| State: | $30,767 |
Change in median non-family income between 2000 and 2022:| Fox Run, Pennsylvania: | +82.3% |
| State: | +75.1% |
Median per capita income in Fox Run in 2022:| Fox Run: | $220,110 |
| Pennsylvania: | $28,010 |
Income statistics for Asian residents
Median household income in Fox Run, PA in 2022:| Fox Run: | $152,738 |
| State: | $98,296 |
Change in median household income between 2000 and 2022:| Fox Run, Pennsylvania: | +52.7% |
| Pennsylvania: | +122.4% |
Aggregate household income in Fox Run in 2022: $4,673,556
Median family income in Fox Run in 2022:| Fox Run: | $103,962 |
| Pennsylvania: | $115,357 |
Median per capita income in Fox Run in 2022:| Fox Run: | $59,626 |
| Pennsylvania: | $48,341 |
Change in median per capita income between 2000 and 2022:| Fox Run, Pennsylvania: | +67.7% |
| Pennsylvania: | +140.6% |