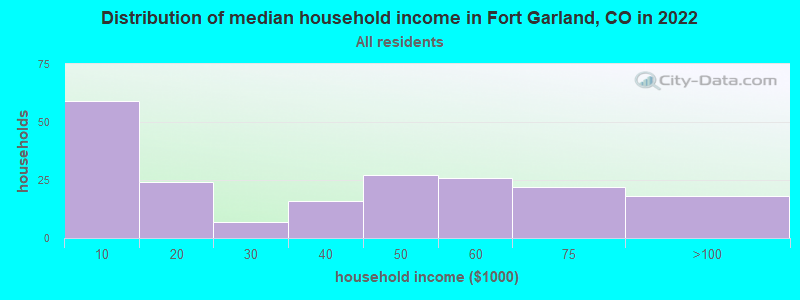
The median household income in Fort Garland, CO in 2022 was $37,464, which was 138.4% less than the median annual income of $89,302 across the entire state of Colorado. Compared to the median income of $18,929 in 2000 this represents an increase of 49.5%. The per capita income in 2022 was $13,886, which means an increase of 31.8% compared to 2000 when it was $9,470.
Whole page based on the data from 2000 / 2022 when the population of Fort Garland, Colorado was 432 / 589
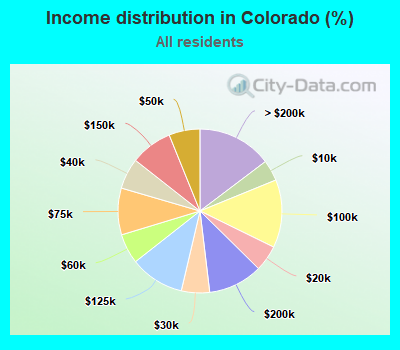
Income statistics for all residents
Median household income in Fort Garland, CO in 2022:
Fort Garland:
$37,465
State:
$89,302
Change in median household income between 2000 and 2022:
Fort Garland, Colorado:
+97.9%
State:
+89.2%
Number of households with income < $10k:
Fort Garland:
29.6% (59)
State:
4.1% (98,418)
Number of households with income $10k - 20k:
Fort Garland:
12.1% (24)
State:
5.1% (122,364)
Number of households with income $20k - 30k:
Fort Garland:
3.5% (7)
State:
5.6% (132,834)
Number of households with income $30k - 40k:
Fort Garland:
8.0% (16)
State:
6.1% (144,999)
Number of households with income $40k - 50k:
Fort Garland:
13.6% (27)
State:
6.1% (145,852)
Number of households with income $50k - 60k:
Fort Garland:
13.1% (26)
State:
5.9% (140,683)
Number of households with income $60k - 75k:
Fort Garland:
11.1% (22)
State:
9.2% (219,992)
Number of households with income $75k - 100k:
Fort Garland:
9.0% (18)
Colorado:
13.4% (319,980)
Number of households with income $100k - 125k:
Fort Garland:
0.0% (0)
State:
10.7% (255,638)
Number of households with income $125k - 150k:
Fort Garland:
0.0% (0)
State:
8.3% (197,264)
Number of households with income $150k - 200k:
Fort Garland:
0.0% (0)
State:
10.7% (255,855)
Number of households with income > $200k:
Fort Garland:
0.0% (0)
State:
14.7% (350,705)
Aggregate household income in Fort Garland in 2022: $7,544,248
Median non-family income in Fort Garland in 2022:
Fort Garland:
$43,828
State:
$57,553
Median per capita income in Fort Garland in 2022:
Fort Garland:
$13,886
State:
$49,071
Change in median per capita income between 2000 and 2022:
Fort Garland, Colorado:
+46.6%
State:
+104.0%
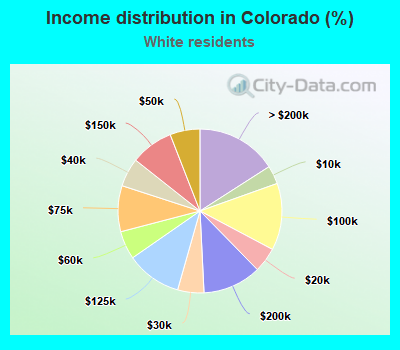
Income statistics for White residents
Median household income in Fort Garland, CO in 2022:
Fort Garland:
$48,121
State:
$93,728
Number of households with income < $10k:
Fort Garland:
0.0% (0)
State:
3.6% (65,804)
Number of households with income $10k - 20k:
Fort Garland:
19.0% (24)
Colorado:
4.9% (89,486)
Number of households with income $20k - 30k:
Fort Garland:
4.8% (6)
State:
5.2% (94,191)
Number of households with income $30k - 40k:
Fort Garland:
11.9% (15)
State:
5.7% (102,893)
Number of households with income $40k - 50k:
Fort Garland:
15.9% (20)
State:
5.9% (107,296)
Number of households with income $50k - 60k:
Fort Garland:
18.3% (23)
Colorado:
5.6% (101,466)
Number of households with income $60k - 75k:
Fort Garland:
16.7% (21)
State:
9.1% (164,790)
Number of households with income $75k - 100k:
Fort Garland:
13.5% (17)
State:
13.2% (240,038)
Number of households with income $100k - 125k:
Fort Garland:
0.0% (0)
State:
10.9% (198,757)
Number of households with income $125k - 150k:
Fort Garland:
0.0% (0)
Colorado:
8.4% (153,274)
Number of households with income $150k - 200k:
Fort Garland:
0.0% (0)
State:
11.5% (209,587)
Number of households with income > $200k:
Fort Garland:
0.0% (0)
Colorado:
15.9% (289,583)
Aggregate household income in Fort Garland in 2022: $6,504,193
Median family income in Fort Garland in 2022:
Fort Garland:
$48,282
State:
$118,609
Number of families with income $10k - 20k:
Fort Garland:
21.6% (22)
State:
2.1% (22,547)
Number of families with income $30k - 40k:
Fort Garland:
13.3% (14)
State:
3.9% (43,092)
Number of families with income $40k - 50k:
Fort Garland:
18.2% (19)
State:
4.4% (47,667)
Number of families with income $50k - 60k:
Fort Garland:
27.2% (28)
Colorado:
4.3% (47,498)
Number of families with income $60k - 75k:
Fort Garland:
4.5% (5)
State:
7.9% (85,731)
Number of families with income $75k - 100k:
Fort Garland:
15.2% (16)
State:
13.1% (143,181)
Median per capita income in Fort Garland in 2022:
Fort Garland:
$16,002
Colorado:
$55,103
Change in median per capita income between 2000 and 2022:
Fort Garland, Colorado:
+41.6%
Colorado:
+112.2%
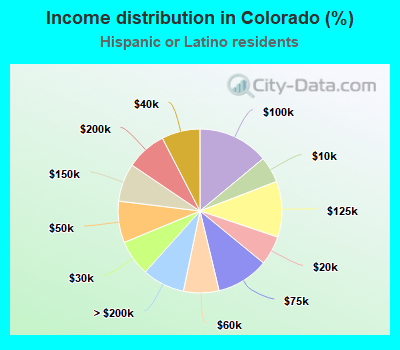
Income statistics for Hispanic or Latino residents
Median household income in Fort Garland, CO in 2022:
Fort Garland:
$38,157
Colorado:
$72,989
Change in median household income between 2000 and 2022:
Fort Garland, Colorado:
+96.9%
State:
+110.1%
Number of households with income < $10k:
Fort Garland:
31.3% (61)
State:
5.2% (21,051)
Number of households with income $10k - 20k:
Fort Garland:
11.3% (22)
Colorado:
5.8% (23,416)
Number of households with income $20k - 30k:
Fort Garland:
4.6% (9)
State:
7.1% (28,877)
Number of households with income $30k - 40k:
Fort Garland:
7.7% (15)
Colorado:
7.6% (30,782)
Number of households with income $40k - 50k:
Fort Garland:
14.9% (29)
State:
8.2% (33,247)
Number of households with income $50k - 60k:
Fort Garland:
12.8% (25)
Colorado:
7.0% (28,435)
Number of households with income $60k - 75k:
Fort Garland:
8.2% (16)
State:
10.3% (41,925)
Number of households with income $75k - 100k:
Fort Garland:
9.2% (18)
State:
14.0% (56,755)
Number of households with income $100k - 125k:
Fort Garland:
0.0% (0)
State:
11.0% (44,664)
Number of households with income $125k - 150k:
Fort Garland:
0.0% (0)
State:
7.5% (30,503)
Number of households with income $150k - 200k:
Fort Garland:
0.0% (0)
State:
8.0% (32,311)
Number of households with income > $200k:
Fort Garland:
0.0% (0)
State:
8.4% (34,000)
Aggregate household income in Fort Garland in 2022: $7,635,325
Median non-family income in Fort Garland in 2022:
Fort Garland:
$42,866
State:
$45,739
Median per capita income in Fort Garland in 2022:
Fort Garland:
$13,589
Colorado:
$29,910
Change in median per capita income between 2000 and 2022:
Fort Garland, Colorado:
+42.7%
State:
+129.4%
Income statistics for American Indian and Alaska Native residents
Median per capita income in Fort Garland in 2022:
Fort Garland:
$4,151
State:
$28,603
Change in median per capita income between 2000 and 2022:
Fort Garland, Colorado:
+116.2%
State:
+82.5%
Income statistics for Multirace residents
Number of households with income < $10k:
Fort Garland:
100.0% (73)
State:
4.3% (11,635)
Number of households with income $10k - 20k:
Fort Garland:
0.0% (0)
State:
6.3% (16,900)
Number of households with income $20k - 30k:
Fort Garland:
0.0% (0)
State:
6.9% (18,777)
Number of households with income $30k - 40k:
Fort Garland:
0.0% (0)
State:
7.1% (19,229)
Number of households with income $40k - 50k:
Fort Garland:
0.0% (0)
State:
6.4% (17,224)
Number of households with income $50k - 60k:
Fort Garland:
0.0% (0)
State:
6.6% (17,889)
Number of households with income $60k - 75k:
Fort Garland:
0.0% (0)
State:
10.2% (27,538)
Number of households with income $75k - 100k:
Fort Garland:
0.0% (0)
State:
14.3% (38,702)
Number of households with income $100k - 125k:
Fort Garland:
0.0% (0)
State:
10.4% (28,179)
Number of households with income $125k - 150k:
Fort Garland:
0.0% (0)
Colorado:
8.9% (23,989)
Number of households with income $150k - 200k:
Fort Garland:
0.0% (0)
Colorado:
7.4% (20,108)
Number of households with income > $200k:
Fort Garland:
0.0% (0)
State:
11.2% (30,192)
Aggregate household income in Fort Garland in 2022: $12,457,812
Median per capita income in Fort Garland in 2022:
Fort Garland:
$4,100
Colorado:
$33,518
Change in median per capita income between 2000 and 2022:: -56.9%
Fort Garland, Colorado:
-56.9%
State:
+151.7%
Income statistics for other residents
Aggregate household income in Fort Garland in 2022: $5,436,870
Median per capita income in Fort Garland in 2022:
Fort Garland:
$29,577
Colorado:
$30,433
Discuss Fort Garland, Colorado (CO) on our hugely popular Colorado forum.