East Seattle, Washington (WA) income map, earnings map, and wages data
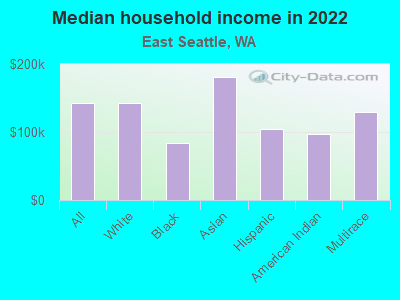
The median household income in East Seattle, WA in 2022 was $142,798, which was 36.1% greater than the median annual income of $91,306 across the entire state of Washington. Compared to the median income of $65,294 in 2000 this represents an increase of 54.3%. The per capita income in 2022 was $84,413, which means an increase of 57.8% compared to 2000 when it was $35,626.
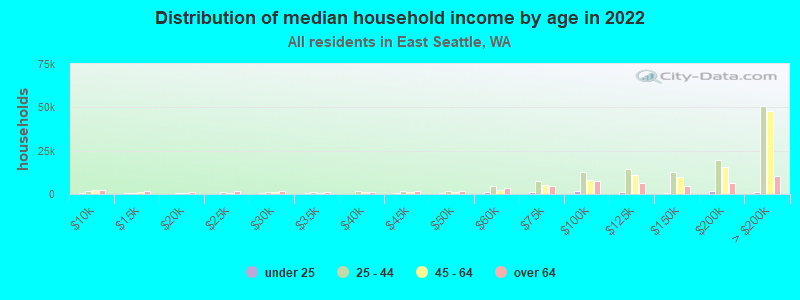
Income statistics for all residents
Median household income in East Seattle, WA in 2022:| East Seattle: | $142,799 |
| State: | $91,306 |
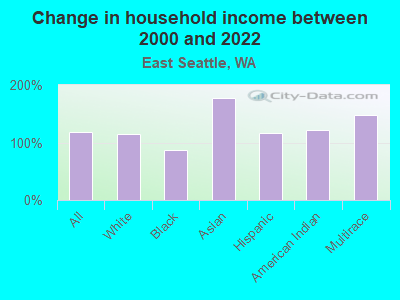
Change in median household income between 2000 and 2022:| East Seattle, Washington: | +118.7% |
| Washington: | +99.5% |
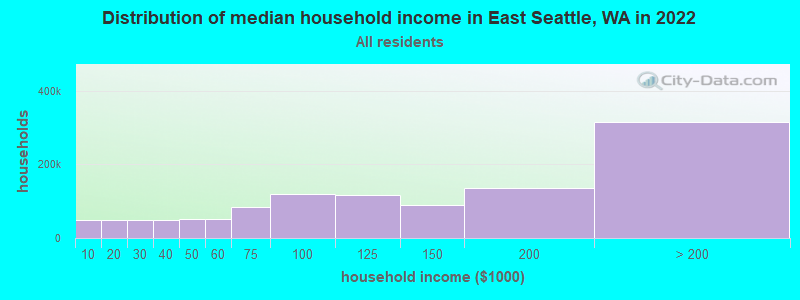
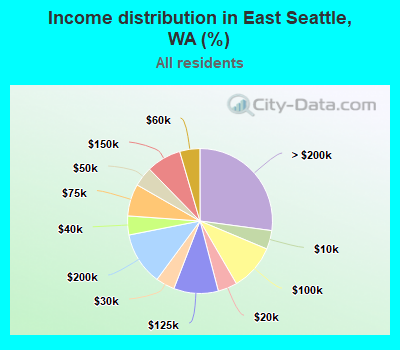
Number of households with income < $10k:| East Seattle: | 4.2% (48,623) |
| State: | 4.5% (139,331) |
Number of households with income $10k - 20k:| East Seattle: | 4.3% (49,866) |
| Washington: | 5.0% (154,508) |
Number of households with income $20k - 30k:| East Seattle: | 4.2% (49,182) |
| State: | 5.4% (166,555) |
Number of households with income $30k - 40k:| East Seattle: | 4.2% (49,246) |
| Washington: | 5.5% (170,324) |
Number of households with income $40k - 50k:| East Seattle: | 4.4% (51,166) |
| Washington: | 6.0% (183,941) |
Number of households with income $50k - 60k:| East Seattle: | 4.5% (52,430) |
| State: | 6.1% (187,395) |
Number of households with income $60k - 75k:| East Seattle: | 7.2% (83,128) |
| Washington: | 8.7% (266,771) |
Number of households with income $75k - 100k:| East Seattle: | 10.3% (119,704) |
| State: | 13.1% (404,672) |
Number of households with income $100k - 125k:| East Seattle: | 9.9% (115,451) |
| State: | 11.0% (337,911) |
Number of households with income $125k - 150k:| East Seattle: | 7.8% (90,239) |
| State: | 8.0% (244,934) |
Number of households with income $150k - 200k:| East Seattle: | 11.8% (136,859) |
| Washington: | 10.5% (323,812) |
Number of households with income > $200k:| East Seattle: | 27.1% (314,921) |
| State: | 16.2% (499,799) |
Aggregate household income in East Seattle in 2022: $156,455,836,300
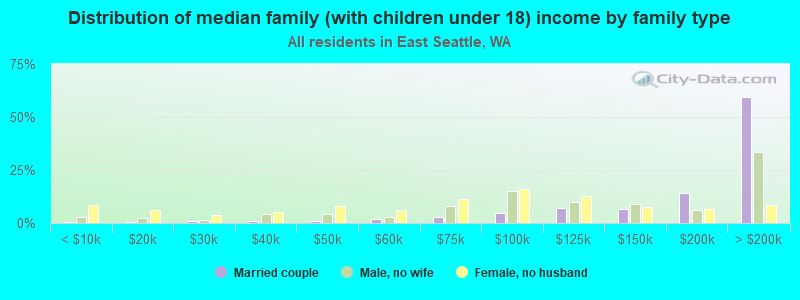
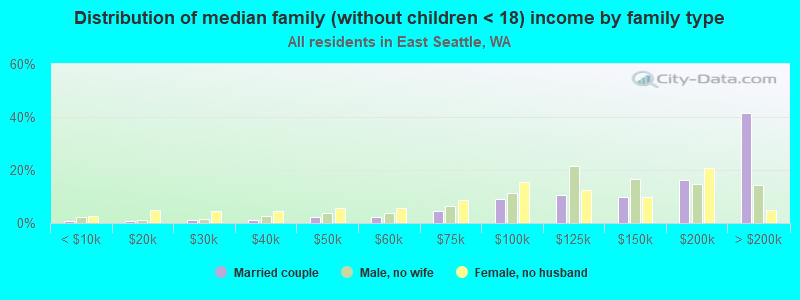
Median family income in East Seattle in 2022:| East Seattle: | $174,692 |
| State: | $109,192 |
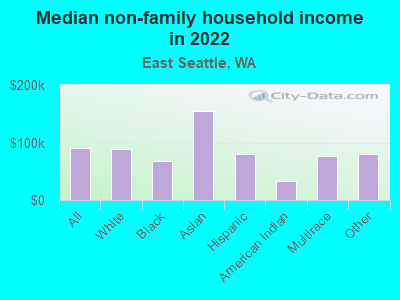
Median non-family income in East Seattle in 2022:| East Seattle: | $90,482 |
| Washington: | $57,299 |
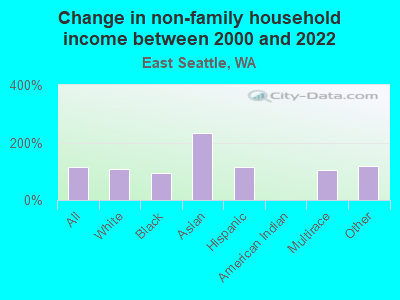
Change in median non-family income between 2000 and 2022:| East Seattle, Washington: | +114.0% |
| State: | +94.9% |
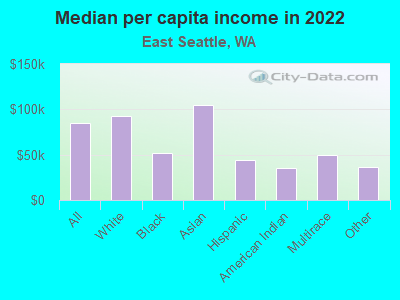
Median per capita income in East Seattle in 2022:| East Seattle: | $84,413 |
| Washington: | $50,764 |
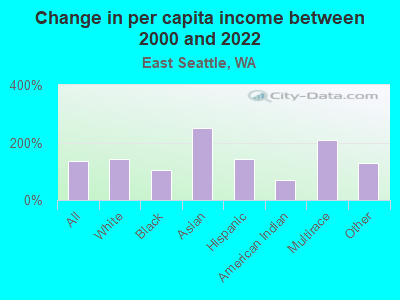
Change in median per capita income between 2000 and 2022:| East Seattle, Washington: | +136.9% |
| State: | +121.0% |
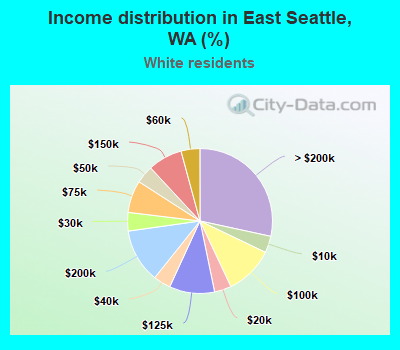
Income statistics for White residents
Median household income in East Seattle, WA in 2022:| East Seattle: | $142,963 |
| State: | $91,916 |
Change in median household income between 2000 and 2022:| East Seattle, Washington: | +114.1% |
| State: | +95.4% |
Number of households with income < $10k:| East Seattle: | 3.7% (25,614) |
| State: | 4.3% (95,850) |
Number of households with income $10k - 20k:| East Seattle: | 3.8% (25,917) |
| State: | 4.8% (106,421) |
Number of households with income $20k - 30k:| East Seattle: | 4.1% (28,628) |
| Washington: | 5.5% (122,860) |
Number of households with income $30k - 40k:| East Seattle: | 3.9% (26,606) |
| Washington: | 5.4% (119,627) |
Number of households with income $40k - 50k:| East Seattle: | 4.0% (27,530) |
| State: | 5.9% (132,276) |
Number of households with income $50k - 60k:| East Seattle: | 4.2% (29,046) |
| Washington: | 6.1% (136,212) |
Number of households with income $60k - 75k:| East Seattle: | 7.2% (49,613) |
| Washington: | 8.8% (196,086) |
Number of households with income $75k - 100k:| East Seattle: | 10.9% (75,254) |
| State: | 13.4% (299,192) |
Number of households with income $100k - 125k:| East Seattle: | 10.1% (69,774) |
| State: | 11.3% (252,209) |
Number of households with income $125k - 150k:| East Seattle: | 7.7% (53,223) |
| State: | 7.9% (175,962) |
Number of households with income $150k - 200k:| East Seattle: | 12.1% (83,254) |
| State: | 10.7% (239,156) |
Number of households with income > $200k:| East Seattle: | 28.4% (196,254) |
| Washington: | 16.1% (359,917) |
Aggregate household income in East Seattle in 2022: $100,445,001,100
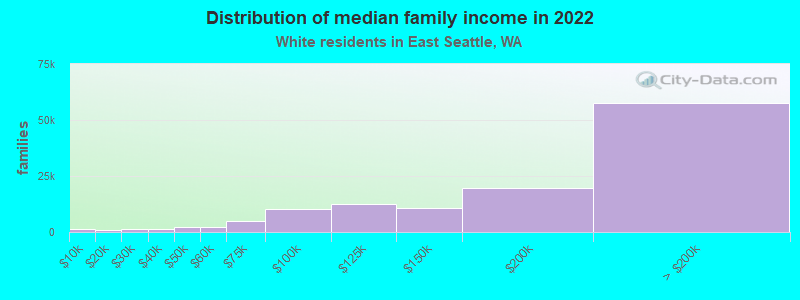
Median family income in East Seattle in 2022:| East Seattle: | $184,252 |
| Washington: | $112,511 |
Number of families with income < $10k:| East Seattle: | 0.9% (1,181) |
| State: | 2.4% (33,676) |
Number of families with income $10k - 20k:| East Seattle: | 0.8% (966) |
| State: | 2.0% (28,228) |
Number of families with income $20k - 30k:| East Seattle: | 1.1% (1,343) |
| Washington: | 2.9% (39,288) |
Number of families with income $30k - 40k:| East Seattle: | 1.0% (1,265) |
| Washington: | 3.6% (50,190) |
Number of families with income $40k - 50k:| East Seattle: | 1.9% (2,375) |
| State: | 4.6% (63,009) |
Number of families with income $50k - 60k:| East Seattle: | 1.8% (2,247) |
| State: | 5.0% (69,270) |
Number of families with income $60k - 75k:| East Seattle: | 4.1% (5,123) |
| State: | 8.2% (112,369) |
Number of families with income $75k - 100k:| East Seattle: | 8.3% (10,455) |
| Washington: | 14.1% (194,214) |
Number of families with income $100k - 125k:| East Seattle: | 9.8% (12,338) |
| State: | 13.2% (182,184) |
Number of families with income $125k - 150k:| East Seattle: | 8.7% (10,852) |
| State: | 9.5% (130,928) |
Number of families with income $150k - 200k:| East Seattle: | 15.5% (19,495) |
| State: | 13.7% (188,621) |
Number of families with income > $200k:| East Seattle: | 46.1% (57,742) |
| Washington: | 20.8% (285,982) |
Median non-family income in East Seattle in 2022:| East Seattle: | $88,838 |
| Washington: | $56,103 |
Change in median non-family income between 2000 and 2022:| East Seattle, Washington: | +109.2% |
| State: | +87.7% |
Median per capita income in East Seattle in 2022:| East Seattle: | $93,157 |
| Washington: | $55,212 |
Change in median per capita income between 2000 and 2022:| East Seattle, Washington: | +143.6% |
| State: | +123.8% |
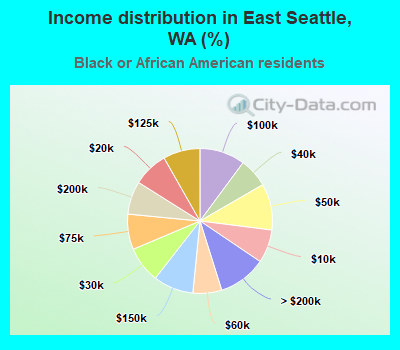
Income statistics for Black or African American residents
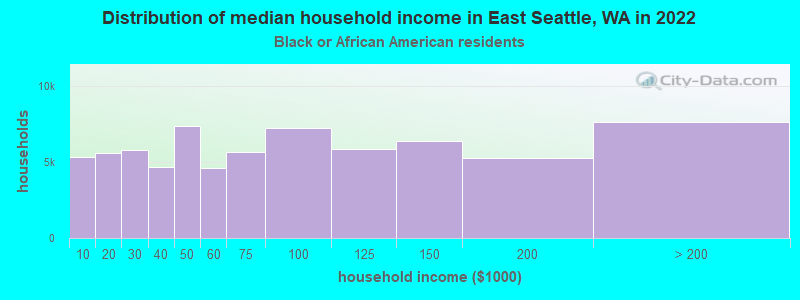
Median household income in East Seattle, WA in 2022:| East Seattle: | $84,448 |
| Washington: | $68,202 |
Change in median household income between 2000 and 2022:| East Seattle, Washington: | +87.5% |
| State: | +89.9% |
Number of households with income < $10k:| East Seattle: | 7.4% (5,312) |
| State: | 7.2% (8,014) |
Number of households with income $10k - 20k:| East Seattle: | 7.8% (5,583) |
| Washington: | 8.0% (8,904) |
Number of households with income $20k - 30k:| East Seattle: | 8.1% (5,768) |
| State: | 7.4% (8,207) |
Number of households with income $30k - 40k:| East Seattle: | 6.5% (4,654) |
| Washington: | 5.6% (6,220) |
Number of households with income $40k - 50k:| East Seattle: | 10.4% (7,382) |
| State: | 9.5% (10,585) |
Number of households with income $50k - 60k:| East Seattle: | 6.4% (4,591) |
| State: | 7.3% (8,078) |
Number of households with income $60k - 75k:| East Seattle: | 7.9% (5,630) |
| Washington: | 8.7% (9,704) |
Number of households with income $75k - 100k:| East Seattle: | 10.1% (7,227) |
| Washington: | 12.9% (14,315) |
Number of households with income $100k - 125k:| East Seattle: | 8.2% (5,873) |
| State: | 7.7% (8,592) |
Number of households with income $125k - 150k:| East Seattle: | 9.0% (6,388) |
| State: | 8.9% (9,840) |
Number of households with income $150k - 200k:| East Seattle: | 7.4% (5,275) |
| Washington: | 7.6% (8,434) |
Number of households with income > $200k:| East Seattle: | 10.7% (7,630) |
| Washington: | 9.1% (10,075) |
Aggregate household income in East Seattle in 2022: $888,404,790
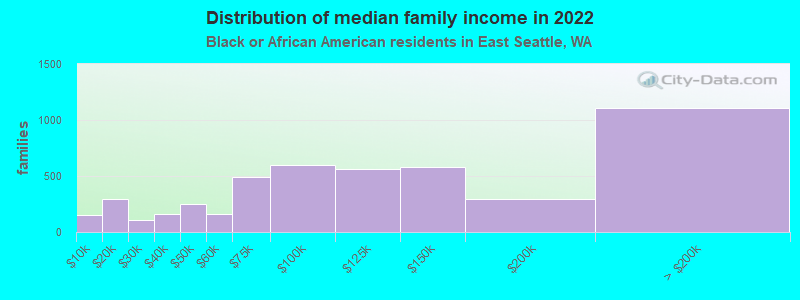
Median family income in East Seattle in 2022:| East Seattle: | $113,471 |
| State: | $82,165 |
Number of families with income < $10k:| East Seattle: | 3.3% (156) |
| State: | 5.5% (3,709) |
Number of families with income $10k - 20k:| East Seattle: | 6.3% (299) |
| State: | 7.4% (4,951) |
Number of families with income $20k - 30k:| East Seattle: | 2.3% (109) |
| State: | 4.7% (3,151) |
Number of families with income $30k - 40k:| East Seattle: | 3.3% (160) |
| State: | 5.3% (3,525) |
Number of families with income $40k - 50k:| East Seattle: | 5.3% (253) |
| State: | 6.8% (4,558) |
Number of families with income $50k - 60k:| East Seattle: | 3.3% (159) |
| State: | 7.0% (4,687) |
Number of families with income $60k - 75k:| East Seattle: | 10.2% (488) |
| State: | 9.3% (6,231) |
Number of families with income $75k - 100k:| East Seattle: | 12.6% (600) |
| Washington: | 14.8% (9,876) |
Number of families with income $100k - 125k:| East Seattle: | 11.8% (561) |
| State: | 9.0% (6,018) |
Number of families with income $125k - 150k:| East Seattle: | 12.2% (580) |
| State: | 9.5% (6,348) |
Number of families with income $150k - 200k:| East Seattle: | 6.2% (294) |
| State: | 8.6% (5,737) |
Number of families with income > $200k:| East Seattle: | 23.2% (1,106) |
| State: | 12.0% (8,041) |
Median non-family income in East Seattle in 2022:| East Seattle: | $68,513 |
| State: | $49,169 |
Change in median non-family income between 2000 and 2022:| East Seattle, Washington: | +92.8% |
| State: | +87.7% |
Median per capita income in East Seattle in 2022:| East Seattle: | $51,458 |
| Washington: | $38,209 |
Change in median per capita income between 2000 and 2022:| East Seattle, Washington: | +104.5% |
| Washington: | +115.3% |
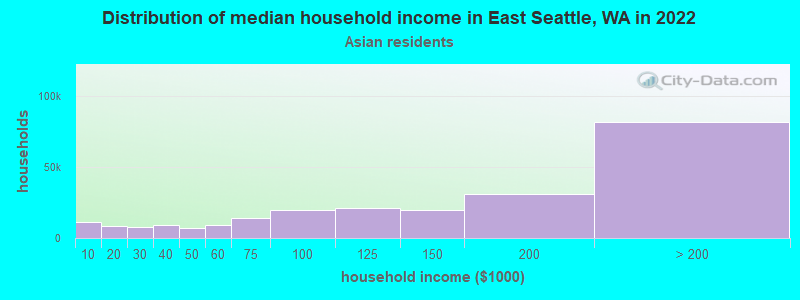
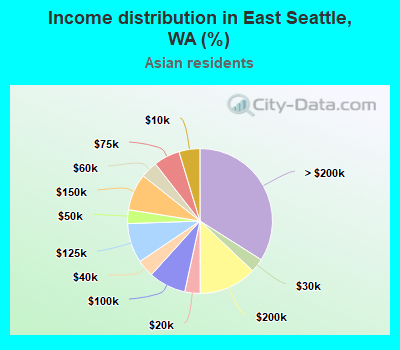
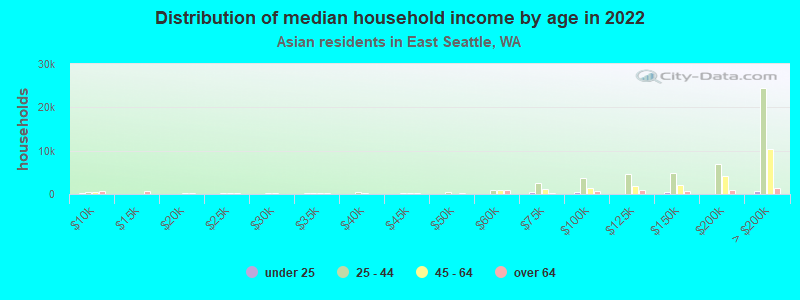
Income statistics for Asian residents
Median household income in East Seattle, WA in 2022:| East Seattle: | $181,531 |
| State: | $125,692 |
Number of households with income < $10k:| East Seattle: | 4.7% (11,217) |
| State: | 4.9% (14,099) |
Number of households with income $10k - 20k:| East Seattle: | 3.4% (8,233) |
| State: | 3.5% (9,873) |
Number of households with income $20k - 30k:| East Seattle: | 3.1% (7,445) |
| Washington: | 2.9% (8,352) |
Number of households with income $30k - 40k:| East Seattle: | 3.9% (9,273) |
| State: | 4.0% (11,415) |
Number of households with income $40k - 50k:| East Seattle: | 3.1% (7,360) |
| Washington: | 4.0% (11,421) |
Number of households with income $50k - 60k:| East Seattle: | 3.8% (9,059) |
| Washington: | 4.2% (12,100) |
Number of households with income $60k - 75k:| East Seattle: | 5.9% (14,131) |
| State: | 6.3% (17,903) |
Number of households with income $75k - 100k:| East Seattle: | 8.3% (19,992) |
| State: | 10.4% (29,663) |
Number of households with income $100k - 125k:| East Seattle: | 8.9% (21,349) |
| State: | 9.4% (26,839) |
Number of households with income $125k - 150k:| East Seattle: | 8.2% (19,718) |
| State: | 8.5% (24,200) |
Number of households with income $150k - 200k:| East Seattle: | 12.9% (31,003) |
| Washington: | 12.6% (35,976) |
Number of households with income > $200k:| East Seattle: | 34.0% (81,765) |
| Washington: | 29.2% (83,109) |
Aggregate household income in East Seattle in 2022: $25,739,630,760
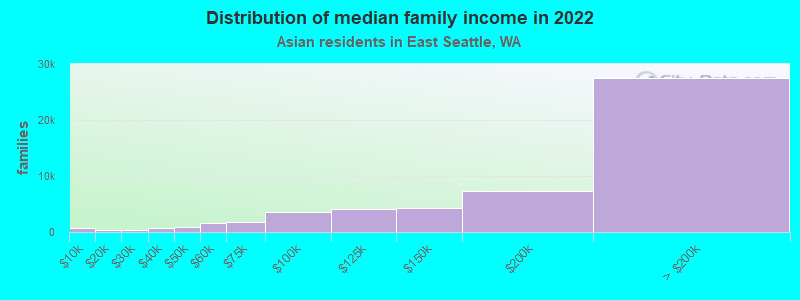
Median family income in East Seattle in 2022:| East Seattle: | $205,841 |
| Washington: | $143,595 |
Number of families with income < $10k:| East Seattle: | 1.4% (771) |
| State: | 2.9% (5,479) |
Number of families with income $10k - 20k:| East Seattle: | 0.8% (431) |
| State: | 2.2% (4,150) |
Number of families with income $20k - 30k:| East Seattle: | 0.8% (426) |
| State: | 1.9% (3,558) |
Number of families with income $30k - 40k:| East Seattle: | 1.5% (793) |
| State: | 3.1% (5,734) |
Number of families with income $40k - 50k:| East Seattle: | 1.5% (817) |
| State: | 3.6% (6,707) |
Number of families with income $50k - 60k:| East Seattle: | 3.2% (1,692) |
| Washington: | 4.1% (7,663) |
Number of families with income $60k - 75k:| East Seattle: | 3.4% (1,809) |
| State: | 5.1% (9,490) |
Number of families with income $75k - 100k:| East Seattle: | 6.7% (3,557) |
| Washington: | 11.7% (21,919) |
Number of families with income $100k - 125k:| East Seattle: | 7.6% (4,036) |
| Washington: | 9.3% (17,280) |
Number of families with income $125k - 150k:| East Seattle: | 7.9% (4,236) |
| Washington: | 8.4% (15,602) |
Number of families with income $150k - 200k:| East Seattle: | 13.7% (7,294) |
| Washington: | 13.3% (24,789) |
Number of families with income > $200k:| East Seattle: | 51.6% (27,561) |
| State: | 34.4% (64,250) |
Median non-family income in East Seattle in 2022:| East Seattle: | $154,073 |
| State: | $84,971 |
Median per capita income in East Seattle in 2022:| East Seattle: | $105,117 |
| Washington: | $67,666 |
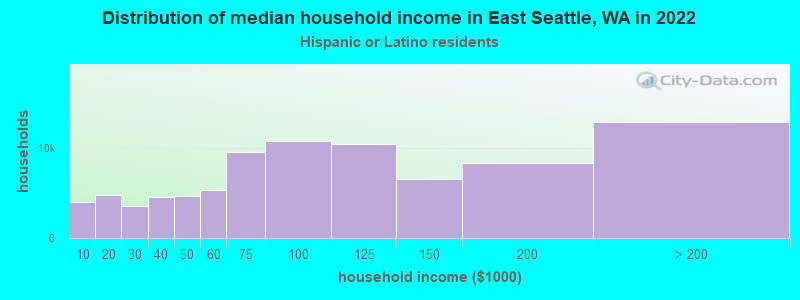
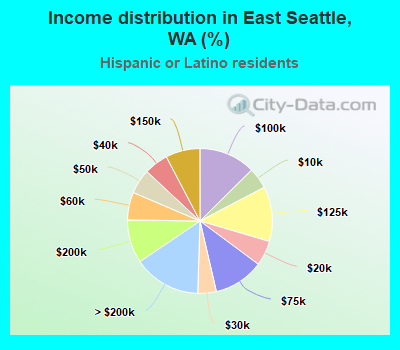
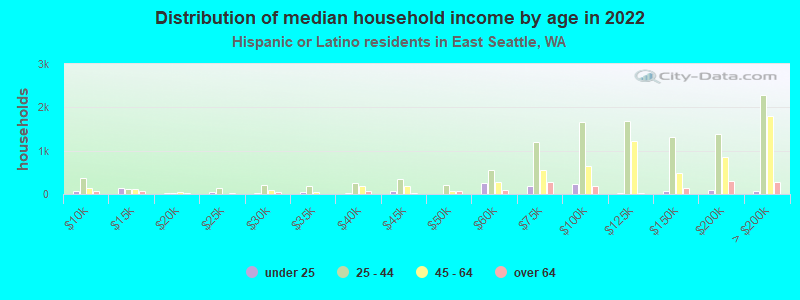
Income statistics for Hispanic or Latino residents
Median household income in East Seattle, WA in 2022:| East Seattle: | $103,784 |
| Washington: | $74,770 |
Change in median household income between 2000 and 2022:| East Seattle, Washington: | +116.8% |
| State: | +128.3% |
Number of households with income < $10k:| East Seattle: | 4.7% (4,052) |
| State: | 4.9% (14,456) |
Number of households with income $10k - 20k:| East Seattle: | 5.6% (4,832) |
| State: | 5.3% (15,449) |
Number of households with income $20k - 30k:| East Seattle: | 4.1% (3,562) |
| State: | 6.8% (20,016) |
Number of households with income $30k - 40k:| East Seattle: | 5.4% (4,629) |
| State: | 7.7% (22,548) |
Number of households with income $40k - 50k:| East Seattle: | 5.5% (4,739) |
| State: | 7.3% (21,450) |
Number of households with income $50k - 60k:| East Seattle: | 6.2% (5,335) |
| Washington: | 7.7% (22,744) |
Number of households with income $60k - 75k:| East Seattle: | 11.2% (9,645) |
| State: | 10.5% (30,737) |
Number of households with income $75k - 100k:| East Seattle: | 12.6% (10,863) |
| State: | 14.9% (43,843) |
Number of households with income $100k - 125k:| East Seattle: | 12.2% (10,541) |
| State: | 11.1% (32,554) |
Number of households with income $125k - 150k:| East Seattle: | 7.7% (6,616) |
| Washington: | 7.4% (21,624) |
Number of households with income $150k - 200k:| East Seattle: | 9.7% (8,357) |
| State: | 7.3% (21,360) |
Number of households with income > $200k:| East Seattle: | 15.0% (12,944) |
| Washington: | 9.2% (27,055) |
Aggregate household income in East Seattle in 2022: $2,252,251,133
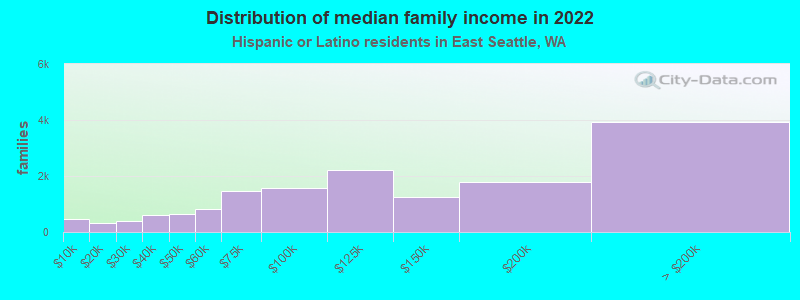
Median family income in East Seattle in 2022:| East Seattle: | $112,315 |
| State: | $76,866 |
Number of families with income < $10k:| East Seattle: | 2.9% (448) |
| Washington: | 4.4% (9,443) |
Number of families with income $10k - 20k:| East Seattle: | 2.1% (332) |
| State: | 3.5% (7,524) |
Number of families with income $20k - 30k:| East Seattle: | 2.5% (391) |
| State: | 5.6% (12,052) |
Number of families with income $30k - 40k:| East Seattle: | 3.9% (611) |
| Washington: | 8.3% (17,803) |
Number of families with income $40k - 50k:| East Seattle: | 4.1% (636) |
| State: | 7.7% (16,361) |
Number of families with income $50k - 60k:| East Seattle: | 5.2% (806) |
| State: | 7.9% (16,852) |
Number of families with income $60k - 75k:| East Seattle: | 9.4% (1,454) |
| Washington: | 11.4% (24,342) |
Number of families with income $75k - 100k:| East Seattle: | 10.1% (1,562) |
| State: | 14.4% (30,698) |
Number of families with income $100k - 125k:| East Seattle: | 14.4% (2,228) |
| Washington: | 11.4% (24,331) |
Number of families with income $125k - 150k:| East Seattle: | 8.2% (1,266) |
| State: | 7.5% (16,099) |
Number of families with income $150k - 200k:| East Seattle: | 11.7% (1,802) |
| Washington: | 8.2% (17,551) |
Number of families with income > $200k:| East Seattle: | 25.4% (3,926) |
| State: | 9.7% (20,653) |
Median non-family income in East Seattle in 2022:| East Seattle: | $80,344 |
| State: | $54,173 |
Change in median non-family income between 2000 and 2022:| East Seattle, Washington: | +115.4% |
| Washington: | +105.8% |
Median per capita income in East Seattle in 2022:| East Seattle: | $43,934 |
| State: | $28,252 |
Change in median per capita income between 2000 and 2022:| East Seattle, Washington: | +141.5% |
| State: | +150.2% |
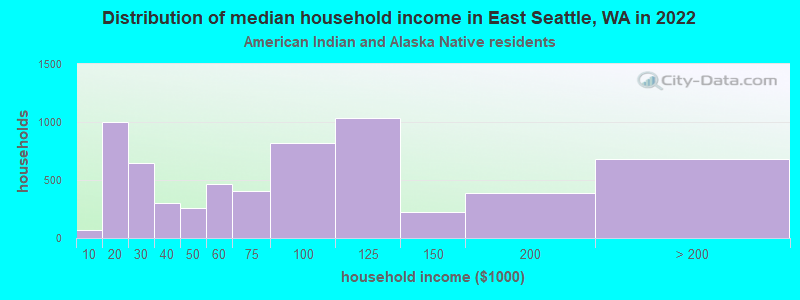
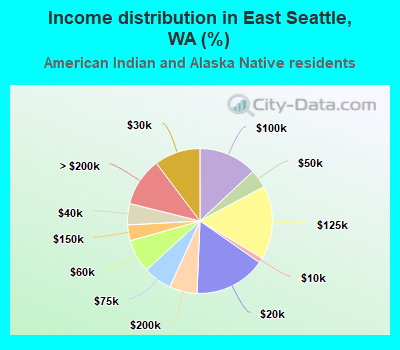
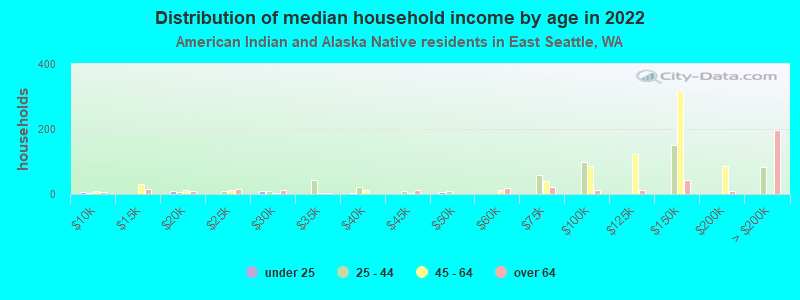
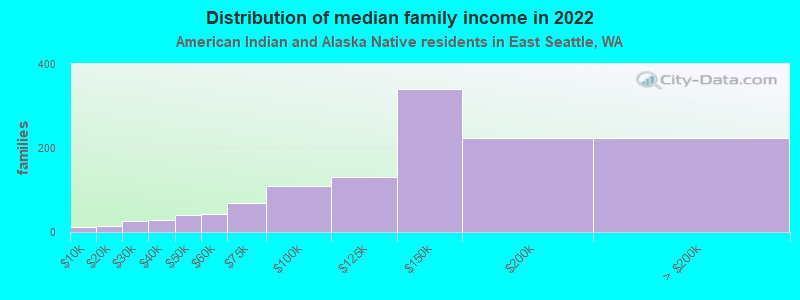
Income statistics for American Indian and Alaska Native residents
Median household income in East Seattle, WA in 2022:| East Seattle: | $97,508 |
| State: | $71,255 |
Change in median household income between 2000 and 2022:| East Seattle, Washington: | +120.6% |
| Washington: | +118.1% |
Number of households with income < $10k:| East Seattle: | 1.1% (71) |
| Washington: | 5.9% (1,768) |
Number of households with income $10k - 20k:| East Seattle: | 15.9% (1,003) |
| State: | 8.9% (2,694) |
Number of households with income $20k - 30k:| East Seattle: | 10.3% (647) |
| State: | 8.0% (2,412) |
Number of households with income $30k - 40k:| East Seattle: | 4.7% (298) |
| State: | 7.7% (2,327) |
Number of households with income $40k - 50k:| East Seattle: | 4.1% (260) |
| State: | 5.8% (1,755) |
Number of households with income $50k - 60k:| East Seattle: | 7.4% (464) |
| Washington: | 7.5% (2,259) |
Number of households with income $60k - 75k:| East Seattle: | 6.4% (402) |
| State: | 8.8% (2,669) |
Number of households with income $75k - 100k:| East Seattle: | 13.0% (820) |
| State: | 12.8% (3,861) |
Number of households with income $100k - 125k:| East Seattle: | 16.4% (1,034) |
| State: | 12.0% (3,618) |
Number of households with income $125k - 150k:| East Seattle: | 3.5% (223) |
| State: | 8.6% (2,580) |
Number of households with income $150k - 200k:| East Seattle: | 6.2% (388) |
| State: | 5.9% (1,774) |
Number of households with income > $200k:| East Seattle: | 10.8% (681) |
| Washington: | 8.1% (2,447) |
Aggregate household income in East Seattle in 2022: $97,318,858
Median family income in East Seattle in 2022:| East Seattle: | $100,483 |
| State: | $79,010 |
Number of families with income < $10k:| East Seattle: | 0.8% (11) |
| State: | 5.2% (1,047) |
Number of families with income $10k - 20k:| East Seattle: | 1.2% (15) |
| Washington: | 5.2% (1,056) |
Number of families with income $20k - 30k:| East Seattle: | 2.1% (26) |
| State: | 6.2% (1,258) |
Number of families with income $30k - 40k:| East Seattle: | 2.2% (28) |
| State: | 5.9% (1,190) |
Number of families with income $40k - 50k:| East Seattle: | 3.2% (40) |
| Washington: | 4.6% (927) |
Number of families with income $50k - 60k:| East Seattle: | 3.5% (44) |
| State: | 9.7% (1,973) |
Number of families with income $60k - 75k:| East Seattle: | 5.6% (70) |
| State: | 10.5% (2,124) |
Number of families with income $75k - 100k:| East Seattle: | 8.6% (109) |
| State: | 13.1% (2,669) |
Number of families with income $100k - 125k:| East Seattle: | 10.4% (131) |
| State: | 13.7% (2,784) |
Number of families with income $125k - 150k:| East Seattle: | 26.9% (340) |
| Washington: | 9.8% (2,000) |
Number of families with income $150k - 200k:| East Seattle: | 17.8% (225) |
| State: | 7.8% (1,584) |
Number of families with income > $200k:| East Seattle: | 17.7% (223) |
| Washington: | 8.4% (1,698) |
Median non-family income in East Seattle in 2022:| East Seattle: | $32,242 |
| State: | $35,591 |
Median per capita income in East Seattle in 2022:| East Seattle: | $35,089 |
| State: | $27,053 |
Change in median per capita income between 2000 and 2022:| East Seattle, Washington: | +68.7% |
| Washington: | +98.6% |
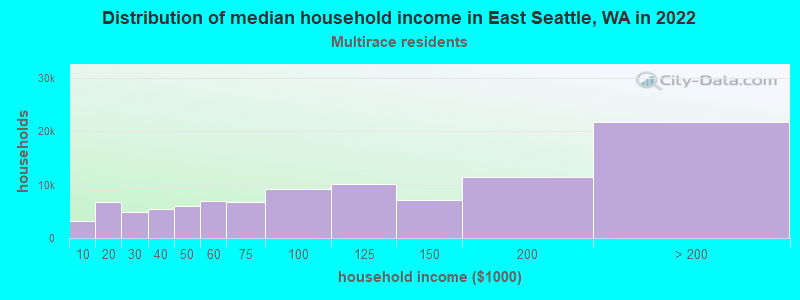
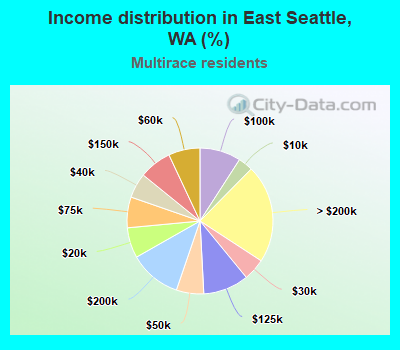
Income statistics for Multirace residents
Median household income in East Seattle, WA in 2022:| East Seattle: | $128,842 |
| State: | $84,303 |
Change in median household income between 2000 and 2022:| East Seattle, Washington: | +146.6% |
| State: | +125.7% |
Number of households with income < $10k:| East Seattle: | 3.3% (3,264) |
| Washington: | 4.3% (12,040) |
Number of households with income $10k - 20k:| East Seattle: | 6.7% (6,705) |
| State: | 6.6% (18,437) |
Number of households with income $20k - 30k:| East Seattle: | 4.9% (4,853) |
| State: | 5.2% (14,559) |
Number of households with income $30k - 40k:| East Seattle: | 5.5% (5,518) |
| Washington: | 6.7% (18,491) |
Number of households with income $40k - 50k:| East Seattle: | 6.1% (6,050) |
| Washington: | 6.3% (17,459) |
Number of households with income $50k - 60k:| East Seattle: | 7.0% (6,962) |
| State: | 6.9% (19,086) |
Number of households with income $60k - 75k:| East Seattle: | 6.8% (6,791) |
| State: | 9.1% (25,310) |
Number of households with income $75k - 100k:| East Seattle: | 9.1% (9,094) |
| State: | 13.5% (37,493) |
Number of households with income $100k - 125k:| East Seattle: | 10.1% (10,090) |
| State: | 10.7% (29,626) |
Number of households with income $125k - 150k:| East Seattle: | 7.2% (7,144) |
| State: | 8.6% (23,899) |
Number of households with income $150k - 200k:| East Seattle: | 11.5% (11,500) |
| Washington: | 10.2% (28,214) |
Number of households with income > $200k:| East Seattle: | 21.8% (21,736) |
| Washington: | 11.9% (32,947) |
Aggregate household income in East Seattle in 2022: $2,621,770,724
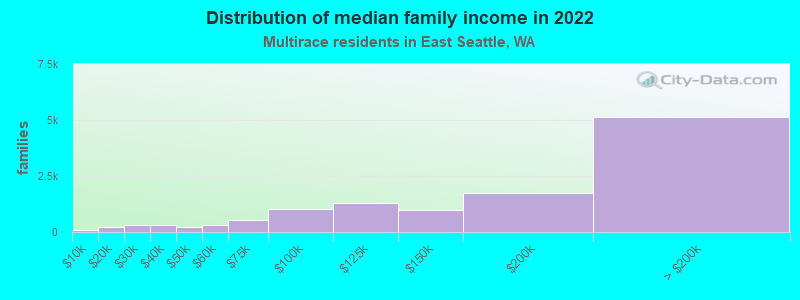
Median family income in East Seattle in 2022:| East Seattle: | $175,004 |
| State: | $95,629 |
Number of families with income < $10k:| East Seattle: | 0.6% (68) |
| Washington: | 3.5% (6,121) |
Number of families with income $10k - 20k:| East Seattle: | 1.7% (201) |
| Washington: | 4.3% (7,519) |
Number of families with income $20k - 30k:| East Seattle: | 2.4% (293) |
| State: | 4.4% (7,775) |
Number of families with income $30k - 40k:| East Seattle: | 2.5% (307) |
| Washington: | 5.8% (10,186) |
Number of families with income $40k - 50k:| East Seattle: | 1.7% (210) |
| State: | 5.9% (10,412) |
Number of families with income $50k - 60k:| East Seattle: | 2.8% (334) |
| State: | 5.6% (9,922) |
Number of families with income $60k - 75k:| East Seattle: | 4.4% (530) |
| Washington: | 9.7% (17,113) |
Number of families with income $75k - 100k:| East Seattle: | 8.3% (1,009) |
| State: | 13.6% (23,984) |
Number of families with income $100k - 125k:| East Seattle: | 10.6% (1,282) |
| State: | 10.4% (18,288) |
Number of families with income $125k - 150k:| East Seattle: | 8.1% (974) |
| Washington: | 10.5% (18,481) |
Number of families with income $150k - 200k:| East Seattle: | 14.4% (1,743) |
| Washington: | 11.9% (20,852) |
Number of families with income > $200k:| East Seattle: | 42.5% (5,139) |
| State: | 14.4% (25,289) |
Median non-family income in East Seattle in 2022:| East Seattle: | $76,621 |
| Washington: | $56,573 |
Change in median non-family income between 2000 and 2022:| East Seattle, Washington: | +106.1% |
| State: | +115.0% |
Median per capita income in East Seattle in 2022:| East Seattle: | $49,384 |
| State: | $32,496 |
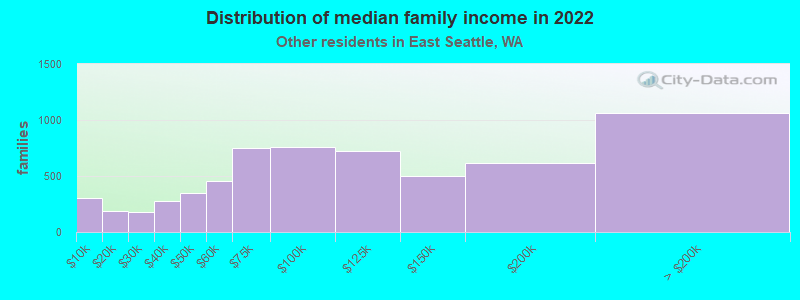
Income statistics for other residents
Number of households with income < $10k:| East Seattle: | 7.0% (592) |
| Washington: | 5.3% (6,540) |
Number of households with income $10k - 20k:| East Seattle: | 4.5% (378) |
| Washington: | 6.0% (7,385) |
Number of households with income $20k - 30k:| East Seattle: | 3.0% (252) |
| State: | 7.5% (9,289) |
Number of households with income $30k - 40k:| East Seattle: | 6.1% (515) |
| State: | 8.9% (11,015) |
Number of households with income $40k - 50k:| East Seattle: | 6.3% (528) |
| State: | 7.6% (9,399) |
Number of households with income $50k - 60k:| East Seattle: | 4.2% (351) |
| Washington: | 7.2% (8,867) |
Number of households with income $60k - 75k:| East Seattle: | 13.1% (1,102) |
| State: | 10.5% (13,032) |
Number of households with income $75k - 100k:| East Seattle: | 13.7% (1,149) |
| Washington: | 14.6% (18,007) |
Number of households with income $100k - 125k:| East Seattle: | 14.5% (1,221) |
| State: | 12.2% (15,128) |
Number of households with income $125k - 150k:| East Seattle: | 5.7% (475) |
| State: | 5.6% (6,950) |
Number of households with income $150k - 200k:| East Seattle: | 11.1% (928) |
| State: | 7.1% (8,749) |
Number of households with income > $200k:| East Seattle: | 10.8% (907) |
| State: | 7.5% (9,208) |
Aggregate household income in East Seattle in 2022: $873,663,992
Median family income in East Seattle in 2022:| East Seattle: | $90,170 |
| State: | $72,588 |
Number of families with income < $10k:| East Seattle: | 4.9% (300) |
| State: | 5.5% (5,287) |
Number of families with income $10k - 20k:| East Seattle: | 3.0% (185) |
| Washington: | 4.0% (3,814) |
Number of families with income $20k - 30k:| East Seattle: | 2.8% (175) |
| State: | 6.6% (6,293) |
Number of families with income $30k - 40k:| East Seattle: | 4.5% (279) |
| State: | 9.2% (8,827) |
Number of families with income $40k - 50k:| East Seattle: | 5.6% (346) |
| State: | 8.0% (7,634) |
Number of families with income $50k - 60k:| East Seattle: | 7.4% (457) |
| State: | 7.7% (7,357) |
Number of families with income $60k - 75k:| East Seattle: | 12.2% (753) |
| Washington: | 10.3% (9,864) |
Number of families with income $75k - 100k:| East Seattle: | 12.3% (760) |
| State: | 14.5% (13,800) |
Number of families with income $100k - 125k:| East Seattle: | 11.7% (723) |
| State: | 12.9% (12,298) |
Number of families with income $125k - 150k:| East Seattle: | 8.1% (498) |
| Washington: | 6.0% (5,679) |
Number of families with income $150k - 200k:| East Seattle: | 10.0% (619) |
| State: | 8.2% (7,822) |
Number of families with income > $200k:| East Seattle: | 17.3% (1,062) |
| State: | 7.1% (6,764) |
Median non-family income in East Seattle in 2022:| East Seattle: | $79,579 |
| Washington: | $44,777 |
Change in median non-family income between 2000 and 2022:| East Seattle, Washington: | +120.5% |
| State: | +84.2% |
Median per capita income in East Seattle in 2022:| East Seattle: | $36,839 |
| Washington: | $27,542 |
Change in median per capita income between 2000 and 2022:| East Seattle, Washington: | +128.7% |
| State: | +167.8% |