East San Gabriel Valley, California (CA) income map, earnings map, and wages data
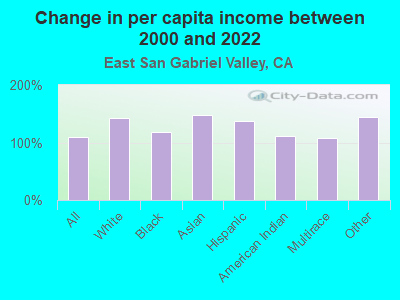
The median household income in East San Gabriel Valley, CA in 2022 was $101,464, which was 9.8% greater than the median annual income of $91,551 across the entire state of California. Compared to the median income of $51,877 in 2000 this represents an increase of 48.9%. The per capita income in 2022 was $38,768, which means an increase of 52.1% compared to 2000 when it was $18,574.
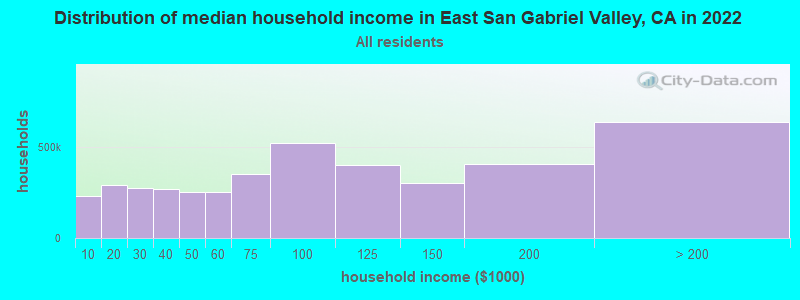
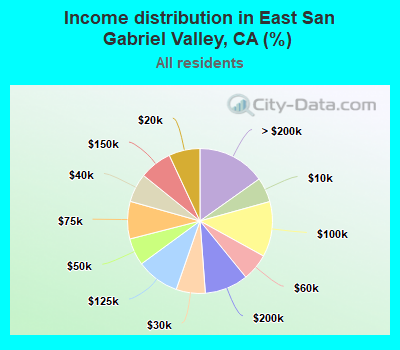
Income statistics for all residents
Median household income in East San Gabriel Valley, CA in 2022:| East San Gabriel Valley: | $101,464 |
| State: | $91,551 |
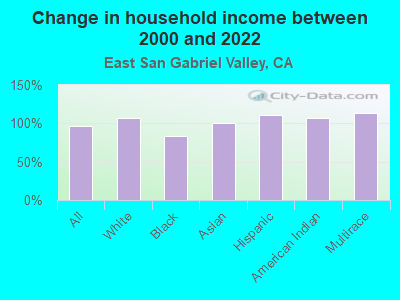
Change in median household income between 2000 and 2022:| East San Gabriel Valley, California: | +95.6% |
| State: | +92.8% |
Number of households with income < $10k:| East San Gabriel Valley: | 5.5% (231,214) |
| State: | 4.8% (654,370) |
Number of households with income $10k - 20k:| East San Gabriel Valley: | 6.9% (291,471) |
| State: | 5.8% (789,493) |
Number of households with income $20k - 30k:| East San Gabriel Valley: | 6.5% (273,467) |
| California: | 5.7% (778,318) |
Number of households with income $30k - 40k:| East San Gabriel Valley: | 6.4% (269,868) |
| State: | 5.8% (783,170) |
Number of households with income $40k - 50k:| East San Gabriel Valley: | 6.1% (255,155) |
| State: | 5.8% (781,352) |
Number of households with income $50k - 60k:| East San Gabriel Valley: | 6.1% (255,359) |
| State: | 5.6% (760,175) |
Number of households with income $60k - 75k:| East San Gabriel Valley: | 8.4% (351,754) |
| State: | 8.2% (1,104,699) |
Number of households with income $75k - 100k:| East San Gabriel Valley: | 12.4% (519,198) |
| State: | 12.0% (1,627,633) |
Number of households with income $100k - 125k:| East San Gabriel Valley: | 9.6% (403,363) |
| California: | 10.0% (1,358,619) |
Number of households with income $125k - 150k:| East San Gabriel Valley: | 7.2% (304,292) |
| California: | 7.6% (1,027,455) |
Number of households with income $150k - 200k:| East San Gabriel Valley: | 9.7% (407,628) |
| State: | 10.6% (1,439,811) |
Number of households with income > $200k:| East San Gabriel Valley: | 15.2% (637,321) |
| California: | 18.0% (2,445,491) |
Aggregate household income in East San Gabriel Valley in 2022: $410,815,007,900
Median family income in East San Gabriel Valley in 2022:| East San Gabriel Valley: | $110,371 |
| State: | $104,823 |
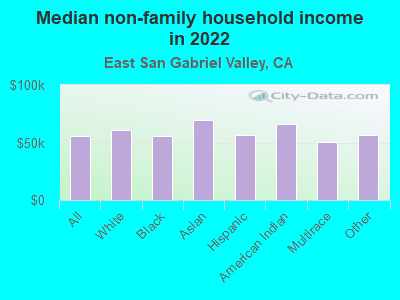
Median non-family income in East San Gabriel Valley in 2022:| East San Gabriel Valley: | $55,792 |
| State: | $59,348 |
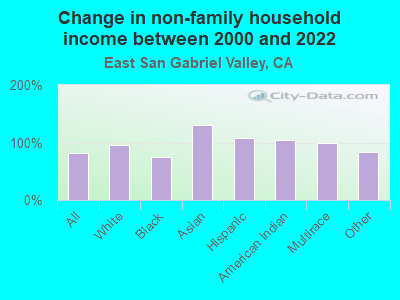
Change in median non-family income between 2000 and 2022:| East San Gabriel Valley, California: | +81.8% |
| California: | +85.3% |
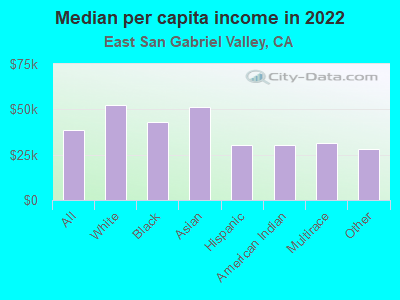
Median per capita income in East San Gabriel Valley in 2022:| East San Gabriel Valley: | $38,769 |
| State: | $46,661 |
Change in median per capita income between 2000 and 2022:| East San Gabriel Valley, California: | +108.7% |
| State: | +105.5% |
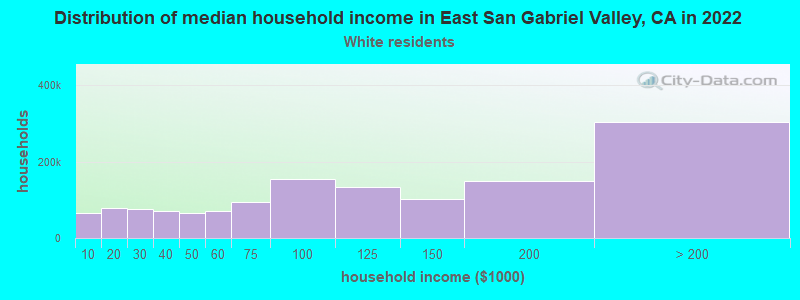
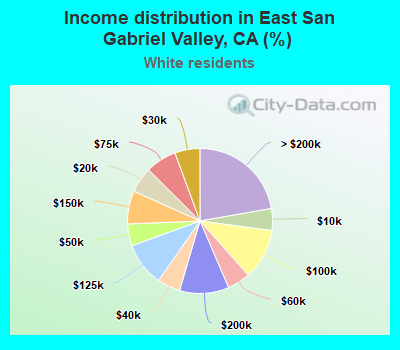
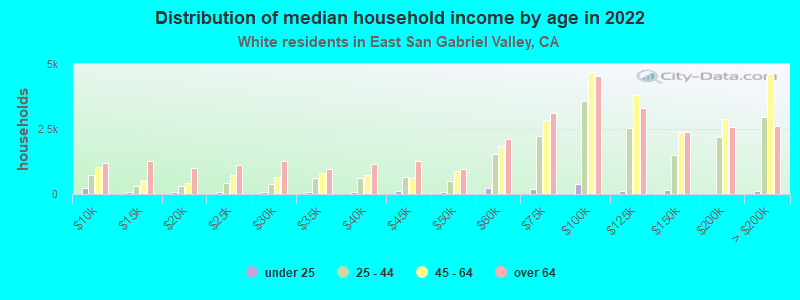
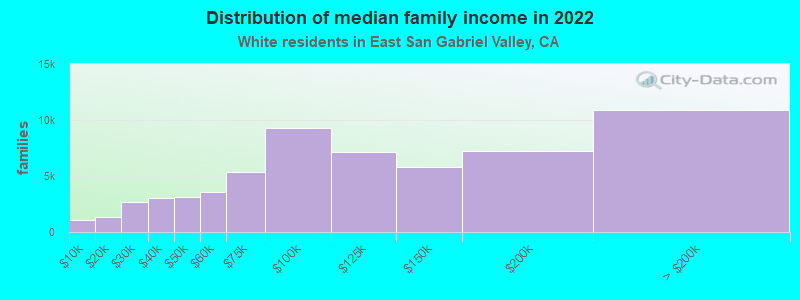
Income statistics for White residents
Median household income in East San Gabriel Valley, CA in 2022:| East San Gabriel Valley: | $109,709 |
| State: | $100,917 |
Change in median household income between 2000 and 2022:| East San Gabriel Valley, California: | +107.4% |
| State: | +96.8% |
Number of households with income < $10k:| East San Gabriel Valley: | 4.9% (66,248) |
| State: | 4.4% (284,109) |
Number of households with income $10k - 20k:| East San Gabriel Valley: | 5.7% (77,870) |
| State: | 5.3% (340,330) |
Number of households with income $20k - 30k:| East San Gabriel Valley: | 5.6% (76,426) |
| State: | 5.3% (343,145) |
Number of households with income $30k - 40k:| East San Gabriel Valley: | 5.2% (70,297) |
| State: | 5.1% (330,146) |
Number of households with income $40k - 50k:| East San Gabriel Valley: | 4.9% (66,499) |
| State: | 5.2% (335,310) |
Number of households with income $50k - 60k:| East San Gabriel Valley: | 5.1% (70,065) |
| State: | 5.1% (326,299) |
Number of households with income $60k - 75k:| East San Gabriel Valley: | 6.9% (94,406) |
| State: | 7.6% (487,640) |
Number of households with income $75k - 100k:| East San Gabriel Valley: | 11.3% (153,876) |
| California: | 11.5% (736,578) |
Number of households with income $100k - 125k:| East San Gabriel Valley: | 9.8% (132,984) |
| State: | 10.1% (648,782) |
Number of households with income $125k - 150k:| East San Gabriel Valley: | 7.4% (101,089) |
| State: | 7.8% (499,671) |
Number of households with income $150k - 200k:| East San Gabriel Valley: | 11.0% (149,983) |
| State: | 11.4% (729,603) |
Number of households with income > $200k:| East San Gabriel Valley: | 22.3% (303,558) |
| State: | 21.2% (1,364,246) |
Aggregate household income in East San Gabriel Valley in 2022: $188,475,940,600
Median family income in East San Gabriel Valley in 2022:| East San Gabriel Valley: | $135,864 |
| State: | $125,379 |
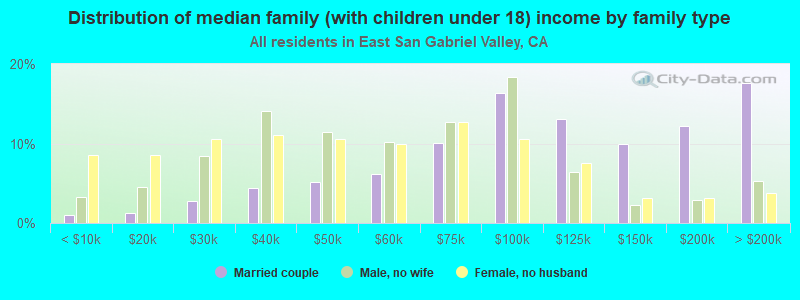
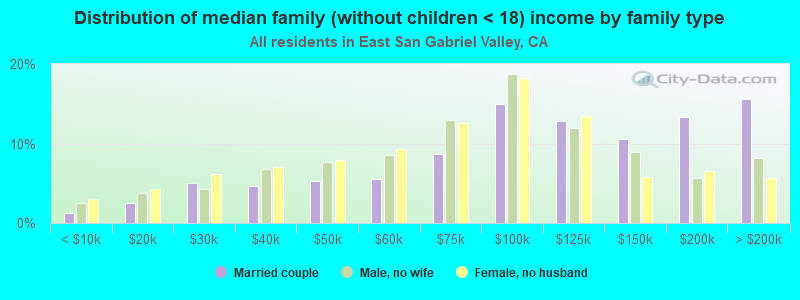
Number of families with income < $10k:| East San Gabriel Valley: | 1.8% (1,109) |
| California: | 2.2% (87,079) |
Number of families with income $10k - 20k:| East San Gabriel Valley: | 2.2% (1,316) |
| California: | 2.5% (97,716) |
Number of families with income $20k - 30k:| East San Gabriel Valley: | 4.4% (2,647) |
| California: | 3.5% (137,295) |
Number of families with income $30k - 40k:| East San Gabriel Valley: | 5.0% (3,022) |
| California: | 3.9% (152,947) |
Number of families with income $40k - 50k:| East San Gabriel Valley: | 5.2% (3,147) |
| State: | 4.3% (169,197) |
Number of families with income $50k - 60k:| East San Gabriel Valley: | 5.9% (3,546) |
| California: | 4.5% (176,192) |
Number of families with income $60k - 75k:| East San Gabriel Valley: | 8.9% (5,363) |
| State: | 7.0% (274,752) |
Number of families with income $75k - 100k:| East San Gabriel Valley: | 15.3% (9,266) |
| California: | 11.3% (445,632) |
Number of families with income $100k - 125k:| East San Gabriel Valley: | 11.8% (7,123) |
| California: | 10.7% (423,630) |
Number of families with income $125k - 150k:| East San Gabriel Valley: | 9.6% (5,775) |
| State: | 9.1% (357,408) |
Number of families with income $150k - 200k:| East San Gabriel Valley: | 11.9% (7,195) |
| State: | 13.5% (532,693) |
Number of families with income > $200k:| East San Gabriel Valley: | 18.0% (10,874) |
| State: | 27.6% (1,086,948) |
Median non-family income in East San Gabriel Valley in 2022:| East San Gabriel Valley: | $60,594 |
| State: | $62,819 |
Change in median non-family income between 2000 and 2022:| East San Gabriel Valley, California: | +96.2% |
| State: | +84.4% |
Median per capita income in East San Gabriel Valley in 2022:| East San Gabriel Valley: | $52,508 |
| State: | $61,706 |
Change in median per capita income between 2000 and 2022:| East San Gabriel Valley, California: | +142.5% |
| State: | +122.7% |
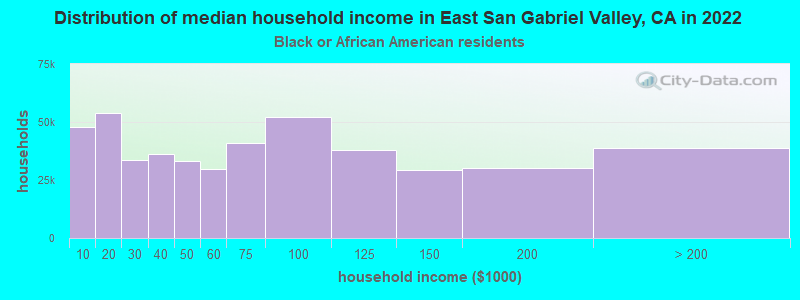
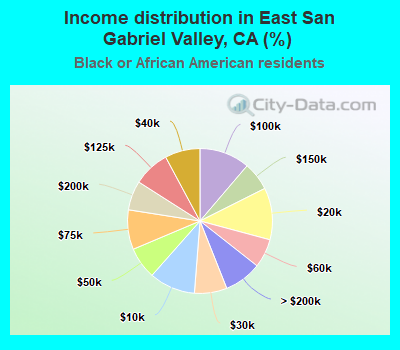
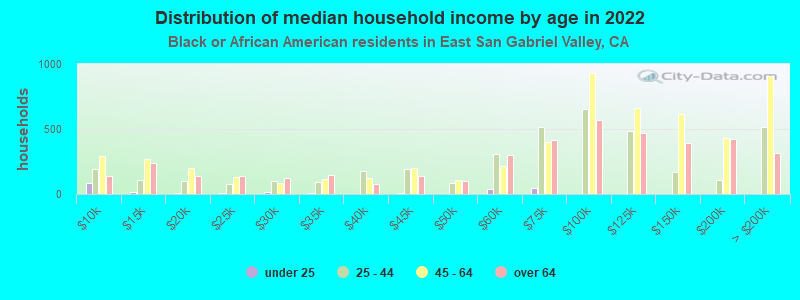
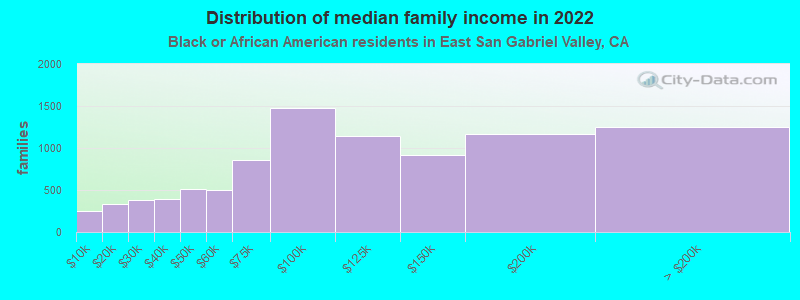
Income statistics for Black or African American residents
Median household income in East San Gabriel Valley, CA in 2022:| East San Gabriel Valley: | $87,178 |
| State: | $63,268 |
Change in median household income between 2000 and 2022:| East San Gabriel Valley, California: | +83.6% |
| State: | +81.0% |
Number of households with income < $10k:| East San Gabriel Valley: | 10.3% (47,712) |
| State: | 9.0% (73,219) |
Number of households with income $10k - 20k:| East San Gabriel Valley: | 11.6% (53,749) |
| State: | 10.6% (86,666) |
Number of households with income $20k - 30k:| East San Gabriel Valley: | 7.3% (33,689) |
| State: | 7.1% (57,719) |
Number of households with income $30k - 40k:| East San Gabriel Valley: | 7.8% (36,351) |
| California: | 7.2% (58,714) |
Number of households with income $40k - 50k:| East San Gabriel Valley: | 7.1% (32,975) |
| State: | 7.1% (58,075) |
Number of households with income $50k - 60k:| East San Gabriel Valley: | 6.4% (29,870) |
| California: | 6.8% (55,229) |
Number of households with income $60k - 75k:| East San Gabriel Valley: | 8.9% (41,111) |
| State: | 8.8% (71,895) |
Number of households with income $75k - 100k:| East San Gabriel Valley: | 11.2% (52,205) |
| California: | 11.9% (96,893) |
Number of households with income $100k - 125k:| East San Gabriel Valley: | 8.1% (37,776) |
| California: | 8.7% (70,729) |
Number of households with income $125k - 150k:| East San Gabriel Valley: | 6.4% (29,488) |
| State: | 6.3% (51,211) |
Number of households with income $150k - 200k:| East San Gabriel Valley: | 6.5% (30,361) |
| State: | 7.2% (58,687) |
Number of households with income > $200k:| East San Gabriel Valley: | 8.4% (38,882) |
| State: | 9.3% (75,487) |
Aggregate household income in East San Gabriel Valley in 2022: $9,591,875,253
Median family income in East San Gabriel Valley in 2022:| East San Gabriel Valley: | $108,948 |
| State: | $77,263 |
Number of families with income < $10k:| East San Gabriel Valley: | 2.8% (253) |
| State: | 5.9% (27,037) |
Number of families with income $10k - 20k:| East San Gabriel Valley: | 3.6% (328) |
| State: | 6.4% (29,505) |
Number of families with income $20k - 30k:| East San Gabriel Valley: | 4.1% (376) |
| State: | 5.6% (25,755) |
Number of families with income $30k - 40k:| East San Gabriel Valley: | 4.3% (395) |
| State: | 6.8% (30,948) |
Number of families with income $40k - 50k:| East San Gabriel Valley: | 5.6% (515) |
| California: | 8.3% (38,171) |
Number of families with income $50k - 60k:| East San Gabriel Valley: | 5.5% (501) |
| California: | 7.0% (31,860) |
Number of families with income $60k - 75k:| East San Gabriel Valley: | 9.3% (856) |
| California: | 8.7% (40,021) |
Number of families with income $75k - 100k:| East San Gabriel Valley: | 16.1% (1,474) |
| State: | 12.4% (56,846) |
Number of families with income $100k - 125k:| East San Gabriel Valley: | 12.4% (1,138) |
| State: | 9.8% (44,911) |
Number of families with income $125k - 150k:| East San Gabriel Valley: | 10.0% (913) |
| State: | 7.5% (34,434) |
Number of families with income $150k - 200k:| East San Gabriel Valley: | 12.7% (1,167) |
| State: | 9.3% (42,807) |
Number of families with income > $200k:| East San Gabriel Valley: | 13.6% (1,245) |
| California: | 12.2% (56,093) |
Median non-family income in East San Gabriel Valley in 2022:| East San Gabriel Valley: | $55,987 |
| State: | $41,942 |
Change in median non-family income between 2000 and 2022:| East San Gabriel Valley, California: | +73.5% |
| State: | +72.0% |
Median per capita income in East San Gabriel Valley in 2022:| East San Gabriel Valley: | $42,933 |
| State: | $36,708 |
Change in median per capita income between 2000 and 2022:| East San Gabriel Valley, California: | +117.9% |
| State: | +110.4% |
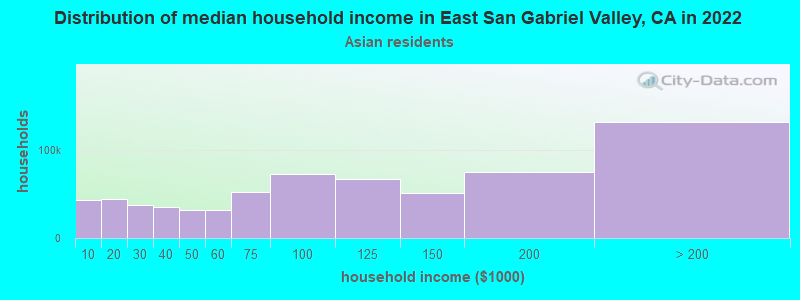
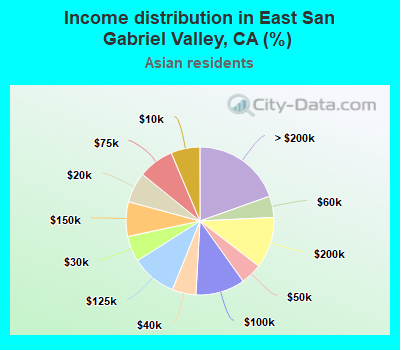
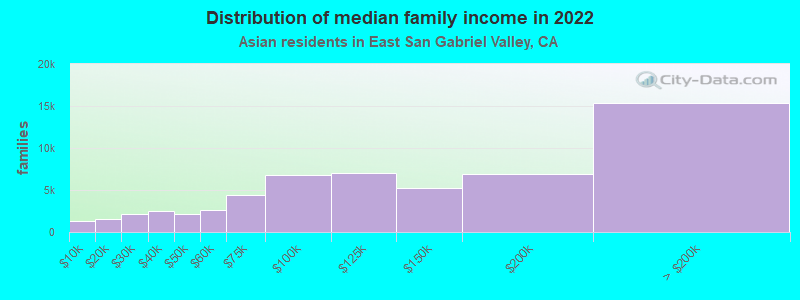
Income statistics for Asian residents
Median household income in East San Gabriel Valley, CA in 2022:| East San Gabriel Valley: | $121,028 |
| California: | $119,861 |
Change in median household income between 2000 and 2022:| East San Gabriel Valley, California: | +101.1% |
| State: | +116.5% |
Number of households with income < $10k:| East San Gabriel Valley: | 6.3% (42,861) |
| State: | 5.1% (106,273) |
Number of households with income $10k - 20k:| East San Gabriel Valley: | 6.6% (44,952) |
| California: | 4.9% (101,815) |
Number of households with income $20k - 30k:| East San Gabriel Valley: | 5.6% (38,027) |
| State: | 4.6% (94,414) |
Number of households with income $30k - 40k:| East San Gabriel Valley: | 5.2% (35,181) |
| State: | 4.1% (84,491) |
Number of households with income $40k - 50k:| East San Gabriel Valley: | 4.7% (31,770) |
| California: | 4.0% (81,758) |
Number of households with income $50k - 60k:| East San Gabriel Valley: | 4.7% (31,573) |
| State: | 3.9% (80,971) |
Number of households with income $60k - 75k:| East San Gabriel Valley: | 7.8% (52,849) |
| State: | 6.0% (124,194) |
Number of households with income $75k - 100k:| East San Gabriel Valley: | 10.8% (72,751) |
| State: | 9.7% (200,337) |
Number of households with income $100k - 125k:| East San Gabriel Valley: | 9.9% (67,100) |
| State: | 9.4% (193,488) |
Number of households with income $125k - 150k:| East San Gabriel Valley: | 7.6% (51,277) |
| State: | 7.7% (158,253) |
Number of households with income $150k - 200k:| East San Gabriel Valley: | 11.2% (75,800) |
| State: | 12.2% (252,139) |
Number of households with income > $200k:| East San Gabriel Valley: | 19.6% (132,434) |
| State: | 28.4% (586,641) |
Aggregate household income in East San Gabriel Valley in 2022: $72,560,053,300
Median family income in East San Gabriel Valley in 2022:| East San Gabriel Valley: | $128,351 |
| State: | $136,040 |
Number of families with income < $10k:| East San Gabriel Valley: | 2.2% (1,302) |
| State: | 2.8% (42,046) |
Number of families with income $10k - 20k:| East San Gabriel Valley: | 2.7% (1,540) |
| California: | 3.1% (46,821) |
Number of families with income $20k - 30k:| East San Gabriel Valley: | 3.7% (2,168) |
| State: | 4.1% (61,519) |
Number of families with income $30k - 40k:| East San Gabriel Valley: | 4.2% (2,467) |
| California: | 3.7% (55,234) |
Number of families with income $40k - 50k:| East San Gabriel Valley: | 3.7% (2,119) |
| State: | 3.9% (58,471) |
Number of families with income $50k - 60k:| East San Gabriel Valley: | 4.5% (2,621) |
| State: | 3.9% (58,911) |
Number of families with income $60k - 75k:| East San Gabriel Valley: | 7.5% (4,375) |
| State: | 5.9% (88,675) |
Number of families with income $75k - 100k:| East San Gabriel Valley: | 11.7% (6,803) |
| State: | 9.5% (143,103) |
Number of families with income $100k - 125k:| East San Gabriel Valley: | 12.1% (7,048) |
| State: | 9.4% (142,085) |
Number of families with income $125k - 150k:| East San Gabriel Valley: | 9.1% (5,260) |
| California: | 8.0% (120,635) |
Number of families with income $150k - 200k:| East San Gabriel Valley: | 11.9% (6,935) |
| California: | 13.2% (198,099) |
Number of families with income > $200k:| East San Gabriel Valley: | 26.5% (15,408) |
| State: | 32.5% (489,303) |
Median non-family income in East San Gabriel Valley in 2022:| East San Gabriel Valley: | $69,765 |
| State: | $74,216 |
Change in median non-family income between 2000 and 2022:| East San Gabriel Valley, California: | +131.1% |
| State: | +136.3% |
Median per capita income in East San Gabriel Valley in 2022:| East San Gabriel Valley: | $51,048 |
| California: | $58,824 |
Change in median per capita income between 2000 and 2022:| East San Gabriel Valley, California: | +148.4% |
| California: | +166.8% |
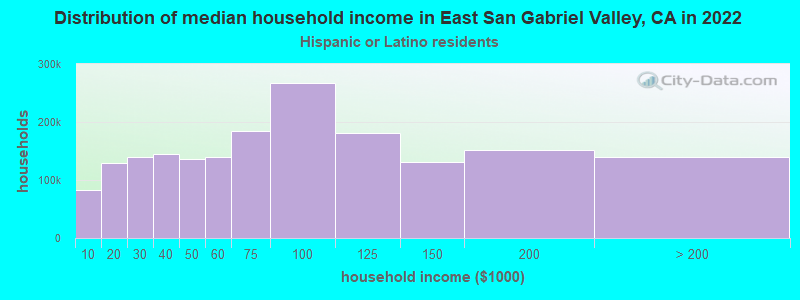
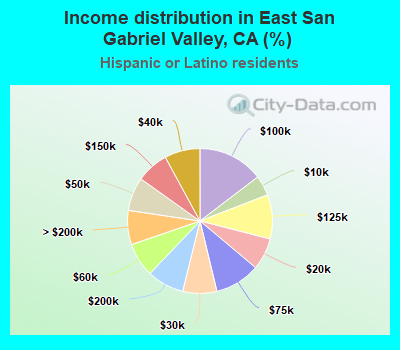
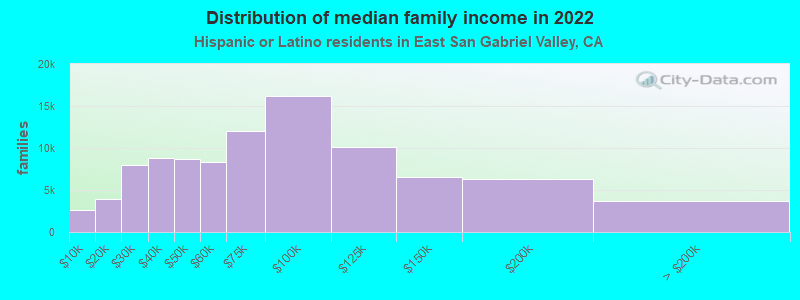
Income statistics for Hispanic or Latino residents
Median household income in East San Gabriel Valley, CA in 2022:| East San Gabriel Valley: | $97,393 |
| State: | $75,698 |
Change in median household income between 2000 and 2022:| East San Gabriel Valley, California: | +110.8% |
| State: | +107.2% |
Number of households with income < $10k:| East San Gabriel Valley: | 4.5% (82,179) |
| State: | 4.3% (183,294) |
Number of households with income $10k - 20k:| East San Gabriel Valley: | 7.1% (129,861) |
| State: | 6.0% (253,903) |
Number of households with income $20k - 30k:| East San Gabriel Valley: | 7.6% (138,987) |
| State: | 6.8% (286,386) |
Number of households with income $30k - 40k:| East San Gabriel Valley: | 7.9% (144,670) |
| State: | 7.4% (313,728) |
Number of households with income $40k - 50k:| East San Gabriel Valley: | 7.5% (137,067) |
| State: | 7.4% (313,199) |
Number of households with income $50k - 60k:| East San Gabriel Valley: | 7.6% (139,131) |
| California: | 7.2% (305,366) |
Number of households with income $60k - 75k:| East San Gabriel Valley: | 10.1% (185,015) |
| State: | 10.3% (434,937) |
Number of households with income $75k - 100k:| East San Gabriel Valley: | 14.6% (267,378) |
| State: | 14.4% (607,302) |
Number of households with income $100k - 125k:| East San Gabriel Valley: | 9.9% (180,629) |
| California: | 10.6% (447,424) |
Number of households with income $125k - 150k:| East San Gabriel Valley: | 7.2% (131,895) |
| State: | 7.5% (316,022) |
Number of households with income $150k - 200k:| East San Gabriel Valley: | 8.3% (150,979) |
| California: | 9.2% (386,269) |
Number of households with income > $200k:| East San Gabriel Valley: | 7.6% (139,585) |
| California: | 8.8% (372,651) |
Aggregate household income in East San Gabriel Valley in 2022: $122,294,646,800
Median family income in East San Gabriel Valley in 2022:| East San Gabriel Valley: | $99,187 |
| California: | $77,589 |
Number of families with income < $10k:| East San Gabriel Valley: | 2.8% (2,664) |
| California: | 3.9% (129,468) |
Number of families with income $10k - 20k:| East San Gabriel Valley: | 4.2% (3,971) |
| State: | 4.6% (151,997) |
Number of families with income $20k - 30k:| East San Gabriel Valley: | 8.3% (7,928) |
| State: | 6.6% (216,764) |
Number of families with income $30k - 40k:| East San Gabriel Valley: | 9.2% (8,793) |
| State: | 7.6% (249,849) |
Number of families with income $40k - 50k:| East San Gabriel Valley: | 9.1% (8,668) |
| State: | 7.7% (254,822) |
Number of families with income $50k - 60k:| East San Gabriel Valley: | 8.7% (8,280) |
| California: | 7.4% (244,815) |
Number of families with income $60k - 75k:| East San Gabriel Valley: | 12.6% (12,022) |
| California: | 10.5% (345,838) |
Number of families with income $75k - 100k:| East San Gabriel Valley: | 17.0% (16,194) |
| California: | 14.9% (491,589) |
Number of families with income $100k - 125k:| East San Gabriel Valley: | 10.6% (10,074) |
| State: | 10.7% (355,400) |
Number of families with income $125k - 150k:| East San Gabriel Valley: | 6.9% (6,526) |
| State: | 7.8% (259,317) |
Number of families with income $150k - 200k:| East San Gabriel Valley: | 6.6% (6,307) |
| State: | 9.3% (306,566) |
Number of families with income > $200k:| East San Gabriel Valley: | 3.9% (3,736) |
| State: | 9.1% (299,984) |
Median non-family income in East San Gabriel Valley in 2022:| East San Gabriel Valley: | $56,876 |
| California: | $49,746 |
Change in median non-family income between 2000 and 2022:| East San Gabriel Valley, California: | +107.5% |
| California: | +100.7% |
Median per capita income in East San Gabriel Valley in 2022:| East San Gabriel Valley: | $30,179 |
| State: | $27,240 |
Change in median per capita income between 2000 and 2022:| East San Gabriel Valley, California: | +138.1% |
| State: | +133.3% |
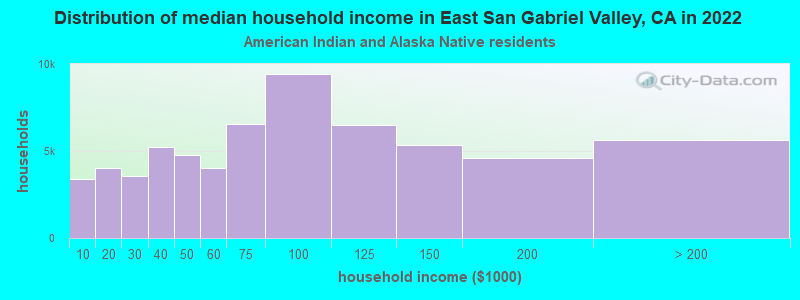
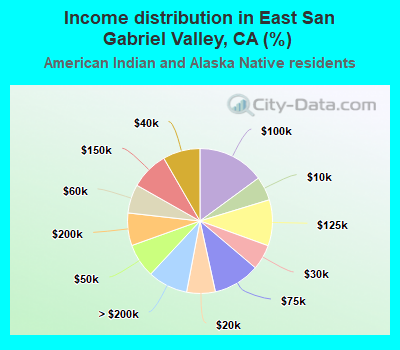
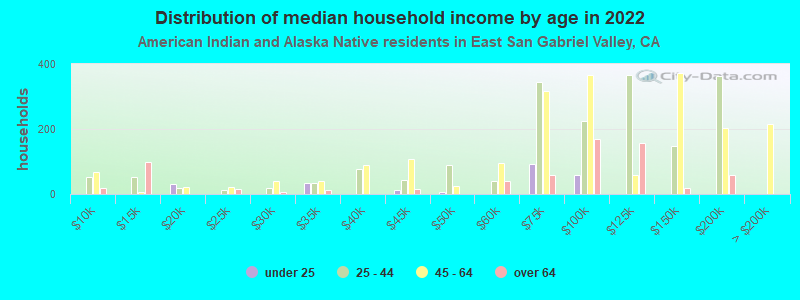
Income statistics for American Indian and Alaska Native residents
Median household income in East San Gabriel Valley, CA in 2022:| East San Gabriel Valley: | $109,062 |
| California: | $76,752 |
Change in median household income between 2000 and 2022:| East San Gabriel Valley, California: | +106.6% |
| State: | +110.0% |
Number of households with income < $10k:| East San Gabriel Valley: | 5.4% (3,385) |
| California: | 5.4% (8,471) |
Number of households with income $10k - 20k:| East San Gabriel Valley: | 6.4% (4,032) |
| California: | 6.0% (9,381) |
Number of households with income $20k - 30k:| East San Gabriel Valley: | 5.6% (3,554) |
| California: | 5.5% (8,668) |
Number of households with income $30k - 40k:| East San Gabriel Valley: | 8.3% (5,243) |
| California: | 8.3% (13,030) |
Number of households with income $40k - 50k:| East San Gabriel Valley: | 7.6% (4,786) |
| State: | 6.9% (10,908) |
Number of households with income $50k - 60k:| East San Gabriel Valley: | 6.4% (4,044) |
| State: | 7.1% (11,198) |
Number of households with income $60k - 75k:| East San Gabriel Valley: | 10.4% (6,564) |
| California: | 9.6% (15,190) |
Number of households with income $75k - 100k:| East San Gabriel Valley: | 14.9% (9,414) |
| State: | 14.1% (22,274) |
Number of households with income $100k - 125k:| East San Gabriel Valley: | 10.3% (6,472) |
| State: | 11.2% (17,643) |
Number of households with income $125k - 150k:| East San Gabriel Valley: | 8.5% (5,351) |
| California: | 8.3% (13,117) |
Number of households with income $150k - 200k:| East San Gabriel Valley: | 7.3% (4,595) |
| State: | 8.8% (13,853) |
Number of households with income > $200k:| East San Gabriel Valley: | 8.9% (5,638) |
| California: | 8.8% (13,925) |
Aggregate household income in East San Gabriel Valley in 2022: $449,916,654
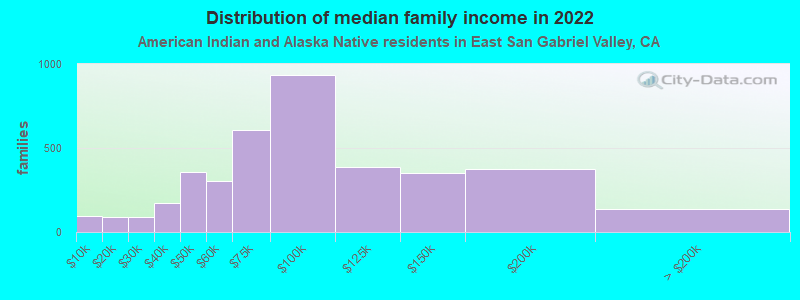
Median family income in East San Gabriel Valley in 2022:| East San Gabriel Valley: | $111,377 |
| State: | $81,108 |
Number of families with income < $10k:| East San Gabriel Valley: | 2.4% (94) |
| State: | 5.0% (5,711) |
Number of families with income $10k - 20k:| East San Gabriel Valley: | 2.3% (91) |
| State: | 3.7% (4,148) |
Number of families with income $20k - 30k:| East San Gabriel Valley: | 2.2% (87) |
| State: | 4.3% (4,876) |
Number of families with income $30k - 40k:| East San Gabriel Valley: | 4.4% (170) |
| California: | 8.8% (9,994) |
Number of families with income $40k - 50k:| East San Gabriel Valley: | 9.2% (358) |
| State: | 7.8% (8,776) |
Number of families with income $50k - 60k:| East San Gabriel Valley: | 7.7% (302) |
| State: | 6.9% (7,834) |
Number of families with income $60k - 75k:| East San Gabriel Valley: | 15.6% (607) |
| California: | 9.1% (10,247) |
Number of families with income $75k - 100k:| East San Gabriel Valley: | 24.0% (935) |
| State: | 14.8% (16,731) |
Number of families with income $100k - 125k:| East San Gabriel Valley: | 10.0% (389) |
| California: | 12.0% (13,609) |
Number of families with income $125k - 150k:| East San Gabriel Valley: | 9.0% (352) |
| California: | 8.0% (9,104) |
Number of families with income $150k - 200k:| East San Gabriel Valley: | 9.6% (375) |
| California: | 9.5% (10,721) |
Number of families with income > $200k:| East San Gabriel Valley: | 3.5% (138) |
| State: | 10.1% (11,409) |
Median non-family income in East San Gabriel Valley in 2022:| East San Gabriel Valley: | $65,993 |
| State: | $51,296 |
Change in median non-family income between 2000 and 2022:| East San Gabriel Valley, California: | +103.8% |
| California: | +114.0% |
Median per capita income in East San Gabriel Valley in 2022:| East San Gabriel Valley: | $30,485 |
| State: | $30,289 |
Change in median per capita income between 2000 and 2022:| East San Gabriel Valley, California: | +111.4% |
| State: | +98.9% |
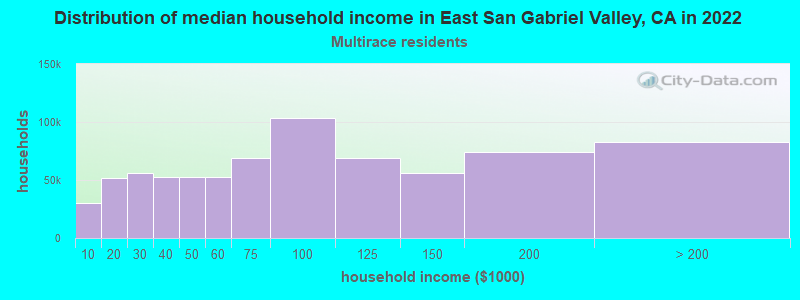
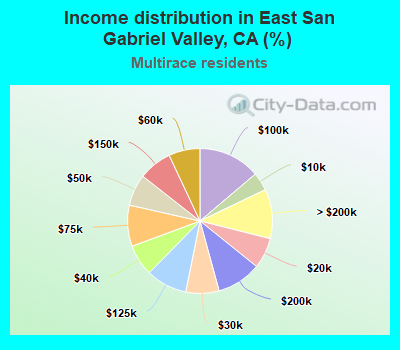
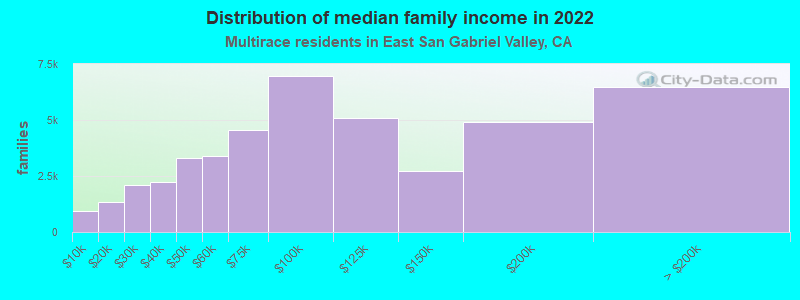
Income statistics for Multirace residents
Median household income in East San Gabriel Valley, CA in 2022:| East San Gabriel Valley: | $100,834 |
| California: | $83,153 |
Change in median household income between 2000 and 2022:| East San Gabriel Valley, California: | +112.7% |
| State: | +106.0% |
Number of households with income < $10k:| East San Gabriel Valley: | 4.1% (30,520) |
| California: | 4.2% (85,299) |
Number of households with income $10k - 20k:| East San Gabriel Valley: | 6.9% (51,513) |
| California: | 6.1% (122,966) |
Number of households with income $20k - 30k:| East San Gabriel Valley: | 7.4% (55,673) |
| California: | 6.4% (129,328) |
Number of households with income $30k - 40k:| East San Gabriel Valley: | 7.0% (52,473) |
| State: | 6.4% (130,070) |
Number of households with income $40k - 50k:| East San Gabriel Valley: | 7.0% (52,824) |
| State: | 6.5% (131,254) |
Number of households with income $50k - 60k:| East San Gabriel Valley: | 7.0% (52,233) |
| State: | 6.5% (132,382) |
Number of households with income $60k - 75k:| East San Gabriel Valley: | 9.2% (68,829) |
| State: | 9.4% (191,472) |
Number of households with income $75k - 100k:| East San Gabriel Valley: | 13.8% (103,556) |
| State: | 13.3% (269,691) |
Number of households with income $100k - 125k:| East San Gabriel Valley: | 9.2% (68,839) |
| California: | 10.2% (207,286) |
Number of households with income $125k - 150k:| East San Gabriel Valley: | 7.4% (55,726) |
| California: | 7.8% (158,259) |
Number of households with income $150k - 200k:| East San Gabriel Valley: | 9.9% (74,559) |
| State: | 10.3% (209,227) |
Number of households with income > $200k:| East San Gabriel Valley: | 11.0% (82,703) |
| State: | 13.0% (263,210) |
Aggregate household income in East San Gabriel Valley in 2022: $18,565,644,169
Median family income in East San Gabriel Valley in 2022:| East San Gabriel Valley: | $102,944 |
| California: | $87,642 |
Number of families with income < $10k:| East San Gabriel Valley: | 2.1% (941) |
| California: | 3.2% (48,017) |
Number of families with income $10k - 20k:| East San Gabriel Valley: | 3.0% (1,334) |
| State: | 4.1% (60,419) |
Number of families with income $20k - 30k:| East San Gabriel Valley: | 4.8% (2,100) |
| State: | 6.1% (89,742) |
Number of families with income $30k - 40k:| East San Gabriel Valley: | 5.0% (2,219) |
| State: | 6.2% (91,415) |
Number of families with income $40k - 50k:| East San Gabriel Valley: | 7.5% (3,321) |
| California: | 6.8% (100,085) |
Number of families with income $50k - 60k:| East San Gabriel Valley: | 7.7% (3,374) |
| State: | 6.7% (98,298) |
Number of families with income $60k - 75k:| East San Gabriel Valley: | 10.4% (4,574) |
| State: | 9.5% (140,131) |
Number of families with income $75k - 100k:| East San Gabriel Valley: | 15.8% (6,968) |
| State: | 13.8% (203,439) |
Number of families with income $100k - 125k:| East San Gabriel Valley: | 11.5% (5,085) |
| State: | 10.4% (153,515) |
Number of families with income $125k - 150k:| East San Gabriel Valley: | 6.2% (2,730) |
| California: | 8.4% (124,115) |
Number of families with income $150k - 200k:| East San Gabriel Valley: | 11.2% (4,929) |
| State: | 10.9% (161,643) |
Number of families with income > $200k:| East San Gabriel Valley: | 14.7% (6,457) |
| State: | 14.0% (207,317) |
Median non-family income in East San Gabriel Valley in 2022:| East San Gabriel Valley: | $50,517 |
| California: | $56,558 |
Change in median non-family income between 2000 and 2022:| East San Gabriel Valley, California: | +100.0% |
| State: | +100.2% |
Median per capita income in East San Gabriel Valley in 2022:| East San Gabriel Valley: | $31,420 |
| State: | $32,124 |
Change in median per capita income between 2000 and 2022:| East San Gabriel Valley, California: | +108.4% |
| State: | +120.4% |
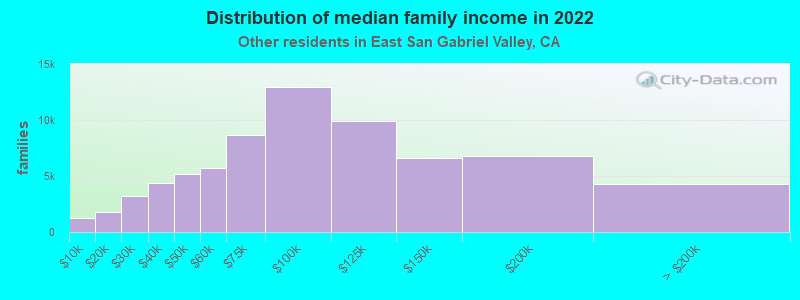
Income statistics for other residents
Number of households with income < $10k:| East San Gabriel Valley: | 5.1% (34,926) |
| State: | 4.6% (93,035) |
Number of households with income $10k - 20k:| East San Gabriel Valley: | 7.4% (51,281) |
| State: | 6.3% (126,222) |
Number of households with income $20k - 30k:| East San Gabriel Valley: | 7.8% (53,898) |
| State: | 7.1% (142,656) |
Number of households with income $30k - 40k:| East San Gabriel Valley: | 8.5% (58,853) |
| State: | 8.2% (165,018) |
Number of households with income $40k - 50k:| East San Gabriel Valley: | 7.9% (54,918) |
| State: | 8.0% (161,732) |
Number of households with income $50k - 60k:| East San Gabriel Valley: | 8.0% (55,358) |
| State: | 7.6% (152,152) |
Number of households with income $60k - 75k:| East San Gabriel Valley: | 10.4% (72,262) |
| State: | 10.4% (209,951) |
Number of households with income $75k - 100k:| East San Gabriel Valley: | 14.7% (101,538) |
| State: | 14.7% (296,102) |
Number of households with income $100k - 125k:| East San Gabriel Valley: | 10.0% (69,112) |
| State: | 10.7% (214,281) |
Number of households with income $125k - 150k:| East San Gabriel Valley: | 6.9% (47,474) |
| State: | 7.1% (143,092) |
Number of households with income $150k - 200k:| East San Gabriel Valley: | 7.5% (51,749) |
| State: | 8.6% (172,215) |
Number of households with income > $200k:| East San Gabriel Valley: | 5.8% (40,168) |
| California: | 6.7% (134,102) |
Aggregate household income in East San Gabriel Valley in 2022: $58,070,538,300
Median family income in East San Gabriel Valley in 2022:| East San Gabriel Valley: | $93,976 |
| State: | $72,756 |
Number of families with income < $10k:| East San Gabriel Valley: | 1.8% (1,290) |
| State: | 4.3% (69,090) |
Number of families with income $10k - 20k:| East San Gabriel Valley: | 2.6% (1,816) |
| California: | 5.1% (82,116) |
Number of families with income $20k - 30k:| East San Gabriel Valley: | 4.5% (3,211) |
| California: | 7.0% (112,854) |
Number of families with income $30k - 40k:| East San Gabriel Valley: | 6.2% (4,398) |
| State: | 8.4% (135,938) |
Number of families with income $40k - 50k:| East San Gabriel Valley: | 7.4% (5,207) |
| State: | 8.4% (135,353) |
Number of families with income $50k - 60k:| East San Gabriel Valley: | 8.0% (5,690) |
| State: | 7.7% (124,826) |
Number of families with income $60k - 75k:| East San Gabriel Valley: | 12.2% (8,628) |
| State: | 10.7% (173,628) |
Number of families with income $75k - 100k:| East San Gabriel Valley: | 18.3% (12,973) |
| State: | 15.2% (245,724) |
Number of families with income $100k - 125k:| East San Gabriel Valley: | 14.0% (9,921) |
| California: | 10.9% (176,716) |
Number of families with income $125k - 150k:| East San Gabriel Valley: | 9.3% (6,570) |
| State: | 7.4% (119,985) |
Number of families with income $150k - 200k:| East San Gabriel Valley: | 9.6% (6,785) |
| California: | 8.5% (137,332) |
Number of families with income > $200k:| East San Gabriel Valley: | 6.0% (4,253) |
| State: | 6.6% (106,346) |
Median non-family income in East San Gabriel Valley in 2022:| East San Gabriel Valley: | $56,889 |
| California: | $43,881 |
Change in median non-family income between 2000 and 2022:| East San Gabriel Valley, California: | +84.3% |
| State: | +84.6% |
Median per capita income in East San Gabriel Valley in 2022:| East San Gabriel Valley: | $28,345 |
| State: | $25,164 |
Change in median per capita income between 2000 and 2022:| East San Gabriel Valley, California: | +144.3% |
| State: | +137.9% |