East Grayson, Texas (TX) income map, earnings map, and wages data
The median household income in East Grayson, TX in 2022 was $64,343, which was 12.3% less than the median annual income of $72,284 across the entire state of Texas. Compared to the median income of $36,187 in 2000 this represents an increase of 43.8%. The per capita income in 2022 was $36,230, which means an increase of 48.9% compared to 2000 when it was $18,512.
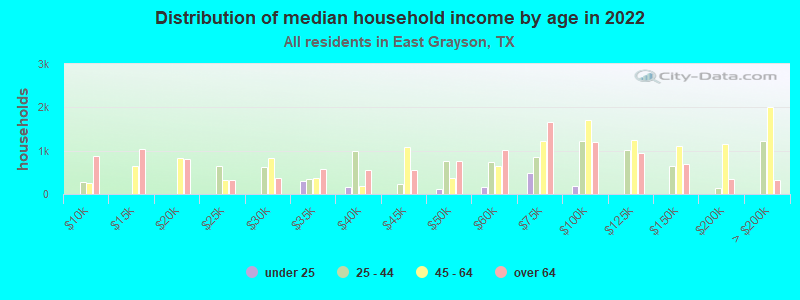
Income statistics for all residents
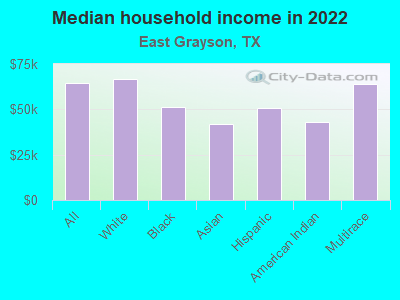
Median household income in East Grayson, TX in 2022:| East Grayson: | $64,344 |
| State: | $72,284 |
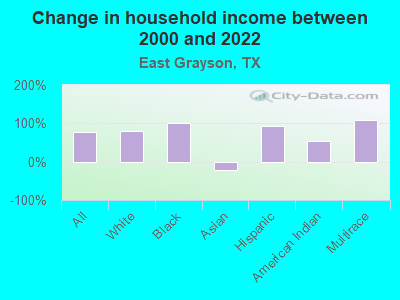
Change in median household income between 2000 and 2022:| East Grayson, Texas: | +77.8% |
| State: | +81.0% |
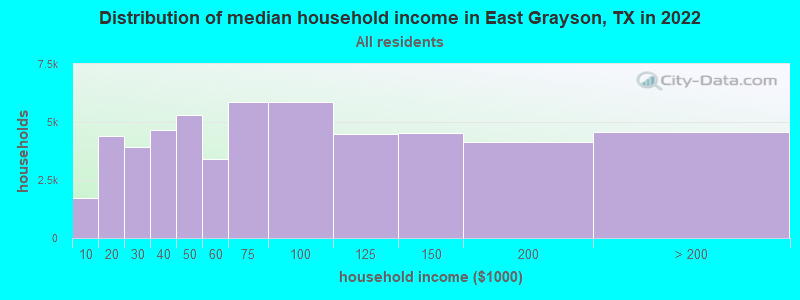
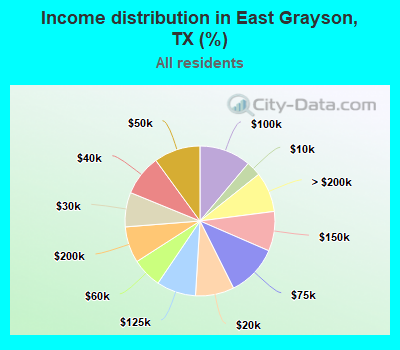
Number of households with income < $10k:| East Grayson: | 3.2% (1,706) |
| State: | 5.5% (611,011) |
Number of households with income $10k - 20k:| East Grayson: | 8.3% (4,413) |
| State: | 6.7% (743,157) |
Number of households with income $20k - 30k:| East Grayson: | 7.4% (3,927) |
| Texas: | 7.2% (803,381) |
Number of households with income $30k - 40k:| East Grayson: | 8.8% (4,656) |
| State: | 7.8% (866,080) |
Number of households with income $40k - 50k:| East Grayson: | 10.0% (5,294) |
| Texas: | 7.3% (810,440) |
Number of households with income $50k - 60k:| East Grayson: | 6.4% (3,406) |
| State: | 7.2% (799,783) |
Number of households with income $60k - 75k:| East Grayson: | 11.1% (5,879) |
| Texas: | 9.9% (1,095,384) |
Number of households with income $75k - 100k:| East Grayson: | 11.1% (5,867) |
| State: | 12.8% (1,419,057) |
Number of households with income $100k - 125k:| East Grayson: | 8.5% (4,490) |
| State: | 9.5% (1,054,577) |
Number of households with income $125k - 150k:| East Grayson: | 8.6% (4,521) |
| State: | 6.7% (741,518) |
Number of households with income $150k - 200k:| East Grayson: | 7.8% (4,140) |
| State: | 8.7% (961,776) |
Number of households with income > $200k:| East Grayson: | 8.6% (4,562) |
| State: | 10.7% (1,181,544) |
Aggregate household income in East Grayson in 2022: $3,703,031,624
Median family income in East Grayson in 2022:| East Grayson: | $84,506 |
| State: | $86,267 |
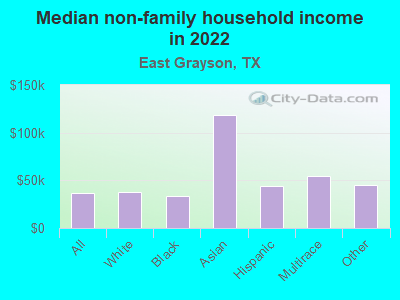
Median non-family income in East Grayson in 2022:| East Grayson: | $36,532 |
| State: | $45,999 |
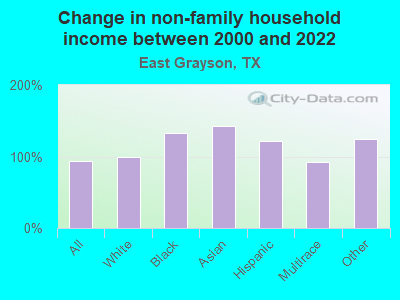
Change in median non-family income between 2000 and 2022:| East Grayson, Texas: | +93.8% |
| State: | +79.5% |
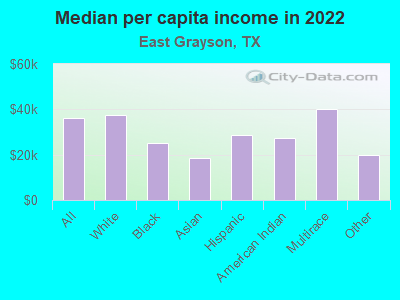
Median per capita income in East Grayson in 2022:| East Grayson: | $36,230 |
| State: | $38,123 |
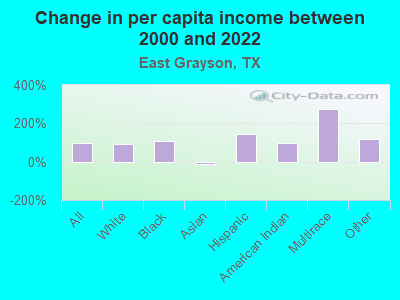
Change in median per capita income between 2000 and 2022:| East Grayson, Texas: | +95.7% |
| State: | +94.3% |
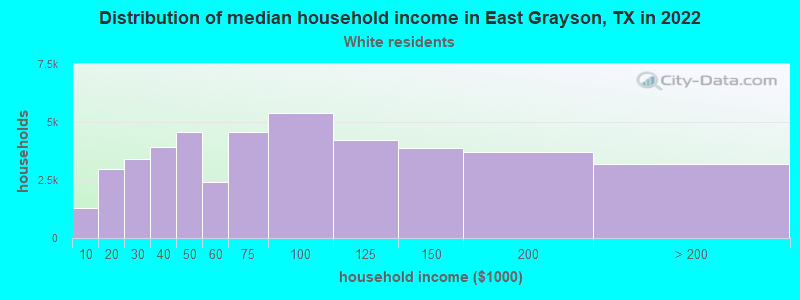
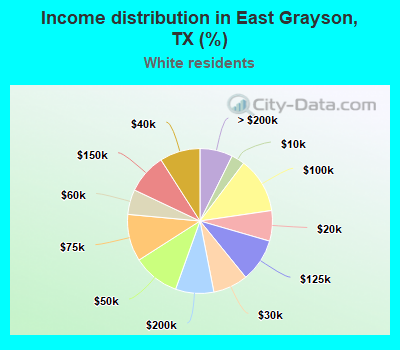
Income statistics for White residents
Median household income in East Grayson, TX in 2022:| East Grayson: | $66,649 |
| State: | $82,032 |
Change in median household income between 2000 and 2022:| East Grayson, Texas: | +79.8% |
| State: | +91.0% |
Number of households with income < $10k:| East Grayson: | 3.0% (1,296) |
| Texas: | 4.7% (273,716) |
Number of households with income $10k - 20k:| East Grayson: | 6.8% (2,965) |
| State: | 5.5% (322,702) |
Number of households with income $20k - 30k:| East Grayson: | 7.8% (3,392) |
| Texas: | 6.2% (363,947) |
Number of households with income $30k - 40k:| East Grayson: | 9.0% (3,935) |
| State: | 6.8% (399,275) |
Number of households with income $40k - 50k:| East Grayson: | 10.5% (4,563) |
| Texas: | 6.5% (383,417) |
Number of households with income $50k - 60k:| East Grayson: | 5.6% (2,426) |
| State: | 6.6% (388,535) |
Number of households with income $60k - 75k:| East Grayson: | 10.5% (4,586) |
| State: | 9.7% (566,295) |
Number of households with income $75k - 100k:| East Grayson: | 12.4% (5,399) |
| State: | 13.0% (760,276) |
Number of households with income $100k - 125k:| East Grayson: | 9.7% (4,214) |
| Texas: | 10.2% (597,596) |
Number of households with income $125k - 150k:| East Grayson: | 8.9% (3,895) |
| State: | 7.4% (436,830) |
Number of households with income $150k - 200k:| East Grayson: | 8.5% (3,721) |
| State: | 9.9% (583,067) |
Number of households with income > $200k:| East Grayson: | 7.3% (3,192) |
| State: | 13.5% (792,647) |
Aggregate household income in East Grayson in 2022: $2,944,533,524
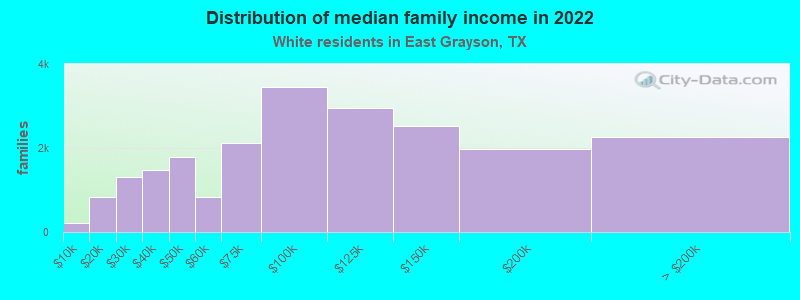
Median family income in East Grayson in 2022:| East Grayson: | $90,299 |
| Texas: | $101,788 |
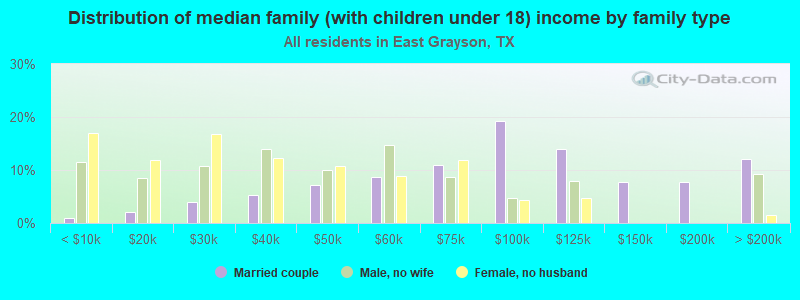
Number of families with income < $10k:| East Grayson: | 1.0% (220) |
| Texas: | 2.8% (108,142) |
Number of families with income $10k - 20k:| East Grayson: | 3.9% (840) |
| State: | 2.9% (113,421) |
Number of families with income $20k - 30k:| East Grayson: | 6.0% (1,303) |
| State: | 4.1% (157,688) |
Number of families with income $30k - 40k:| East Grayson: | 6.8% (1,480) |
| State: | 5.2% (198,847) |
Number of families with income $40k - 50k:| East Grayson: | 8.2% (1,776) |
| State: | 5.6% (216,490) |
Number of families with income $50k - 60k:| East Grayson: | 3.8% (822) |
| State: | 5.7% (220,689) |
Number of families with income $60k - 75k:| East Grayson: | 9.7% (2,118) |
| State: | 9.0% (346,106) |
Number of families with income $75k - 100k:| East Grayson: | 15.9% (3,451) |
| State: | 13.7% (527,363) |
Number of families with income $100k - 125k:| East Grayson: | 13.6% (2,957) |
| Texas: | 11.6% (448,411) |
Number of families with income $125k - 150k:| East Grayson: | 11.6% (2,530) |
| State: | 9.2% (355,798) |
Number of families with income $150k - 200k:| East Grayson: | 9.1% (1,977) |
| Texas: | 12.5% (480,185) |
Number of families with income > $200k:| East Grayson: | 10.4% (2,271) |
| State: | 17.6% (677,490) |
Median non-family income in East Grayson in 2022:| East Grayson: | $37,928 |
| State: | $50,587 |
Change in median non-family income between 2000 and 2022:| East Grayson, Texas: | +99.6% |
| State: | +87.7% |
Median per capita income in East Grayson in 2022:| East Grayson: | $37,635 |
| State: | $47,740 |
Change in median per capita income between 2000 and 2022:| East Grayson, Texas: | +91.1% |
| Texas: | +114.3% |
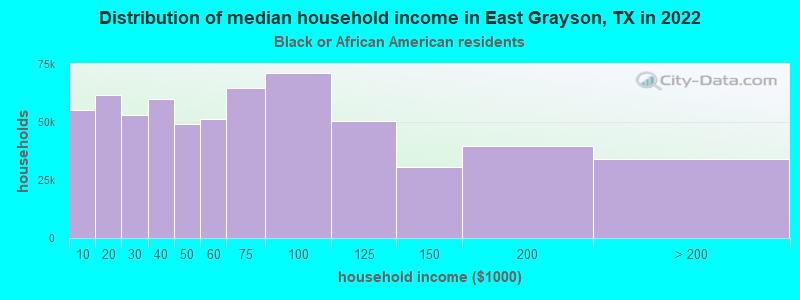
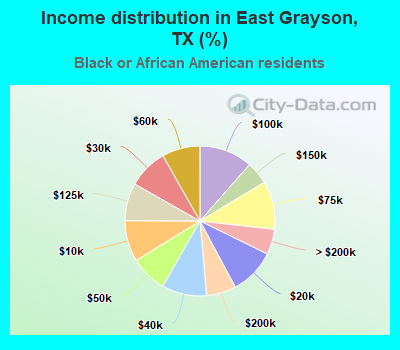
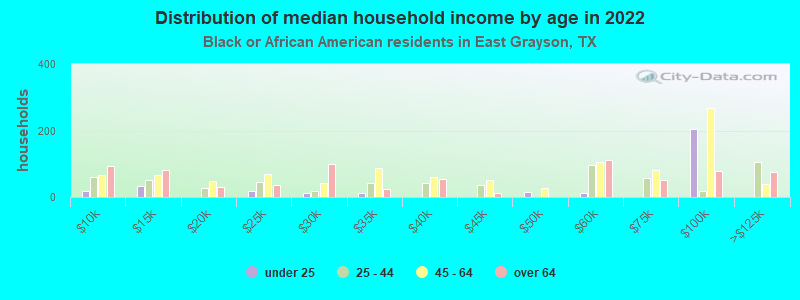
Income statistics for Black or African American residents
Median household income in East Grayson, TX in 2022:| East Grayson: | $51,357 |
| State: | $55,759 |
Change in median household income between 2000 and 2022:| East Grayson, Texas: | +99.9% |
| State: | +90.3% |
Number of households with income < $10k:| East Grayson: | 8.9% (55,187) |
| Texas: | 8.9% (126,378) |
Number of households with income $10k - 20k:| East Grayson: | 9.9% (61,699) |
| State: | 9.9% (140,369) |
Number of households with income $20k - 30k:| East Grayson: | 8.5% (53,082) |
| Texas: | 8.5% (120,639) |
Number of households with income $30k - 40k:| East Grayson: | 9.7% (60,016) |
| Texas: | 9.7% (137,517) |
Number of households with income $40k - 50k:| East Grayson: | 7.9% (49,303) |
| State: | 8.0% (112,973) |
Number of households with income $50k - 60k:| East Grayson: | 8.2% (51,088) |
| State: | 8.3% (117,156) |
Number of households with income $60k - 75k:| East Grayson: | 10.4% (64,491) |
| State: | 10.4% (147,462) |
Number of households with income $75k - 100k:| East Grayson: | 11.5% (71,208) |
| State: | 11.5% (162,718) |
Number of households with income $100k - 125k:| East Grayson: | 8.1% (50,559) |
| State: | 8.2% (115,829) |
Number of households with income $125k - 150k:| East Grayson: | 4.9% (30,638) |
| Texas: | 4.9% (69,556) |
Number of households with income $150k - 200k:| East Grayson: | 6.4% (39,681) |
| State: | 6.4% (90,701) |
Number of households with income > $200k:| East Grayson: | 5.5% (34,091) |
| State: | 5.5% (77,988) |
Aggregate household income in East Grayson in 2022: $199,123,268
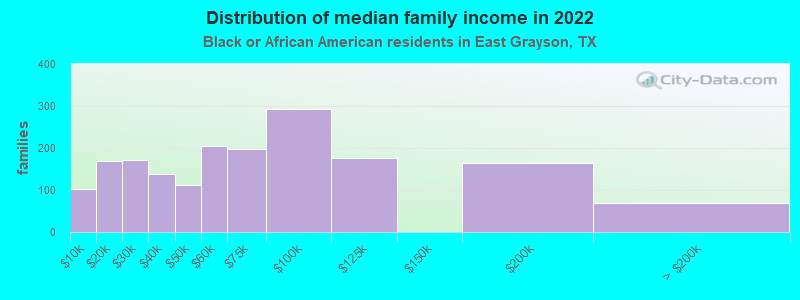
Median family income in East Grayson in 2022:| East Grayson: | $63,885 |
| Texas: | $69,134 |
Number of families with income < $10k:| East Grayson: | 5.7% (102) |
| State: | 6.8% (55,625) |
Number of families with income $10k - 20k:| East Grayson: | 9.3% (168) |
| Texas: | 6.8% (55,300) |
Number of families with income $20k - 30k:| East Grayson: | 9.5% (171) |
| Texas: | 7.1% (57,877) |
Number of families with income $30k - 40k:| East Grayson: | 7.7% (138) |
| Texas: | 8.5% (68,776) |
Number of families with income $40k - 50k:| East Grayson: | 6.3% (113) |
| State: | 7.1% (57,907) |
Number of families with income $50k - 60k:| East Grayson: | 11.4% (205) |
| State: | 7.3% (59,511) |
Number of families with income $60k - 75k:| East Grayson: | 11.0% (198) |
| Texas: | 10.1% (81,994) |
Number of families with income $75k - 100k:| East Grayson: | 16.3% (294) |
| State: | 12.7% (103,723) |
Number of families with income $100k - 125k:| East Grayson: | 9.8% (176) |
| State: | 9.4% (76,609) |
Number of families with income $150k - 200k:| East Grayson: | 9.2% (165) |
| Texas: | 9.4% (76,146) |
Number of families with income > $200k:| East Grayson: | 3.9% (69) |
| State: | 7.9% (64,439) |
Median non-family income in East Grayson in 2022:| East Grayson: | $33,387 |
| State: | $40,133 |
Change in median non-family income between 2000 and 2022:| East Grayson, Texas: | +133.0% |
| State: | +102.2% |
Median per capita income in East Grayson in 2022:| East Grayson: | $25,330 |
| State: | $30,490 |
Change in median per capita income between 2000 and 2022:| East Grayson, Texas: | +108.2% |
| State: | +113.9% |
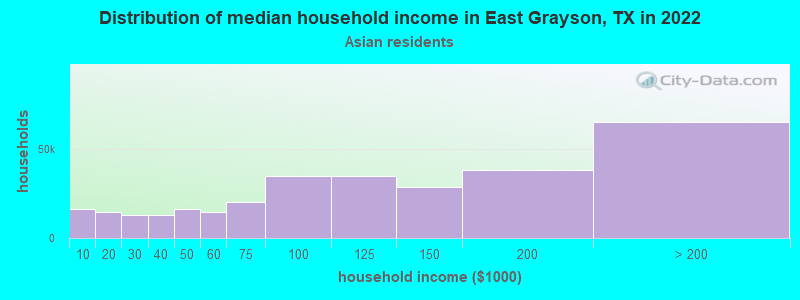
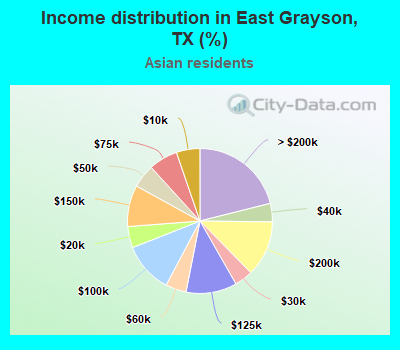
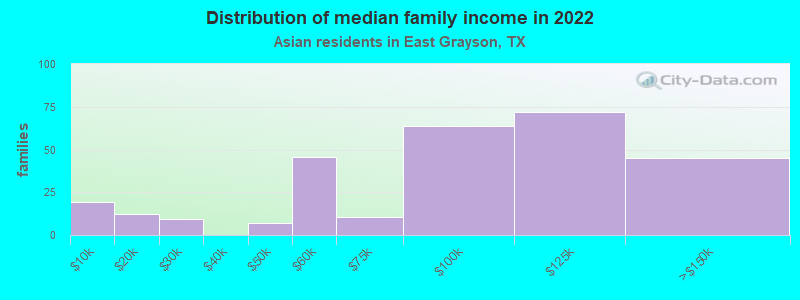
Income statistics for Asian residents
Median household income in East Grayson, TX in 2022:| East Grayson: | $42,018 |
| State: | $107,673 |
Number of households with income < $10k:| East Grayson: | 5.3% (16,126) |
| State: | 5.2% (29,885) |
Number of households with income $10k - 20k:| East Grayson: | 4.8% (14,592) |
| Texas: | 4.7% (27,044) |
Number of households with income $20k - 30k:| East Grayson: | 4.1% (12,575) |
| Texas: | 4.1% (23,363) |
Number of households with income $30k - 40k:| East Grayson: | 4.1% (12,572) |
| State: | 4.1% (23,309) |
Number of households with income $40k - 50k:| East Grayson: | 5.2% (16,072) |
| State: | 5.2% (29,826) |
Number of households with income $50k - 60k:| East Grayson: | 4.6% (14,256) |
| State: | 4.7% (26,512) |
Number of households with income $60k - 75k:| East Grayson: | 6.5% (19,911) |
| State: | 6.5% (36,905) |
Number of households with income $75k - 100k:| East Grayson: | 11.3% (34,623) |
| State: | 11.3% (64,350) |
Number of households with income $100k - 125k:| East Grayson: | 11.3% (34,844) |
| State: | 11.4% (64,714) |
Number of households with income $125k - 150k:| East Grayson: | 9.3% (28,406) |
| State: | 9.3% (52,719) |
Number of households with income $150k - 200k:| East Grayson: | 12.5% (38,237) |
| State: | 12.5% (70,953) |
Number of households with income > $200k:| East Grayson: | 21.1% (64,806) |
| State: | 21.1% (120,260) |
Aggregate household income in East Grayson in 2022: $30,640,907
Median family income in East Grayson in 2022:| East Grayson: | $39,798 |
| State: | $123,328 |
Number of families with income < $10k:| East Grayson: | 6.8% (19) |
| State: | 3.1% (13,567) |
Number of families with income $10k - 20k:| East Grayson: | 4.3% (12) |
| State: | 3.0% (13,043) |
Number of families with income $20k - 30k:| East Grayson: | 3.3% (9) |
| State: | 3.4% (14,738) |
Number of families with income $40k - 50k:| East Grayson: | 2.4% (7) |
| State: | 4.9% (21,622) |
Number of families with income $50k - 60k:| East Grayson: | 16.0% (45) |
| Texas: | 4.7% (20,568) |
Number of families with income $60k - 75k:| East Grayson: | 3.8% (11) |
| State: | 6.1% (26,637) |
Number of families with income $75k - 100k:| East Grayson: | 22.4% (64) |
| State: | 10.7% (46,626) |
Number of families with income $100k - 125k:| East Grayson: | 25.4% (72) |
| State: | 11.3% (49,585) |
Number of families with income $125k - 150k:| East Grayson: | 15.8% (45) |
| Texas: | 9.8% (43,043) |
Median non-family income in East Grayson in 2022:| East Grayson: | $118,345 |
| Texas: | $64,320 |
Change in median non-family income between 2000 and 2022:| East Grayson, Texas: | +142.8% |
| State: | +131.1% |
Median per capita income in East Grayson in 2022:| East Grayson: | $18,680 |
| Texas: | $48,626 |
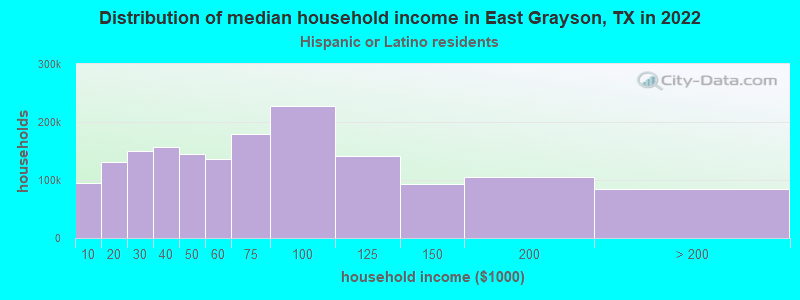
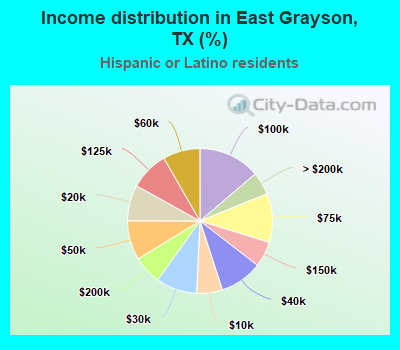
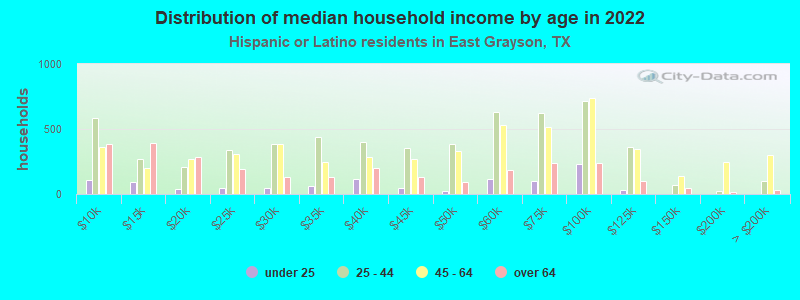
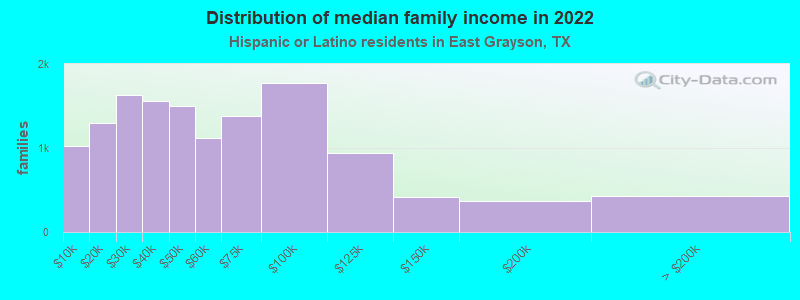
Income statistics for Hispanic or Latino residents
Median household income in East Grayson, TX in 2022:| East Grayson: | $50,977 |
| State: | $60,504 |
Change in median household income between 2000 and 2022:| East Grayson, Texas: | +92.8% |
| Texas: | +102.5% |
Number of households with income < $10k:| East Grayson: | 5.8% (94,798) |
| Texas: | 5.8% (213,953) |
Number of households with income $10k - 20k:| East Grayson: | 8.0% (131,842) |
| State: | 8.0% (297,456) |
Number of households with income $20k - 30k:| East Grayson: | 9.2% (150,638) |
| Texas: | 9.2% (340,166) |
Number of households with income $30k - 40k:| East Grayson: | 9.5% (157,056) |
| Texas: | 9.5% (354,336) |
Number of households with income $40k - 50k:| East Grayson: | 8.8% (144,847) |
| State: | 8.8% (327,013) |
Number of households with income $50k - 60k:| East Grayson: | 8.3% (136,707) |
| Texas: | 8.3% (308,818) |
Number of households with income $60k - 75k:| East Grayson: | 10.9% (179,491) |
| State: | 10.9% (405,109) |
Number of households with income $75k - 100k:| East Grayson: | 13.8% (226,792) |
| Texas: | 13.8% (511,639) |
Number of households with income $100k - 125k:| East Grayson: | 8.6% (141,734) |
| Texas: | 8.6% (319,728) |
Number of households with income $125k - 150k:| East Grayson: | 5.7% (93,586) |
| Texas: | 5.7% (210,932) |
Number of households with income $150k - 200k:| East Grayson: | 6.4% (104,518) |
| State: | 6.4% (236,055) |
Number of households with income > $200k:| East Grayson: | 5.1% (83,914) |
| State: | 5.1% (189,259) |
Aggregate household income in East Grayson in 2022: $559,705,782
Median family income in East Grayson in 2022:| East Grayson: | $51,003 |
| Texas: | $65,080 |
Number of families with income < $10k:| East Grayson: | 7.6% (1,020) |
| Texas: | 5.3% (147,493) |
Number of families with income $10k - 20k:| East Grayson: | 9.7% (1,298) |
| Texas: | 6.3% (174,531) |
Number of families with income $20k - 30k:| East Grayson: | 12.1% (1,626) |
| State: | 8.6% (238,528) |
Number of families with income $30k - 40k:| East Grayson: | 11.6% (1,564) |
| Texas: | 9.1% (251,999) |
Number of families with income $40k - 50k:| East Grayson: | 11.1% (1,497) |
| State: | 8.6% (240,188) |
Number of families with income $50k - 60k:| East Grayson: | 8.3% (1,122) |
| Texas: | 8.0% (223,566) |
Number of families with income $60k - 75k:| East Grayson: | 10.3% (1,381) |
| State: | 10.9% (302,688) |
Number of families with income $75k - 100k:| East Grayson: | 13.2% (1,771) |
| State: | 14.3% (398,554) |
Number of families with income $100k - 125k:| East Grayson: | 7.0% (943) |
| State: | 9.5% (264,007) |
Number of families with income $125k - 150k:| East Grayson: | 3.1% (414) |
| State: | 6.2% (171,274) |
Number of families with income $150k - 200k:| East Grayson: | 2.7% (369) |
| State: | 7.3% (202,259) |
Number of families with income > $200k:| East Grayson: | 3.2% (434) |
| Texas: | 5.9% (165,129) |
Median non-family income in East Grayson in 2022:| East Grayson: | $44,558 |
| State: | $39,934 |
Change in median non-family income between 2000 and 2022:| East Grayson, Texas: | +120.8% |
| State: | +109.1% |
Median per capita income in East Grayson in 2022:| East Grayson: | $28,581 |
| Texas: | $24,862 |
Change in median per capita income between 2000 and 2022:| East Grayson, Texas: | +146.2% |
| Texas: | +130.8% |
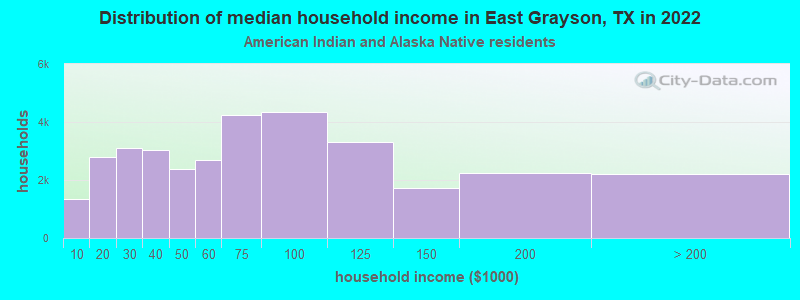
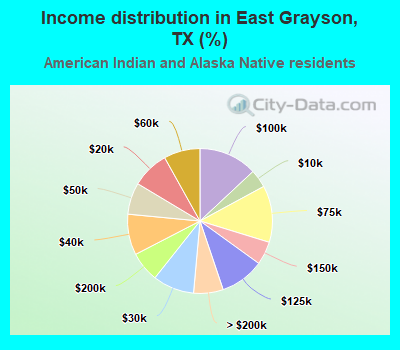
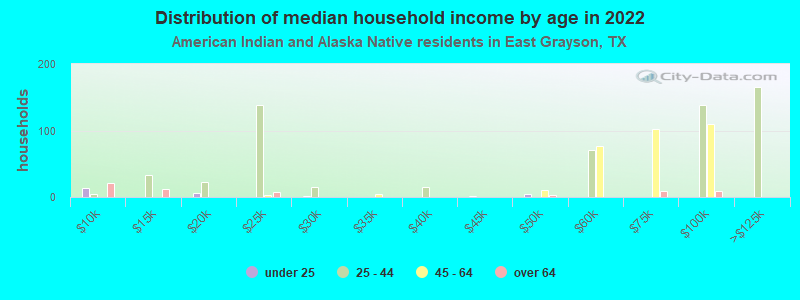
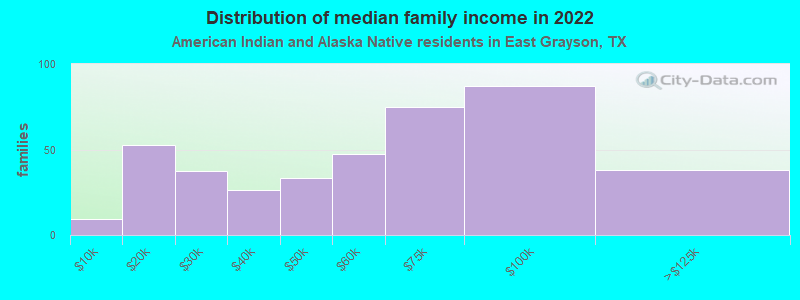
Income statistics for American Indian and Alaska Native residents
Median household income in East Grayson, TX in 2022:| East Grayson: | $43,241 |
| State: | $65,765 |
Change in median household income between 2000 and 2022:| East Grayson, Texas: | +55.1% |
| Texas: | +88.3% |
Number of households with income < $10k:| East Grayson: | 4.1% (1,359) |
| State: | 4.1% (3,398) |
Number of households with income $10k - 20k:| East Grayson: | 8.3% (2,779) |
| Texas: | 8.3% (6,949) |
Number of households with income $20k - 30k:| East Grayson: | 9.3% (3,096) |
| State: | 9.3% (7,742) |
Number of households with income $30k - 40k:| East Grayson: | 9.1% (3,046) |
| State: | 9.1% (7,627) |
Number of households with income $40k - 50k:| East Grayson: | 7.1% (2,371) |
| State: | 7.1% (5,922) |
Number of households with income $50k - 60k:| East Grayson: | 8.1% (2,704) |
| Texas: | 8.1% (6,761) |
Number of households with income $60k - 75k:| East Grayson: | 12.7% (4,232) |
| State: | 12.7% (10,588) |
Number of households with income $75k - 100k:| East Grayson: | 13.0% (4,361) |
| Texas: | 13.0% (10,903) |
Number of households with income $100k - 125k:| East Grayson: | 9.9% (3,302) |
| State: | 9.9% (8,256) |
Number of households with income $125k - 150k:| East Grayson: | 5.2% (1,740) |
| Texas: | 5.2% (4,355) |
Number of households with income $150k - 200k:| East Grayson: | 6.7% (2,246) |
| State: | 6.7% (5,623) |
Number of households with income > $200k:| East Grayson: | 6.6% (2,205) |
| Texas: | 6.6% (5,522) |
Aggregate household income in East Grayson in 2022: $10,343,295
Median family income in East Grayson in 2022:| East Grayson: | $78,349 |
| State: | $72,369 |
Number of families with income < $10k:| East Grayson: | 2.3% (9) |
| Texas: | 2.7% (1,671) |
Number of families with income $10k - 20k:| East Grayson: | 13.0% (53) |
| Texas: | 8.0% (4,891) |
Number of families with income $20k - 30k:| East Grayson: | 9.2% (37) |
| Texas: | 7.3% (4,502) |
Number of families with income $30k - 40k:| East Grayson: | 6.5% (26) |
| Texas: | 7.5% (4,592) |
Number of families with income $40k - 50k:| East Grayson: | 8.2% (34) |
| Texas: | 7.9% (4,855) |
Number of families with income $50k - 60k:| East Grayson: | 11.7% (48) |
| State: | 7.1% (4,347) |
Number of families with income $60k - 75k:| East Grayson: | 18.3% (75) |
| Texas: | 12.1% (7,429) |
Number of families with income $75k - 100k:| East Grayson: | 21.5% (87) |
| Texas: | 14.4% (8,852) |
Number of families with income $100k - 125k:| East Grayson: | 9.4% (38) |
| Texas: | 11.4% (6,997) |
Median per capita income in East Grayson in 2022:| East Grayson: | $27,285 |
| Texas: | $28,166 |
Change in median per capita income between 2000 and 2022:| East Grayson, Texas: | +95.5% |
| State: | +77.2% |
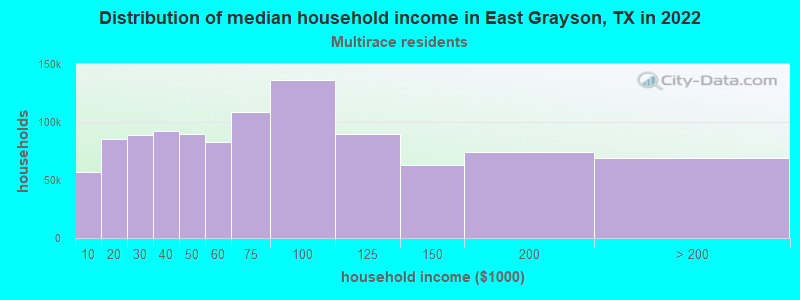
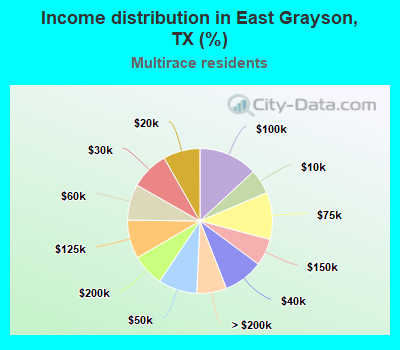
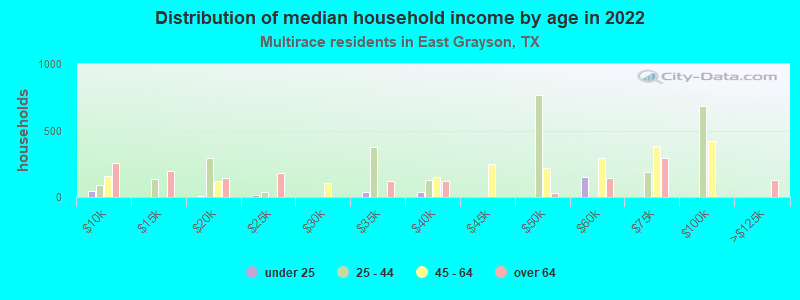
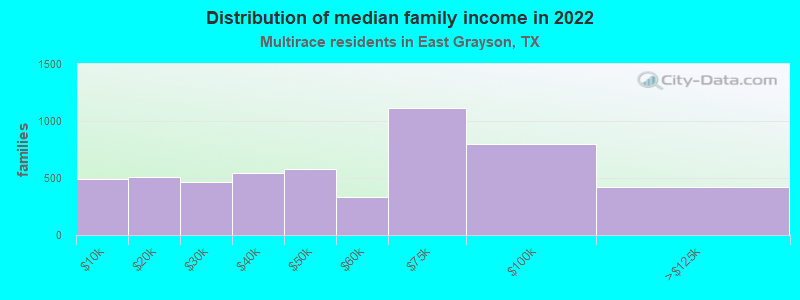
Income statistics for Multirace residents
Median household income in East Grayson, TX in 2022:| East Grayson: | $63,782 |
| State: | $62,748 |
Change in median household income between 2000 and 2022:| East Grayson, Texas: | +108.5% |
| State: | +92.3% |
Number of households with income < $10k:| East Grayson: | 5.5% (57,290) |
| Texas: | 5.5% (122,324) |
Number of households with income $10k - 20k:| East Grayson: | 8.2% (85,350) |
| Texas: | 8.2% (182,232) |
Number of households with income $20k - 30k:| East Grayson: | 8.5% (88,641) |
| Texas: | 8.5% (189,456) |
Number of households with income $30k - 40k:| East Grayson: | 8.9% (92,474) |
| State: | 8.9% (197,499) |
Number of households with income $40k - 50k:| East Grayson: | 8.7% (89,823) |
| Texas: | 8.7% (191,735) |
Number of households with income $50k - 60k:| East Grayson: | 8.0% (83,079) |
| State: | 8.0% (177,535) |
Number of households with income $60k - 75k:| East Grayson: | 10.5% (108,892) |
| Texas: | 10.5% (232,479) |
Number of households with income $75k - 100k:| East Grayson: | 13.1% (136,000) |
| State: | 13.1% (290,448) |
Number of households with income $100k - 125k:| East Grayson: | 8.6% (89,752) |
| State: | 8.6% (191,595) |
Number of households with income $125k - 150k:| East Grayson: | 6.0% (62,515) |
| State: | 6.0% (133,361) |
Number of households with income $150k - 200k:| East Grayson: | 7.2% (74,459) |
| State: | 7.2% (159,195) |
Number of households with income > $200k:| East Grayson: | 6.7% (69,326) |
| State: | 6.7% (148,064) |
Aggregate household income in East Grayson in 2022: $472,582,488
Median family income in East Grayson in 2022:| East Grayson: | $77,099 |
| State: | $69,780 |
Number of families with income < $10k:| East Grayson: | 9.3% (489) |
| Texas: | 4.4% (70,825) |
Number of families with income $10k - 20k:| East Grayson: | 9.7% (511) |
| Texas: | 5.9% (95,279) |
Number of families with income $20k - 30k:| East Grayson: | 8.8% (462) |
| Texas: | 7.8% (126,627) |
Number of families with income $30k - 40k:| East Grayson: | 10.4% (546) |
| Texas: | 8.5% (137,626) |
Number of families with income $40k - 50k:| East Grayson: | 11.0% (576) |
| State: | 8.4% (135,809) |
Number of families with income $50k - 60k:| East Grayson: | 6.4% (335) |
| State: | 7.9% (127,739) |
Number of families with income $60k - 75k:| East Grayson: | 21.2% (1,111) |
| State: | 10.5% (169,549) |
Number of families with income $75k - 100k:| East Grayson: | 15.2% (798) |
| Texas: | 14.0% (226,284) |
Number of families with income $100k - 125k:| East Grayson: | 8.0% (421) |
| Texas: | 9.5% (153,597) |
Median non-family income in East Grayson in 2022:| East Grayson: | $54,679 |
| Texas: | $40,634 |
Change in median non-family income between 2000 and 2022:| East Grayson, Texas: | +93.2% |
| State: | +77.2% |
Median per capita income in East Grayson in 2022:| East Grayson: | $40,215 |
| State: | $26,785 |
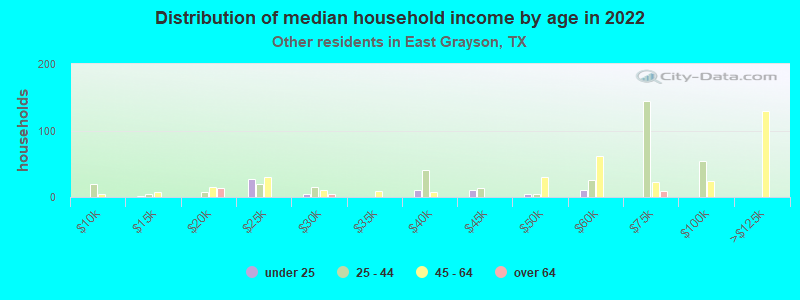
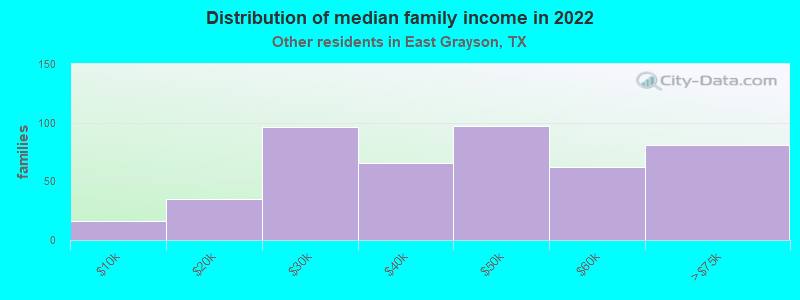
Income statistics for other residents
Number of households with income < $10k:| East Grayson: | 5.9% (262) |
| Texas: | 5.9% (54,162) |
Number of households with income $10k - 20k:| East Grayson: | 6.8% (304) |
| State: | 6.8% (62,891) |
Number of households with income $20k - 30k:| East Grayson: | 10.6% (471) |
| Texas: | 10.6% (97,294) |
Number of households with income $30k - 40k:| East Grayson: | 10.9% (482) |
| State: | 10.8% (99,670) |
Number of households with income $40k - 50k:| East Grayson: | 9.3% (414) |
| Texas: | 9.3% (85,548) |
Number of households with income $50k - 60k:| East Grayson: | 9.0% (400) |
| State: | 9.0% (82,757) |
Number of households with income $60k - 75k:| East Grayson: | 10.9% (485) |
| State: | 10.9% (100,326) |
Number of households with income $75k - 100k:| East Grayson: | 14.0% (622) |
| Texas: | 14.0% (128,767) |
Number of households with income $100k - 125k:| East Grayson: | 8.2% (363) |
| State: | 8.2% (75,218) |
Number of households with income $125k - 150k:| East Grayson: | 4.8% (214) |
| Texas: | 4.8% (44,223) |
Number of households with income $150k - 200k:| East Grayson: | 5.6% (248) |
| Texas: | 5.6% (51,376) |
Number of households with income > $200k:| East Grayson: | 4.0% (176) |
| State: | 4.0% (36,393) |
Aggregate household income in East Grayson in 2022: $107,381,504
Median family income in East Grayson in 2022:| East Grayson: | $63,183 |
| Texas: | $60,064 |
Number of families with income < $10k:| East Grayson: | 3.6% (16) |
| Texas: | 6.8% (47,502) |
Number of families with income $10k - 20k:| East Grayson: | 7.8% (35) |
| State: | 6.0% (41,763) |
Number of families with income $20k - 30k:| East Grayson: | 21.2% (96) |
| State: | 9.9% (68,761) |
Number of families with income $30k - 40k:| East Grayson: | 14.5% (66) |
| State: | 9.7% (67,685) |
Number of families with income $40k - 50k:| East Grayson: | 21.3% (97) |
| State: | 9.0% (62,441) |
Number of families with income $50k - 60k:| East Grayson: | 13.8% (63) |
| State: | 8.5% (59,321) |
Number of families with income $60k - 75k:| East Grayson: | 17.8% (81) |
| State: | 11.2% (77,588) |
Median non-family income in East Grayson in 2022:| East Grayson: | $45,453 |
| State: | $38,690 |
Change in median non-family income between 2000 and 2022:| East Grayson, Texas: | +123.9% |
| State: | +90.2% |
Median per capita income in East Grayson in 2022:| East Grayson: | $19,838 |
| State: | $23,899 |
Change in median per capita income between 2000 and 2022:| East Grayson, Texas: | +119.7% |
| State: | +135.2% |