East Compton, California (CA) income map, earnings map, and wages data
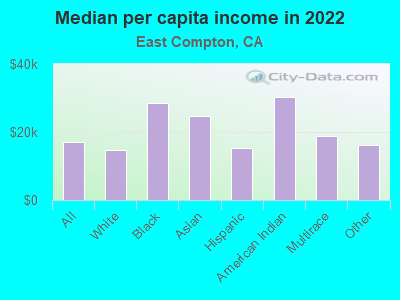
The median household income in East Compton, CA in 2022 was $61,410, which was 49.1% less than the median annual income of $91,551 across the entire state of California. Compared to the median income of $31,398 in 2000 this represents an increase of 48.9%. The per capita income in 2022 was $16,923, which means an increase of 52.1% compared to 2000 when it was $8,108.
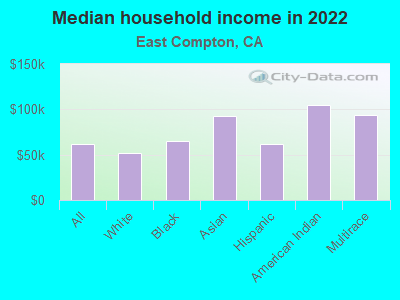
Income statistics for all residents
Median household income in East Compton, CA in 2022:| East Compton: | $61,410 |
| State: | $91,551 |
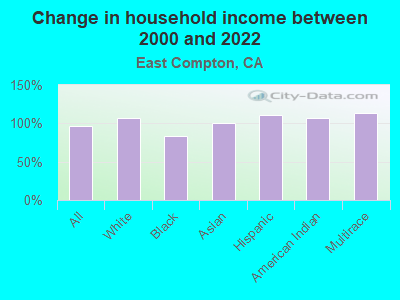
Change in median household income between 2000 and 2022:| East Compton, California: | +95.6% |
| State: | +92.8% |
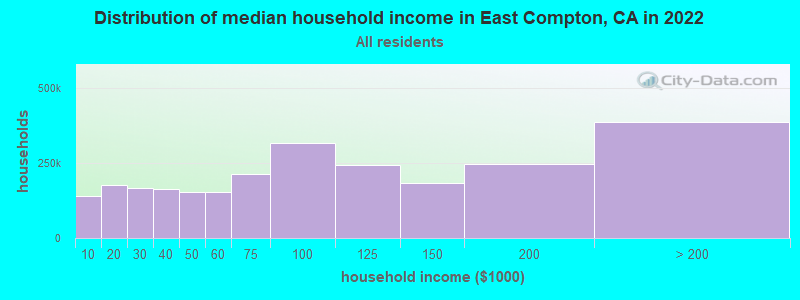
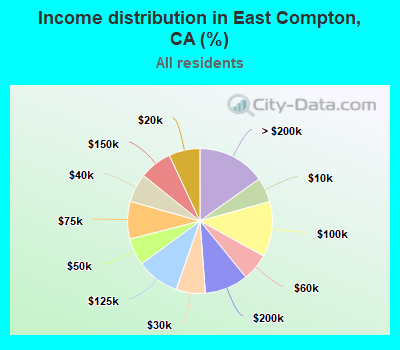
Number of households with income < $10k:| East Compton: | 5.5% (139,940) |
| State: | 4.8% (654,370) |
Number of households with income $10k - 20k:| East Compton: | 6.9% (176,410) |
| State: | 5.8% (789,493) |
Number of households with income $20k - 30k:| East Compton: | 6.5% (165,513) |
| California: | 5.7% (778,318) |
Number of households with income $30k - 40k:| East Compton: | 6.4% (163,334) |
| State: | 5.8% (783,170) |
Number of households with income $40k - 50k:| East Compton: | 6.1% (154,430) |
| State: | 5.8% (781,352) |
Number of households with income $50k - 60k:| East Compton: | 6.1% (154,553) |
| State: | 5.6% (760,175) |
Number of households with income $60k - 75k:| East Compton: | 8.4% (212,895) |
| State: | 8.2% (1,104,699) |
Number of households with income $75k - 100k:| East Compton: | 12.4% (314,239) |
| State: | 12.0% (1,627,633) |
Number of households with income $100k - 125k:| East Compton: | 9.6% (244,131) |
| California: | 10.0% (1,358,619) |
Number of households with income $125k - 150k:| East Compton: | 7.2% (184,170) |
| California: | 7.6% (1,027,455) |
Number of households with income $150k - 200k:| East Compton: | 9.7% (246,713) |
| State: | 10.6% (1,439,811) |
Number of households with income > $200k:| East Compton: | 15.2% (385,732) |
| California: | 18.0% (2,445,491) |
Aggregate household income in East Compton in 2022: $13,735,788,079
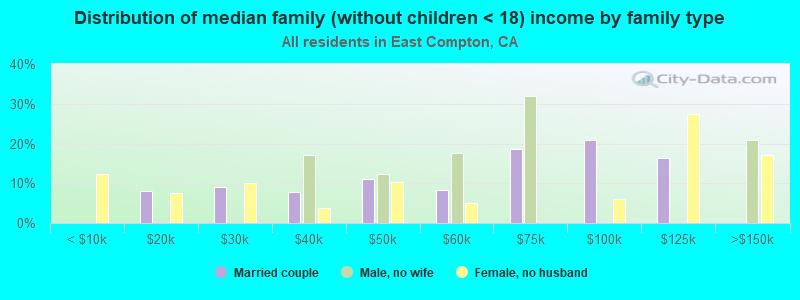
Median family income in East Compton in 2022:| East Compton: | $60,062 |
| State: | $104,823 |
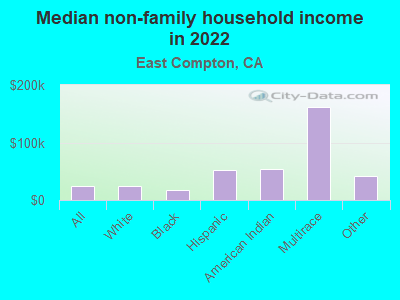
Median non-family income in East Compton in 2022:| East Compton: | $24,117 |
| State: | $59,348 |
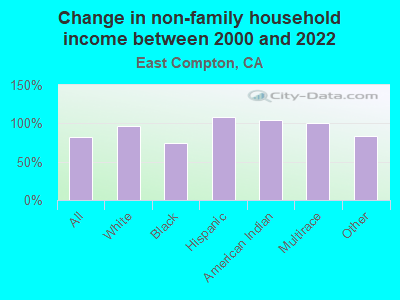
Change in median non-family income between 2000 and 2022:| East Compton, California: | +81.8% |
| California: | +85.3% |
Median per capita income in East Compton in 2022:| East Compton: | $16,924 |
| State: | $46,661 |
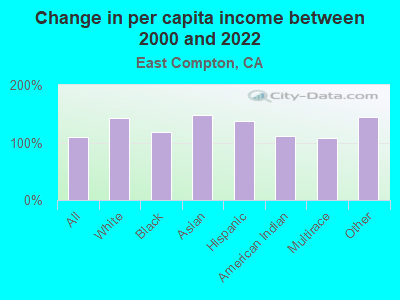
Change in median per capita income between 2000 and 2022:| East Compton, California: | +108.7% |
| State: | +105.5% |
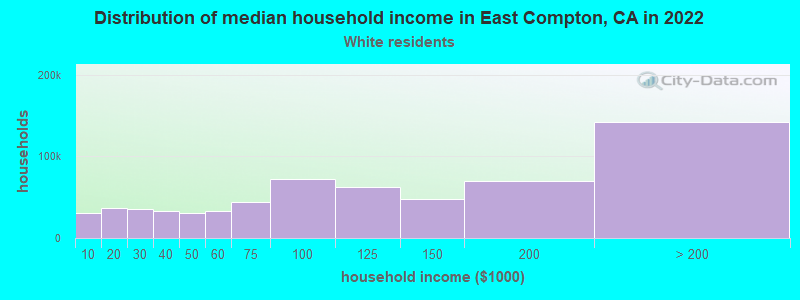
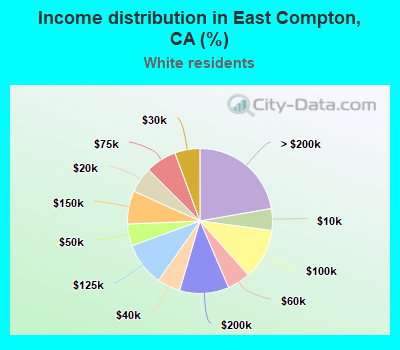
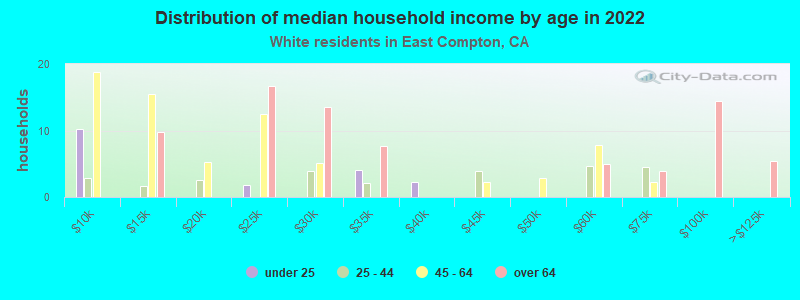
Income statistics for White residents
Median household income in East Compton, CA in 2022:| East Compton: | $51,434 |
| State: | $100,917 |
Change in median household income between 2000 and 2022:| East Compton, California: | +107.4% |
| State: | +96.8% |
Number of households with income < $10k:| East Compton: | 4.9% (31,059) |
| State: | 4.4% (284,109) |
Number of households with income $10k - 20k:| East Compton: | 5.7% (36,507) |
| State: | 5.3% (340,330) |
Number of households with income $20k - 30k:| East Compton: | 5.6% (35,831) |
| State: | 5.3% (343,145) |
Number of households with income $30k - 40k:| East Compton: | 5.2% (32,957) |
| State: | 5.1% (330,146) |
Number of households with income $40k - 50k:| East Compton: | 4.9% (31,177) |
| State: | 5.2% (335,310) |
Number of households with income $50k - 60k:| East Compton: | 5.1% (32,848) |
| State: | 5.1% (326,299) |
Number of households with income $60k - 75k:| East Compton: | 6.9% (44,260) |
| State: | 7.6% (487,640) |
Number of households with income $75k - 100k:| East Compton: | 11.3% (72,141) |
| California: | 11.5% (736,578) |
Number of households with income $100k - 125k:| East Compton: | 9.8% (62,346) |
| State: | 10.1% (648,782) |
Number of households with income $125k - 150k:| East Compton: | 7.4% (47,393) |
| State: | 7.8% (499,671) |
Number of households with income $150k - 200k:| East Compton: | 11.0% (70,316) |
| State: | 11.4% (729,603) |
Number of households with income > $200k:| East Compton: | 22.3% (142,316) |
| State: | 21.2% (1,364,246) |
Aggregate household income in East Compton in 2022: $1,134,436,329
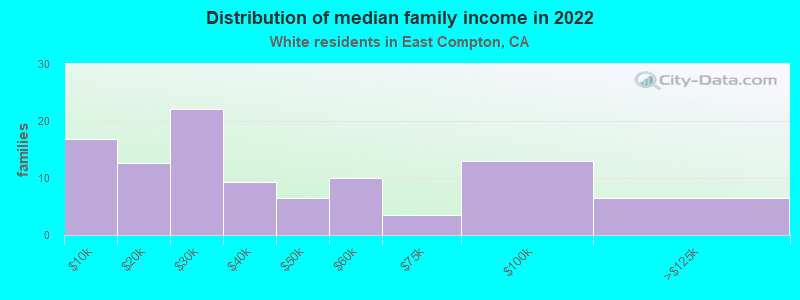
Median family income in East Compton in 2022:| East Compton: | $55,176 |
| State: | $125,379 |
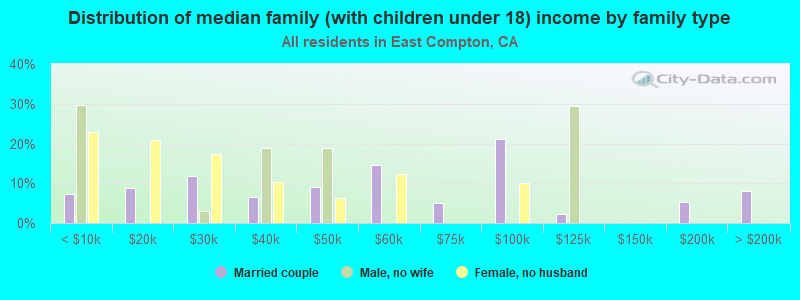
Number of families with income < $10k:| East Compton: | 16.7% (17) |
| California: | 2.2% (87,079) |
Number of families with income $10k - 20k:| East Compton: | 12.6% (13) |
| California: | 2.5% (97,716) |
Number of families with income $20k - 30k:| East Compton: | 22.0% (22) |
| California: | 3.5% (137,295) |
Number of families with income $30k - 40k:| East Compton: | 9.3% (9) |
| California: | 3.9% (152,947) |
Number of families with income $40k - 50k:| East Compton: | 6.5% (7) |
| State: | 4.3% (169,197) |
Number of families with income $50k - 60k:| East Compton: | 10.0% (10) |
| California: | 4.5% (176,192) |
Number of families with income $60k - 75k:| East Compton: | 3.6% (4) |
| State: | 7.0% (274,752) |
Number of families with income $75k - 100k:| East Compton: | 12.9% (13) |
| California: | 11.3% (445,632) |
Number of families with income $100k - 125k:| East Compton: | 6.5% (6) |
| California: | 10.7% (423,630) |
Median non-family income in East Compton in 2022:| East Compton: | $23,912 |
| State: | $62,819 |
Change in median non-family income between 2000 and 2022:| East Compton, California: | +96.2% |
| State: | +84.4% |
Median per capita income in East Compton in 2022:| East Compton: | $14,613 |
| State: | $61,706 |
Change in median per capita income between 2000 and 2022:| East Compton, California: | +142.5% |
| State: | +122.7% |
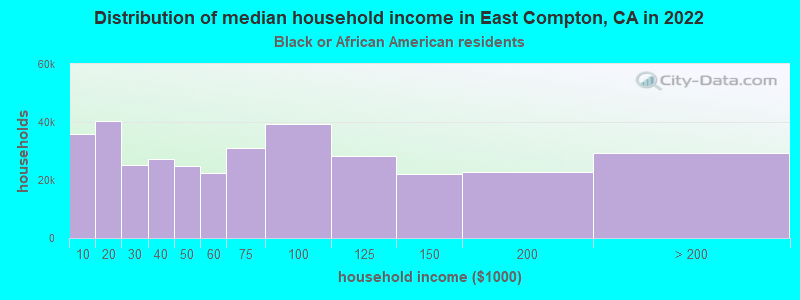
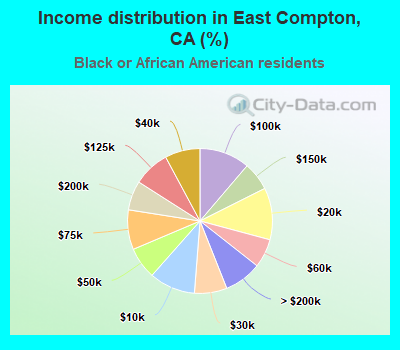
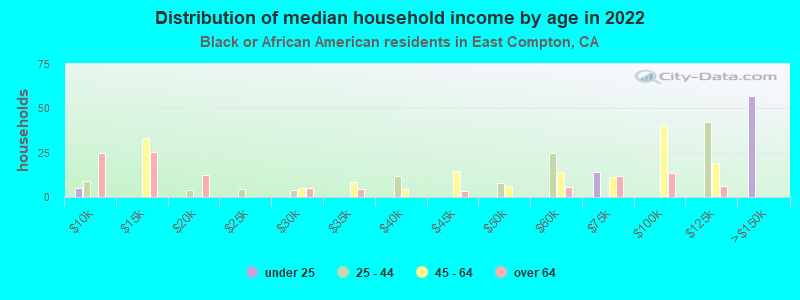
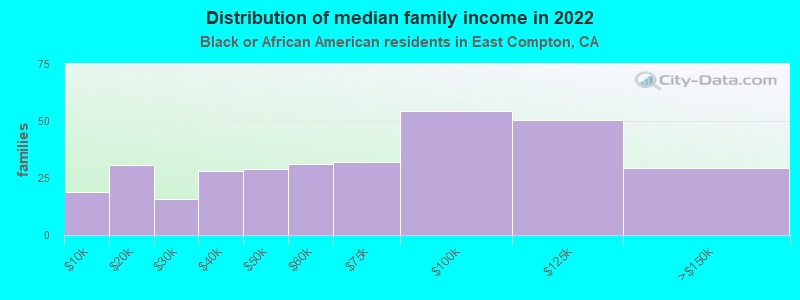
Income statistics for Black or African American residents
Median household income in East Compton, CA in 2022:| East Compton: | $65,569 |
| State: | $63,268 |
Change in median household income between 2000 and 2022:| East Compton, California: | +83.6% |
| State: | +81.0% |
Number of households with income < $10k:| East Compton: | 10.3% (35,885) |
| State: | 9.0% (73,219) |
Number of households with income $10k - 20k:| East Compton: | 11.6% (40,427) |
| State: | 10.6% (86,666) |
Number of households with income $20k - 30k:| East Compton: | 7.3% (25,338) |
| State: | 7.1% (57,719) |
Number of households with income $30k - 40k:| East Compton: | 7.8% (27,341) |
| State: | 7.2% (58,714) |
Number of households with income $40k - 50k:| East Compton: | 7.1% (24,801) |
| State: | 7.1% (58,075) |
Number of households with income $50k - 60k:| East Compton: | 6.4% (22,466) |
| State: | 6.8% (55,229) |
Number of households with income $60k - 75k:| East Compton: | 8.9% (30,921) |
| California: | 8.8% (71,895) |
Number of households with income $75k - 100k:| East Compton: | 11.2% (39,265) |
| State: | 11.9% (96,893) |
Number of households with income $100k - 125k:| East Compton: | 8.1% (28,412) |
| California: | 8.7% (70,729) |
Number of households with income $125k - 150k:| East Compton: | 6.4% (22,178) |
| State: | 6.3% (51,211) |
Number of households with income $150k - 200k:| East Compton: | 6.5% (22,835) |
| California: | 7.2% (58,687) |
Number of households with income > $200k:| East Compton: | 8.4% (29,244) |
| California: | 9.3% (75,487) |
Aggregate household income in East Compton in 2022: $288,898,484
Median family income in East Compton in 2022:| East Compton: | $80,295 |
| State: | $77,263 |
Number of families with income < $10k:| East Compton: | 5.9% (19) |
| State: | 5.9% (27,037) |
Number of families with income $10k - 20k:| East Compton: | 9.6% (31) |
| State: | 6.4% (29,505) |
Number of families with income $20k - 30k:| East Compton: | 4.9% (16) |
| State: | 5.6% (25,755) |
Number of families with income $30k - 40k:| East Compton: | 8.8% (28) |
| State: | 6.8% (30,948) |
Number of families with income $40k - 50k:| East Compton: | 9.1% (29) |
| State: | 8.3% (38,171) |
Number of families with income $50k - 60k:| East Compton: | 9.7% (31) |
| State: | 7.0% (31,860) |
Number of families with income $60k - 75k:| East Compton: | 10.0% (32) |
| State: | 8.7% (40,021) |
Number of families with income $75k - 100k:| East Compton: | 17.0% (54) |
| California: | 12.4% (56,846) |
Number of families with income $100k - 125k:| East Compton: | 15.7% (50) |
| California: | 9.8% (44,911) |
Number of families with income $125k - 150k:| East Compton: | 9.2% (29) |
| California: | 7.5% (34,434) |
Median non-family income in East Compton in 2022:| East Compton: | $16,762 |
| State: | $41,942 |
Change in median non-family income between 2000 and 2022:| East Compton, California: | +73.5% |
| State: | +72.0% |
Median per capita income in East Compton in 2022:| East Compton: | $28,444 |
| State: | $36,708 |
Change in median per capita income between 2000 and 2022:| East Compton, California: | +117.9% |
| State: | +110.4% |
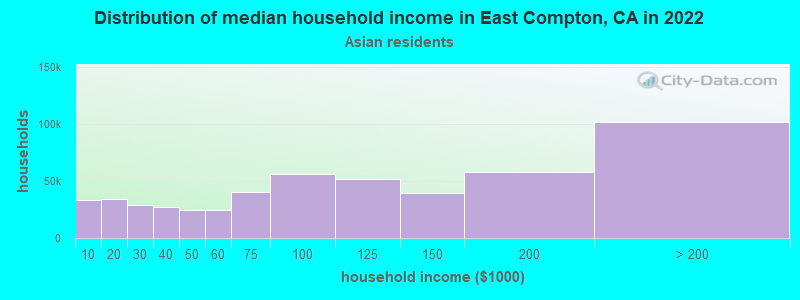
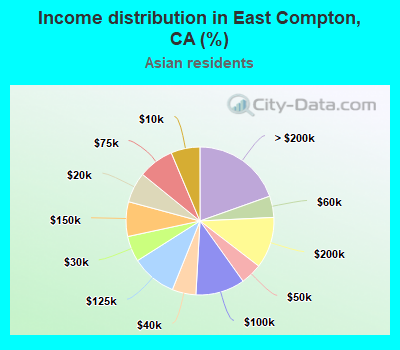
Income statistics for Asian residents
Median household income in East Compton, CA in 2022:| East Compton: | $92,987 |
| California: | $119,861 |
Change in median household income between 2000 and 2022:| East Compton, California: | +101.1% |
| State: | +116.5% |
Number of households with income < $10k:| East Compton: | 6.3% (32,931) |
| State: | 5.1% (106,273) |
Number of households with income $10k - 20k:| East Compton: | 6.6% (34,537) |
| State: | 4.9% (101,815) |
Number of households with income $20k - 30k:| East Compton: | 5.6% (29,217) |
| State: | 4.6% (94,414) |
Number of households with income $30k - 40k:| East Compton: | 5.2% (27,030) |
| California: | 4.1% (84,491) |
Number of households with income $40k - 50k:| East Compton: | 4.7% (24,410) |
| State: | 4.0% (81,758) |
Number of households with income $50k - 60k:| East Compton: | 4.7% (24,258) |
| State: | 3.9% (80,971) |
Number of households with income $60k - 75k:| East Compton: | 7.8% (40,605) |
| California: | 6.0% (124,194) |
Number of households with income $75k - 100k:| East Compton: | 10.8% (55,895) |
| State: | 9.7% (200,337) |
Number of households with income $100k - 125k:| East Compton: | 9.9% (51,554) |
| State: | 9.4% (193,488) |
Number of households with income $125k - 150k:| East Compton: | 7.6% (39,397) |
| California: | 7.7% (158,253) |
Number of households with income $150k - 200k:| East Compton: | 11.2% (58,238) |
| State: | 12.2% (252,139) |
Number of households with income > $200k:| East Compton: | 19.6% (101,751) |
| State: | 28.4% (586,641) |
Aggregate household income in East Compton in 2022: $6,081,913
Median family income in East Compton in 2022:| East Compton: | $94,951 |
| State: | $136,040 |
Median per capita income in East Compton in 2022:| East Compton: | $24,819 |
| State: | $58,824 |
Change in median per capita income between 2000 and 2022:| East Compton, California: | +148.4% |
| State: | +166.8% |
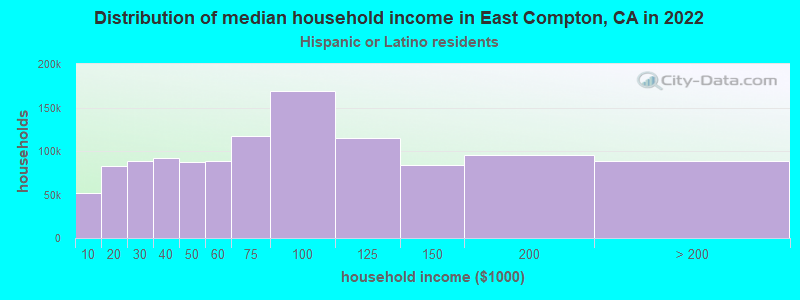
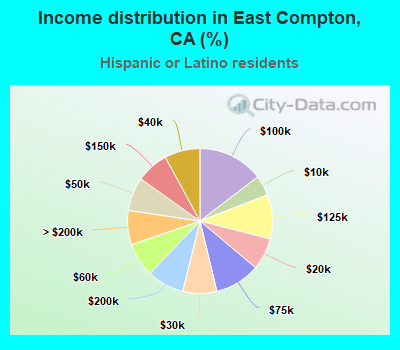
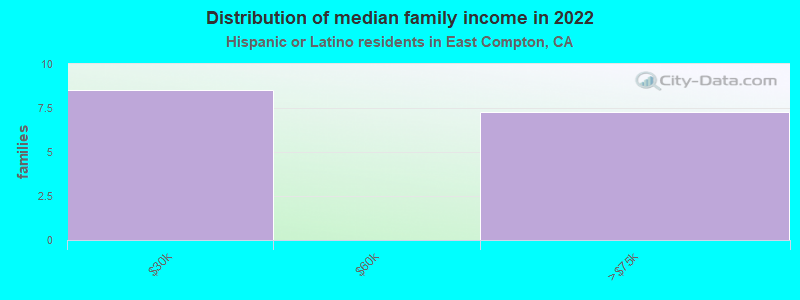
Income statistics for Hispanic or Latino residents
Median household income in East Compton, CA in 2022:| East Compton: | $61,718 |
| State: | $75,698 |
Change in median household income between 2000 and 2022:| East Compton, California: | +110.8% |
| State: | +107.2% |
Number of households with income < $10k:| East Compton: | 4.5% (52,077) |
| State: | 4.3% (183,294) |
Number of households with income $10k - 20k:| East Compton: | 7.1% (82,293) |
| State: | 6.0% (253,903) |
Number of households with income $20k - 30k:| East Compton: | 7.6% (88,076) |
| California: | 6.8% (286,386) |
Number of households with income $30k - 40k:| East Compton: | 7.9% (91,677) |
| State: | 7.4% (313,728) |
Number of households with income $40k - 50k:| East Compton: | 7.5% (86,859) |
| California: | 7.4% (313,199) |
Number of households with income $50k - 60k:| East Compton: | 7.6% (88,167) |
| State: | 7.2% (305,366) |
Number of households with income $60k - 75k:| East Compton: | 10.1% (117,244) |
| State: | 10.3% (434,937) |
Number of households with income $75k - 100k:| East Compton: | 14.6% (169,438) |
| State: | 14.4% (607,302) |
Number of households with income $100k - 125k:| East Compton: | 9.9% (114,464) |
| State: | 10.6% (447,424) |
Number of households with income $125k - 150k:| East Compton: | 7.2% (83,582) |
| State: | 7.5% (316,022) |
Number of households with income $150k - 200k:| East Compton: | 8.3% (95,675) |
| California: | 9.2% (386,269) |
Number of households with income > $200k:| East Compton: | 7.6% (88,455) |
| California: | 8.8% (372,651) |
Aggregate household income in East Compton in 2022: $2,491,526,815
Median family income in East Compton in 2022:| East Compton: | $56,567 |
| State: | $77,589 |
Number of families with income $20k - 30k:| East Compton: | 54.0% (9) |
| State: | 6.6% (216,764) |
Number of families with income $60k - 75k:| East Compton: | 46.0% (7) |
| State: | 10.5% (345,838) |
Median non-family income in East Compton in 2022:| East Compton: | $51,557 |
| California: | $49,746 |
Change in median non-family income between 2000 and 2022:| East Compton, California: | +107.5% |
| California: | +100.7% |
Median per capita income in East Compton in 2022:| East Compton: | $15,367 |
| State: | $27,240 |
Change in median per capita income between 2000 and 2022:| East Compton, California: | +138.1% |
| State: | +133.3% |
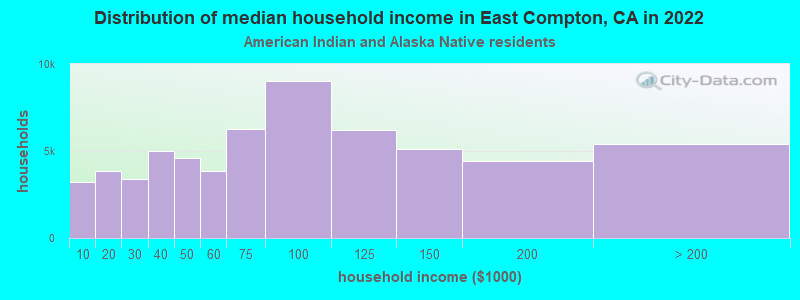
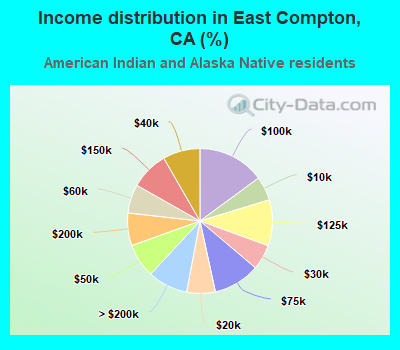
Income statistics for American Indian and Alaska Native residents
Median household income in East Compton, CA in 2022:| East Compton: | $104,396 |
| State: | $76,752 |
Change in median household income between 2000 and 2022:| East Compton, California: | +106.6% |
| State: | +110.0% |
Number of households with income < $10k:| East Compton: | 5.4% (3,240) |
| State: | 5.4% (8,471) |
Number of households with income $10k - 20k:| East Compton: | 6.4% (3,860) |
| State: | 6.0% (9,381) |
Number of households with income $20k - 30k:| East Compton: | 5.6% (3,402) |
| State: | 5.5% (8,668) |
Number of households with income $30k - 40k:| East Compton: | 8.3% (5,018) |
| California: | 8.3% (13,030) |
Number of households with income $40k - 50k:| East Compton: | 7.6% (4,582) |
| State: | 6.9% (10,908) |
Number of households with income $50k - 60k:| East Compton: | 6.4% (3,871) |
| State: | 7.1% (11,198) |
Number of households with income $60k - 75k:| East Compton: | 10.4% (6,283) |
| California: | 9.6% (15,190) |
Number of households with income $75k - 100k:| East Compton: | 14.9% (9,011) |
| State: | 14.1% (22,274) |
Number of households with income $100k - 125k:| East Compton: | 10.3% (6,195) |
| California: | 11.2% (17,643) |
Number of households with income $125k - 150k:| East Compton: | 8.5% (5,122) |
| California: | 8.3% (13,117) |
Number of households with income $150k - 200k:| East Compton: | 7.3% (4,399) |
| California: | 8.8% (13,853) |
Number of households with income > $200k:| East Compton: | 8.9% (5,397) |
| California: | 8.8% (13,925) |
Aggregate household income in East Compton in 2022: $1,864,071
Median family income in East Compton in 2022:| East Compton: | $107,083 |
| State: | $81,108 |
Number of families with income $50k - 60k:| East Compton: | 100.0% (13) |
| State: | 6.9% (7,834) |
Median non-family income in East Compton in 2022:| East Compton: | $53,508 |
| State: | $51,296 |
Change in median non-family income between 2000 and 2022:| East Compton, California: | +103.8% |
| State: | +114.0% |
Median per capita income in East Compton in 2022:| East Compton: | $30,218 |
| California: | $30,289 |
Change in median per capita income between 2000 and 2022:| East Compton, California: | +111.4% |
| California: | +98.9% |
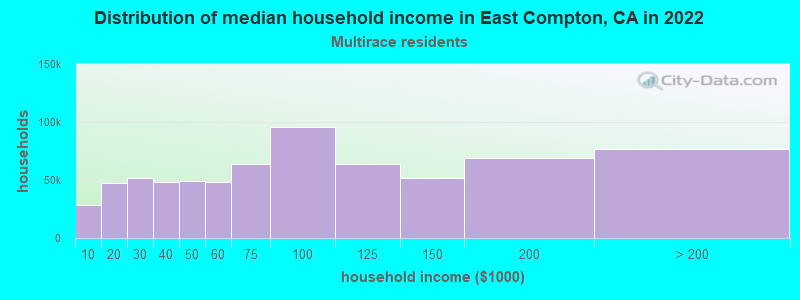
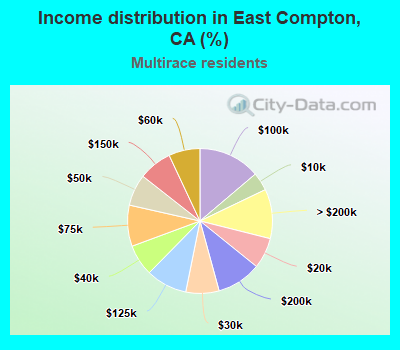
Income statistics for Multirace residents
Median household income in East Compton, CA in 2022:| East Compton: | $93,264 |
| California: | $83,153 |
Change in median household income between 2000 and 2022:| East Compton, California: | +112.7% |
| State: | +106.0% |
Number of households with income < $10k:| East Compton: | 4.1% (28,228) |
| State: | 4.2% (85,299) |
Number of households with income $10k - 20k:| East Compton: | 6.9% (47,646) |
| State: | 6.1% (122,966) |
Number of households with income $20k - 30k:| East Compton: | 7.4% (51,493) |
| State: | 6.4% (129,328) |
Number of households with income $30k - 40k:| East Compton: | 7.0% (48,534) |
| California: | 6.4% (130,070) |
Number of households with income $40k - 50k:| East Compton: | 7.0% (48,859) |
| California: | 6.5% (131,254) |
Number of households with income $50k - 60k:| East Compton: | 7.0% (48,311) |
| State: | 6.5% (132,382) |
Number of households with income $60k - 75k:| East Compton: | 9.2% (63,662) |
| State: | 9.4% (191,472) |
Number of households with income $75k - 100k:| East Compton: | 13.8% (95,782) |
| California: | 13.3% (269,691) |
Number of households with income $100k - 125k:| East Compton: | 9.2% (63,670) |
| State: | 10.2% (207,286) |
Number of households with income $125k - 150k:| East Compton: | 7.4% (51,542) |
| California: | 7.8% (158,259) |
Number of households with income $150k - 200k:| East Compton: | 9.9% (68,961) |
| California: | 10.3% (209,227) |
Number of households with income > $200k:| East Compton: | 11.0% (76,494) |
| California: | 13.0% (263,210) |
Aggregate household income in East Compton in 2022: $134,873,024
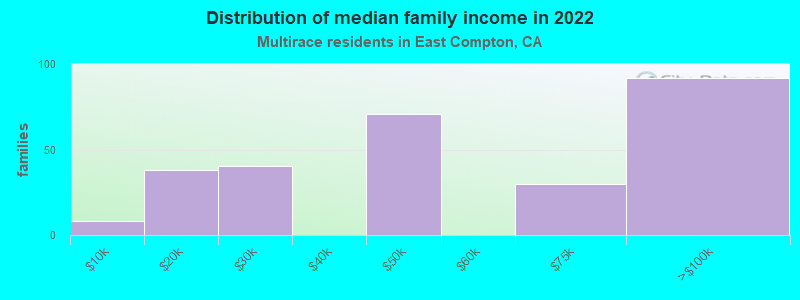
Median family income in East Compton in 2022:| East Compton: | $61,061 |
| California: | $87,642 |
Number of families with income < $10k:| East Compton: | 3.0% (8) |
| State: | 3.2% (48,017) |
Number of families with income $10k - 20k:| East Compton: | 13.7% (38) |
| State: | 4.1% (60,419) |
Number of families with income $20k - 30k:| East Compton: | 14.5% (40) |
| California: | 6.1% (89,742) |
Number of families with income $40k - 50k:| East Compton: | 25.3% (71) |
| State: | 6.8% (100,085) |
Number of families with income $60k - 75k:| East Compton: | 10.7% (30) |
| State: | 9.5% (140,131) |
Number of families with income $75k - 100k:| East Compton: | 32.8% (92) |
| California: | 13.8% (203,439) |
Median non-family income in East Compton in 2022:| East Compton: | $160,961 |
| State: | $56,558 |
Change in median non-family income between 2000 and 2022:| East Compton, California: | +100.0% |
| California: | +100.2% |
Median per capita income in East Compton in 2022:| East Compton: | $18,885 |
| State: | $32,124 |
Change in median per capita income between 2000 and 2022:| East Compton, California: | +108.4% |
| State: | +120.4% |
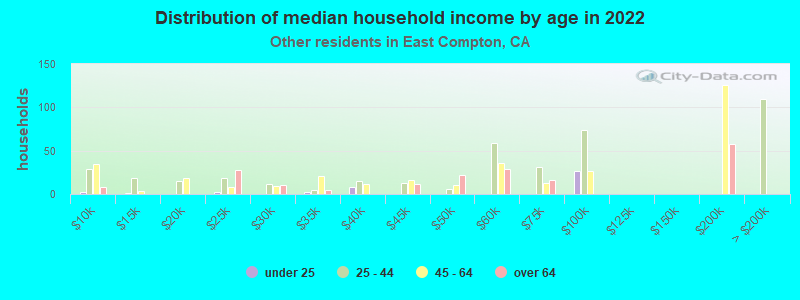
Income statistics for other residents
Number of households with income < $10k:| East Compton: | 5.0% (467) |
| State: | 4.6% (93,035) |
Number of households with income $10k - 20k:| East Compton: | 7.4% (686) |
| State: | 6.3% (126,222) |
Number of households with income $20k - 30k:| East Compton: | 7.8% (721) |
| California: | 7.1% (142,656) |
Number of households with income $30k - 40k:| East Compton: | 8.5% (787) |
| State: | 8.2% (165,018) |
Number of households with income $40k - 50k:| East Compton: | 7.9% (735) |
| State: | 8.0% (161,732) |
Number of households with income $50k - 60k:| East Compton: | 8.0% (740) |
| California: | 7.6% (152,152) |
Number of households with income $60k - 75k:| East Compton: | 10.4% (966) |
| State: | 10.4% (209,951) |
Number of households with income $75k - 100k:| East Compton: | 14.7% (1,358) |
| California: | 14.7% (296,102) |
Number of households with income $100k - 125k:| East Compton: | 10.0% (924) |
| California: | 10.7% (214,281) |
Number of households with income $125k - 150k:| East Compton: | 6.9% (635) |
| California: | 7.1% (143,092) |
Number of households with income $150k - 200k:| East Compton: | 7.5% (692) |
| State: | 8.6% (172,215) |
Number of households with income > $200k:| East Compton: | 5.8% (537) |
| State: | 6.7% (134,102) |
Aggregate household income in East Compton in 2022: $776,482,697
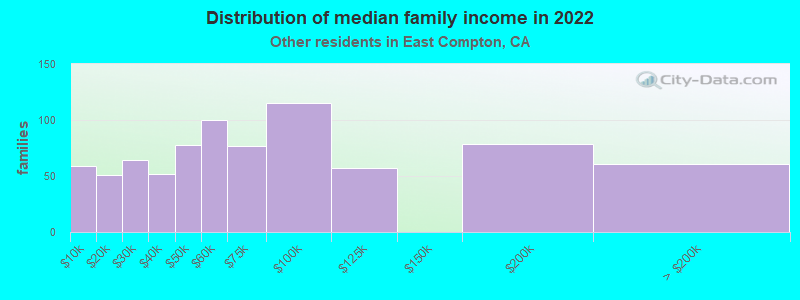
Median family income in East Compton in 2022:| East Compton: | $61,667 |
| California: | $72,756 |
Number of families with income < $10k:| East Compton: | 7.5% (59) |
| State: | 4.3% (69,090) |
Number of families with income $10k - 20k:| East Compton: | 6.4% (51) |
| State: | 5.1% (82,116) |
Number of families with income $20k - 30k:| East Compton: | 8.1% (64) |
| California: | 7.0% (112,854) |
Number of families with income $30k - 40k:| East Compton: | 6.6% (52) |
| State: | 8.4% (135,938) |
Number of families with income $40k - 50k:| East Compton: | 9.9% (78) |
| California: | 8.4% (135,353) |
Number of families with income $50k - 60k:| East Compton: | 12.6% (100) |
| California: | 7.7% (124,826) |
Number of families with income $60k - 75k:| East Compton: | 9.7% (77) |
| California: | 10.7% (173,628) |
Number of families with income $75k - 100k:| East Compton: | 14.6% (115) |
| State: | 15.2% (245,724) |
Number of families with income $100k - 125k:| East Compton: | 7.2% (57) |
| State: | 10.9% (176,716) |
Number of families with income $150k - 200k:| East Compton: | 9.9% (79) |
| State: | 8.5% (137,332) |
Number of families with income > $200k:| East Compton: | 7.7% (61) |
| State: | 6.6% (106,346) |
Median non-family income in East Compton in 2022:| East Compton: | $41,750 |
| State: | $43,881 |
Change in median non-family income between 2000 and 2022:| East Compton, California: | +84.3% |
| California: | +84.6% |
Median per capita income in East Compton in 2022:| East Compton: | $16,295 |
| California: | $25,164 |
Change in median per capita income between 2000 and 2022:| East Compton, California: | +144.3% |
| State: | +137.9% |