District 2, Oldtown, Maryland (MD) income map, earnings map, and wages data
The median household income in District 2, Oldtown, MD in 2022 was $57,793, which was 64.4% less than the median annual income of $94,991 across the entire state of Maryland. Compared to the median income of $37,969 in 2000 this represents an increase of 34.3%. The per capita income in 2022 was $29,281, which means an increase of 42.9% compared to 2000 when it was $16,729.
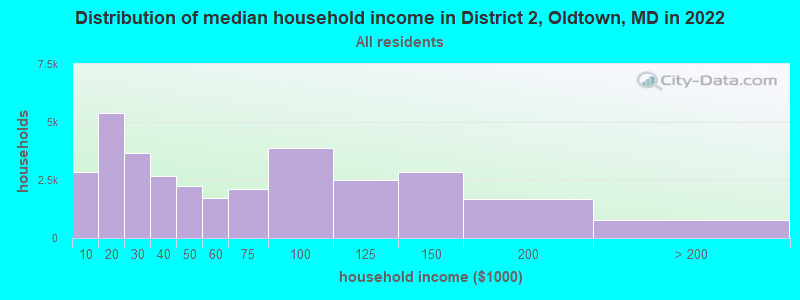
Income statistics for all residents
Median household income in District 2, Oldtown, MD in 2022:| District 2, Oldtown: | $57,793 |
| Maryland: | $94,991 |
Change in median household income between 2000 and 2022:| District 2, Oldtown, Maryland: | +52.2% |
| State: | +79.7% |
Number of households with income < $10k:| District 2, Oldtown: | 8.8% (2,848) |
| State: | 4.8% (114,450) |
Number of households with income $10k - 20k:| District 2, Oldtown: | 16.6% (5,376) |
| State: | 5.0% (117,883) |
Number of households with income $20k - 30k:| District 2, Oldtown: | 11.4% (3,673) |
| Maryland: | 5.2% (123,350) |
Number of households with income $30k - 40k:| District 2, Oldtown: | 8.2% (2,652) |
| State: | 5.6% (134,104) |
Number of households with income $40k - 50k:| District 2, Oldtown: | 7.0% (2,252) |
| State: | 5.6% (132,932) |
Number of households with income $50k - 60k:| District 2, Oldtown: | 5.4% (1,737) |
| Maryland: | 5.6% (132,707) |
Number of households with income $60k - 75k:| District 2, Oldtown: | 6.5% (2,114) |
| State: | 7.9% (188,335) |
Number of households with income $75k - 100k:| District 2, Oldtown: | 12.0% (3,883) |
| State: | 12.5% (297,873) |
Number of households with income $100k - 125k:| District 2, Oldtown: | 7.8% (2,508) |
| State: | 10.5% (250,497) |
Number of households with income $125k - 150k:| District 2, Oldtown: | 8.8% (2,833) |
| State: | 8.1% (193,208) |
Number of households with income $150k - 200k:| District 2, Oldtown: | 5.2% (1,670) |
| Maryland: | 11.6% (274,905) |
Number of households with income > $200k:| District 2, Oldtown: | 2.4% (786) |
| State: | 17.5% (415,740) |
Aggregate household income in District 2, Oldtown in 2022: $30,833,048
Median family income in District 2, Oldtown in 2022:| District 2, Oldtown: | $83,481 |
| Maryland: | $117,294 |
Median non-family income in District 2, Oldtown in 2022:| District 2, Oldtown: | $24,246 |
| State: | $57,179 |
Change in median non-family income between 2000 and 2022:| District 2, Oldtown, Maryland: | +47.3% |
| State: | +75.1% |
Median per capita income in District 2, Oldtown in 2022:| District 2, Oldtown: | $29,282 |
| Maryland: | $49,236 |
Change in median per capita income between 2000 and 2022:| District 2, Oldtown, Maryland: | +75.0% |
| State: | +92.2% |
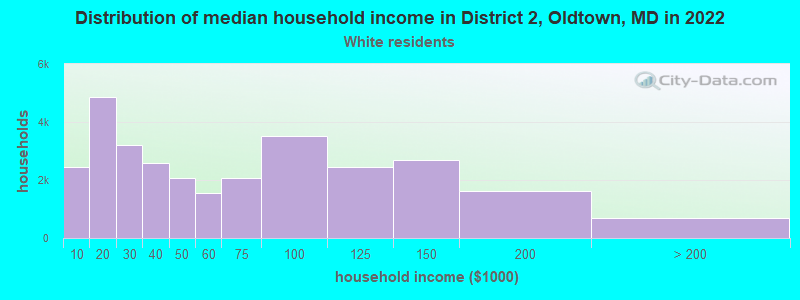
Income statistics for White residents
Median household income in District 2, Oldtown, MD in 2022:| District 2, Oldtown: | $58,567 |
| Maryland: | $107,160 |
Change in median household income between 2000 and 2022:| District 2, Oldtown, Maryland: | +55.5% |
| State: | +85.3% |
Number of households with income < $10k:| District 2, Oldtown: | 8.3% (2,459) |
| Maryland: | 3.7% (47,387) |
Number of households with income $10k - 20k:| District 2, Oldtown: | 16.3% (4,845) |
| State: | 4.1% (52,102) |
Number of households with income $20k - 30k:| District 2, Oldtown: | 10.8% (3,204) |
| Maryland: | 4.6% (58,758) |
Number of households with income $30k - 40k:| District 2, Oldtown: | 8.6% (2,571) |
| State: | 4.7% (59,745) |
Number of households with income $40k - 50k:| District 2, Oldtown: | 7.0% (2,079) |
| State: | 5.0% (62,576) |
Number of households with income $50k - 60k:| District 2, Oldtown: | 5.2% (1,546) |
| State: | 5.1% (64,484) |
Number of households with income $60k - 75k:| District 2, Oldtown: | 7.0% (2,086) |
| State: | 7.7% (97,019) |
Number of households with income $75k - 100k:| District 2, Oldtown: | 11.8% (3,506) |
| Maryland: | 11.8% (149,205) |
Number of households with income $100k - 125k:| District 2, Oldtown: | 8.3% (2,458) |
| State: | 10.6% (134,231) |
Number of households with income $125k - 150k:| District 2, Oldtown: | 9.1% (2,698) |
| Maryland: | 8.8% (111,081) |
Number of households with income $150k - 200k:| District 2, Oldtown: | 5.4% (1,611) |
| State: | 12.9% (162,966) |
Number of households with income > $200k:| District 2, Oldtown: | 2.3% (694) |
| Maryland: | 20.9% (264,377) |
Aggregate household income in District 2, Oldtown in 2022: $29,461,032
Median family income in District 2, Oldtown in 2022:| District 2, Oldtown: | $83,459 |
| State: | $134,708 |
Number of families with income < $10k:| District 2, Oldtown: | 3.6% (9) |
| State: | 1.6% (13,064) |
Number of families with income $20k - 30k:| District 2, Oldtown: | 9.2% (24) |
| State: | 2.2% (18,018) |
Number of families with income $30k - 40k:| District 2, Oldtown: | 10.3% (28) |
| State: | 3.3% (26,886) |
Number of families with income $40k - 50k:| District 2, Oldtown: | 10.5% (28) |
| State: | 3.6% (29,194) |
Number of families with income $50k - 60k:| District 2, Oldtown: | 9.6% (26) |
| State: | 4.1% (33,120) |
Number of families with income $60k - 75k:| District 2, Oldtown: | 6.9% (18) |
| State: | 6.6% (53,501) |
Number of families with income $75k - 100k:| District 2, Oldtown: | 16.2% (43) |
| Maryland: | 11.3% (91,779) |
Number of families with income $100k - 125k:| District 2, Oldtown: | 11.5% (31) |
| State: | 11.3% (91,483) |
Number of families with income $125k - 150k:| District 2, Oldtown: | 22.1% (59) |
| State: | 9.9% (80,832) |
Median non-family income in District 2, Oldtown in 2022:| District 2, Oldtown: | $24,970 |
| State: | $61,991 |
Change in median non-family income between 2000 and 2022:| District 2, Oldtown, Maryland: | +51.7% |
| State: | +76.8% |
Median per capita income in District 2, Oldtown in 2022:| District 2, Oldtown: | $32,206 |
| State: | $59,750 |
Change in median per capita income between 2000 and 2022:| District 2, Oldtown, Maryland: | +91.9% |
| Maryland: | +104.5% |
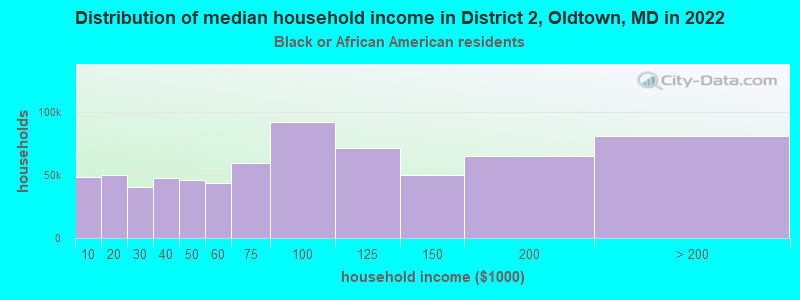
Income statistics for Black or African American residents
Median household income in District 2, Oldtown, MD in 2022:| District 2, Oldtown: | $166,263 |
| State: | $77,368 |
Change in median household income between 2000 and 2022:| District 2, Oldtown, Maryland: | +106.6% |
| State: | +85.7% |
Number of households with income < $10k:| District 2, Oldtown: | 7.0% (48,395) |
| State: | 7.0% (50,093) |
Number of households with income $10k - 20k:| District 2, Oldtown: | 7.2% (50,106) |
| Maryland: | 7.2% (51,849) |
Number of households with income $20k - 30k:| District 2, Oldtown: | 5.8% (40,112) |
| Maryland: | 5.8% (41,510) |
Number of households with income $30k - 40k:| District 2, Oldtown: | 6.9% (47,790) |
| State: | 6.9% (49,466) |
Number of households with income $40k - 50k:| District 2, Oldtown: | 6.6% (45,945) |
| State: | 6.6% (47,557) |
Number of households with income $50k - 60k:| District 2, Oldtown: | 6.2% (43,293) |
| Maryland: | 6.2% (44,818) |
Number of households with income $60k - 75k:| District 2, Oldtown: | 8.6% (59,640) |
| Maryland: | 8.6% (61,728) |
Number of households with income $75k - 100k:| District 2, Oldtown: | 13.2% (91,899) |
| Maryland: | 13.2% (95,107) |
Number of households with income $100k - 125k:| District 2, Oldtown: | 10.2% (71,093) |
| State: | 10.2% (73,579) |
Number of households with income $125k - 150k:| District 2, Oldtown: | 7.2% (50,218) |
| Maryland: | 7.2% (51,970) |
Number of households with income $150k - 200k:| District 2, Oldtown: | 9.4% (65,344) |
| State: | 9.4% (67,623) |
Number of households with income > $200k:| District 2, Oldtown: | 11.7% (81,069) |
| State: | 11.7% (83,862) |
Aggregate household income in District 2, Oldtown in 2022: $8,657,140
Median family income in District 2, Oldtown in 2022:| District 2, Oldtown: | $180,907 |
| State: | $96,241 |
Median per capita income in District 2, Oldtown in 2022:| District 2, Oldtown: | $11,469 |
| State: | $40,756 |