District 10, Sharptown, Maryland (MD) income map, earnings map, and wages data
The median household income in District 10, Sharptown, MD in 2022 was $66,614, which was 42.6% less than the median annual income of $94,991 across the entire state of Maryland. Compared to the median income of $36,016 in 2000 this represents an increase of 45.9%. The per capita income in 2022 was $30,928, which means an increase of 50.2% compared to 2000 when it was $15,412.
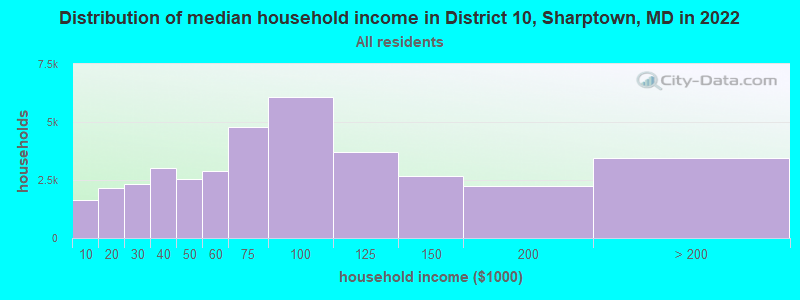
Income statistics for all residents
Median household income in District 10, Sharptown, MD in 2022:| District 10, Sharptown: | $66,614 |
| Maryland: | $94,991 |
Change in median household income between 2000 and 2022:| District 10, Sharptown, Maryland: | +85.0% |
| State: | +79.7% |
Number of households with income < $10k:| District 10, Sharptown: | 4.4% (1,639) |
| State: | 4.8% (114,450) |
Number of households with income $10k - 20k:| District 10, Sharptown: | 5.7% (2,151) |
| State: | 5.0% (117,883) |
Number of households with income $20k - 30k:| District 10, Sharptown: | 6.2% (2,323) |
| State: | 5.2% (123,350) |
Number of households with income $30k - 40k:| District 10, Sharptown: | 8.0% (3,009) |
| State: | 5.6% (134,104) |
Number of households with income $40k - 50k:| District 10, Sharptown: | 6.8% (2,530) |
| State: | 5.6% (132,932) |
Number of households with income $50k - 60k:| District 10, Sharptown: | 7.7% (2,873) |
| State: | 5.6% (132,707) |
Number of households with income $60k - 75k:| District 10, Sharptown: | 12.8% (4,802) |
| State: | 7.9% (188,335) |
Number of households with income $75k - 100k:| District 10, Sharptown: | 16.2% (6,085) |
| Maryland: | 12.5% (297,873) |
Number of households with income $100k - 125k:| District 10, Sharptown: | 9.9% (3,727) |
| State: | 10.5% (250,497) |
Number of households with income $125k - 150k:| District 10, Sharptown: | 7.1% (2,669) |
| State: | 8.1% (193,208) |
Number of households with income $150k - 200k:| District 10, Sharptown: | 6.0% (2,232) |
| State: | 11.6% (274,905) |
Number of households with income > $200k:| District 10, Sharptown: | 9.2% (3,430) |
| State: | 17.5% (415,740) |
Aggregate household income in District 10, Sharptown in 2022: $48,699,147
Median family income in District 10, Sharptown in 2022:| District 10, Sharptown: | $84,533 |
| State: | $117,294 |
Median non-family income in District 10, Sharptown in 2022:| District 10, Sharptown: | $24,816 |
| State: | $57,179 |
Change in median non-family income between 2000 and 2022:| District 10, Sharptown, Maryland: | +89.6% |
| Maryland: | +75.1% |
Median per capita income in District 10, Sharptown in 2022:| District 10, Sharptown: | $30,929 |
| Maryland: | $49,236 |
Change in median per capita income between 2000 and 2022:| District 10, Sharptown, Maryland: | +100.7% |
| State: | +92.2% |
Income statistics for White residents
Median household income in District 10, Sharptown, MD in 2022:| District 10, Sharptown: | $71,619 |
| State: | $107,160 |
Change in median household income between 2000 and 2022:| District 10, Sharptown, Maryland: | +77.5% |
| State: | +85.3% |
Number of households with income < $10k:| District 10, Sharptown: | 5.3% (1,382) |
| Maryland: | 3.7% (47,387) |
Number of households with income $10k - 20k:| District 10, Sharptown: | 3.6% (941) |
| State: | 4.1% (52,102) |
Number of households with income $20k - 30k:| District 10, Sharptown: | 6.6% (1,726) |
| Maryland: | 4.6% (58,758) |
Number of households with income $30k - 40k:| District 10, Sharptown: | 7.2% (1,856) |
| Maryland: | 4.7% (59,745) |
Number of households with income $40k - 50k:| District 10, Sharptown: | 6.7% (1,729) |
| State: | 5.0% (62,576) |
Number of households with income $50k - 60k:| District 10, Sharptown: | 9.8% (2,545) |
| State: | 5.1% (64,484) |
Number of households with income $60k - 75k:| District 10, Sharptown: | 10.6% (2,743) |
| State: | 7.7% (97,019) |
Number of households with income $75k - 100k:| District 10, Sharptown: | 14.3% (3,709) |
| State: | 11.8% (149,205) |
Number of households with income $100k - 125k:| District 10, Sharptown: | 12.1% (3,137) |
| Maryland: | 10.6% (134,231) |
Number of households with income $125k - 150k:| District 10, Sharptown: | 6.4% (1,661) |
| Maryland: | 8.8% (111,081) |
Number of households with income $150k - 200k:| District 10, Sharptown: | 8.0% (2,075) |
| Maryland: | 12.9% (162,966) |
Number of households with income > $200k:| District 10, Sharptown: | 9.4% (2,452) |
| State: | 20.9% (264,377) |
Aggregate household income in District 10, Sharptown in 2022: $31,075,988
Median family income in District 10, Sharptown in 2022:| District 10, Sharptown: | $92,912 |
| State: | $134,708 |
Number of families with income < $10k:| District 10, Sharptown: | 1.9% (3) |
| State: | 1.6% (13,064) |
Number of families with income $10k - 20k:| District 10, Sharptown: | 5.1% (8) |
| State: | 2.0% (16,048) |
Number of families with income $20k - 30k:| District 10, Sharptown: | 8.1% (13) |
| State: | 2.2% (18,018) |
Number of families with income $30k - 40k:| District 10, Sharptown: | 5.6% (9) |
| Maryland: | 3.3% (26,886) |
Number of families with income $40k - 50k:| District 10, Sharptown: | 15.2% (24) |
| State: | 3.6% (29,194) |
Number of families with income $50k - 60k:| District 10, Sharptown: | 16.0% (25) |
| Maryland: | 4.1% (33,120) |
Number of families with income $60k - 75k:| District 10, Sharptown: | 24.0% (38) |
| Maryland: | 6.6% (53,501) |
Number of families with income $75k - 100k:| District 10, Sharptown: | 11.5% (18) |
| Maryland: | 11.3% (91,779) |
Number of families with income $100k - 125k:| District 10, Sharptown: | 3.5% (5) |
| Maryland: | 11.3% (91,483) |
Number of families with income $125k - 150k:| District 10, Sharptown: | 4.9% (8) |
| State: | 9.9% (80,832) |
Number of families with income > $200k:| District 10, Sharptown: | 4.2% (7) |
| State: | 28.1% (228,324) |
Median non-family income in District 10, Sharptown in 2022:| District 10, Sharptown: | $27,702 |
| Maryland: | $61,991 |
Change in median non-family income between 2000 and 2022:| District 10, Sharptown, Maryland: | +85.5% |
| Maryland: | +76.8% |
Median per capita income in District 10, Sharptown in 2022:| District 10, Sharptown: | $34,580 |
| State: | $59,750 |
Change in median per capita income between 2000 and 2022:| District 10, Sharptown, Maryland: | +112.6% |
| State: | +104.5% |
Income statistics for Black or African American residents
Median household income in District 10, Sharptown, MD in 2022:| District 10, Sharptown: | $56,247 |
| State: | $77,368 |
Change in median household income between 2000 and 2022:| District 10, Sharptown, Maryland: | +128.8% |
| State: | +85.7% |
Number of households with income < $10k:| District 10, Sharptown: | 1.2% (99) |
| State: | 7.0% (50,093) |
Number of households with income $10k - 20k:| District 10, Sharptown: | 13.2% (1,115) |
| State: | 7.2% (51,849) |
Number of households with income $20k - 30k:| District 10, Sharptown: | 4.2% (359) |
| Maryland: | 5.8% (41,510) |
Number of households with income $30k - 40k:| District 10, Sharptown: | 12.1% (1,029) |
| State: | 6.9% (49,466) |
Number of households with income $40k - 50k:| District 10, Sharptown: | 4.9% (419) |
| State: | 6.6% (47,557) |
Number of households with income $50k - 60k:| District 10, Sharptown: | 2.8% (235) |
| State: | 6.2% (44,818) |
Number of households with income $60k - 75k:| District 10, Sharptown: | 18.1% (1,532) |
| Maryland: | 8.6% (61,728) |
Number of households with income $75k - 100k:| District 10, Sharptown: | 19.5% (1,648) |
| State: | 13.2% (95,107) |
Number of households with income $100k - 125k:| District 10, Sharptown: | 5.6% (475) |
| Maryland: | 10.2% (73,579) |
Number of households with income $125k - 150k:| District 10, Sharptown: | 8.4% (711) |
| State: | 7.2% (51,970) |
Number of households with income $150k - 200k:| District 10, Sharptown: | 2.4% (203) |
| Maryland: | 9.4% (67,623) |
Number of households with income > $200k:| District 10, Sharptown: | 7.6% (645) |
| State: | 11.7% (83,862) |
Aggregate household income in District 10, Sharptown in 2022: $16,625,905
Median family income in District 10, Sharptown in 2022:| District 10, Sharptown: | $80,619 |
| State: | $96,241 |
Number of families with income < $10k:| District 10, Sharptown: | 4.6% (3) |
| Maryland: | 4.5% (19,574) |
Number of families with income $10k - 20k:| District 10, Sharptown: | 11.6% (7) |
| State: | 3.8% (16,604) |
Number of families with income $20k - 30k:| District 10, Sharptown: | 4.2% (2) |
| State: | 4.3% (18,629) |
Number of families with income $30k - 40k:| District 10, Sharptown: | 18.5% (11) |
| Maryland: | 6.1% (26,770) |
Number of families with income $40k - 50k:| District 10, Sharptown: | 0.8% (0) |
| State: | 6.2% (27,138) |
Number of families with income $60k - 75k:| District 10, Sharptown: | 21.4% (13) |
| Maryland: | 8.0% (35,163) |
Number of families with income $75k - 100k:| District 10, Sharptown: | 38.8% (23) |
| State: | 12.8% (55,976) |
Median non-family income in District 10, Sharptown in 2022:| District 10, Sharptown: | $18,635 |
| Maryland: | $49,944 |
Change in median non-family income between 2000 and 2022:| District 10, Sharptown, Maryland: | +70.8% |
| State: | +71.8% |
Median per capita income in District 10, Sharptown in 2022:| District 10, Sharptown: | $31,833 |
| State: | $40,756 |
Change in median per capita income between 2000 and 2022:| District 10, Sharptown, Maryland: | +126.8% |
| Maryland: | +113.5% |
Income statistics for Asian residents
Number of households with income < $10k:| District 10, Sharptown: | 4.7% (21) |
| State: | 4.6% (6,395) |
Number of households with income $10k - 20k:| District 10, Sharptown: | 3.6% (16) |
| State: | 3.6% (4,994) |
Number of households with income $20k - 30k:| District 10, Sharptown: | 4.7% (21) |
| State: | 4.6% (6,399) |
Number of households with income $30k - 40k:| District 10, Sharptown: | 3.3% (15) |
| Maryland: | 3.4% (4,682) |
Number of households with income $40k - 50k:| District 10, Sharptown: | 4.7% (21) |
| Maryland: | 4.6% (6,382) |
Number of households with income $50k - 60k:| District 10, Sharptown: | 4.7% (21) |
| State: | 4.6% (6,402) |
Number of households with income $60k - 75k:| District 10, Sharptown: | 5.3% (24) |
| State: | 5.4% (7,426) |
Number of households with income $75k - 100k:| District 10, Sharptown: | 11.1% (50) |
| State: | 11.1% (15,313) |
Number of households with income $100k - 125k:| District 10, Sharptown: | 10.7% (48) |
| State: | 10.6% (14,640) |
Number of households with income $125k - 150k:| District 10, Sharptown: | 8.2% (37) |
| Maryland: | 8.3% (11,465) |
Number of households with income $150k - 200k:| District 10, Sharptown: | 13.4% (60) |
| State: | 13.4% (18,490) |
Number of households with income > $200k:| District 10, Sharptown: | 25.6% (115) |
| State: | 25.6% (35,377) |
Median per capita income in District 10, Sharptown in 2022:| District 10, Sharptown: | $119 |
| State: | $53,546 |
Income statistics for Multirace residents
Median household income in District 10, Sharptown, MD in 2022:| District 10, Sharptown: | $83,024 |
| State: | $99,027 |
Change in median household income between 2000 and 2022:| District 10, Sharptown, Maryland: | +121.4% |
| State: | +111.4% |
Number of households with income < $10k:| District 10, Sharptown: | 4.8% (2,600) |
| Maryland: | 4.8% (6,469) |
Number of households with income $10k - 20k:| District 10, Sharptown: | 3.3% (1,794) |
| State: | 3.3% (4,464) |
Number of households with income $20k - 30k:| District 10, Sharptown: | 5.8% (3,138) |
| State: | 5.8% (7,826) |
Number of households with income $30k - 40k:| District 10, Sharptown: | 8.1% (4,416) |
| Maryland: | 8.1% (11,077) |
Number of households with income $40k - 50k:| District 10, Sharptown: | 4.4% (2,374) |
| State: | 4.3% (5,895) |
Number of households with income $50k - 60k:| District 10, Sharptown: | 3.9% (2,145) |
| State: | 3.9% (5,346) |
Number of households with income $60k - 75k:| District 10, Sharptown: | 6.8% (3,672) |
| Maryland: | 6.7% (9,159) |
Number of households with income $75k - 100k:| District 10, Sharptown: | 13.6% (7,360) |
| State: | 13.6% (18,420) |
Number of households with income $100k - 125k:| District 10, Sharptown: | 12.9% (7,012) |
| State: | 12.9% (17,488) |
Number of households with income $125k - 150k:| District 10, Sharptown: | 8.1% (4,398) |
| State: | 8.1% (11,039) |
Number of households with income $150k - 200k:| District 10, Sharptown: | 11.5% (6,267) |
| State: | 11.5% (15,675) |
Number of households with income > $200k:| District 10, Sharptown: | 16.8% (9,136) |
| Maryland: | 17.0% (23,059) |
Aggregate household income in District 10, Sharptown in 2022: $4,192,471
Median family income in District 10, Sharptown in 2022:| District 10, Sharptown: | $78,207 |
| State: | $110,784 |
Number of families with income $10k - 20k:| District 10, Sharptown: | 72.9% (11) |
| Maryland: | 2.2% (2,090) |
Number of families with income $60k - 75k:| District 10, Sharptown: | 27.1% (4) |
| State: | 6.5% (6,128) |
Median per capita income in District 10, Sharptown in 2022:| District 10, Sharptown: | $27,122 |
| State: | $35,630 |