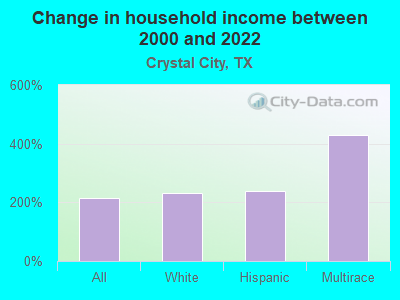
The median household income in Crystal City, TX in 2022 was $48,704, which was 48.4% less than the median annual income of $72,284 across the entire state of Texas. Compared to the median income of $15,400 in 2000 this represents an increase of 68.4%. The per capita income in 2022 was $21,542, which means an increase of 58.7% compared to 2000 when it was $8,899.
Whole page based on the data from 2000 / 2022 when the population of Crystal City, Texas was 7,190 / 6,502
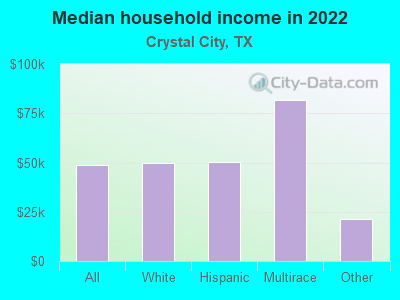
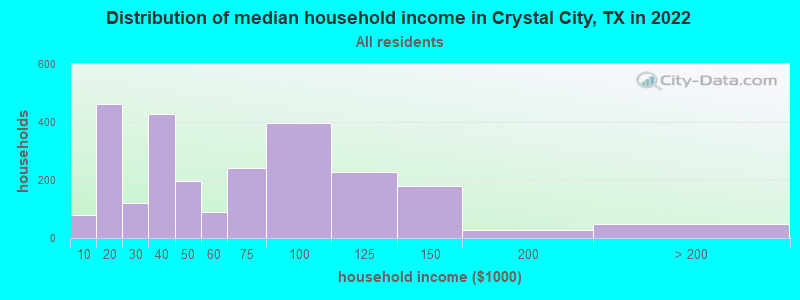
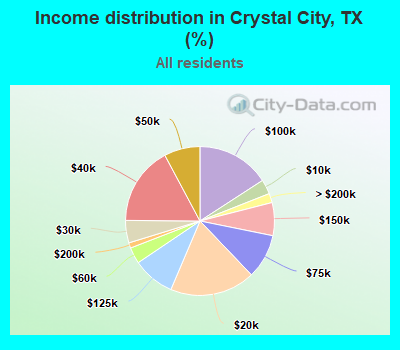
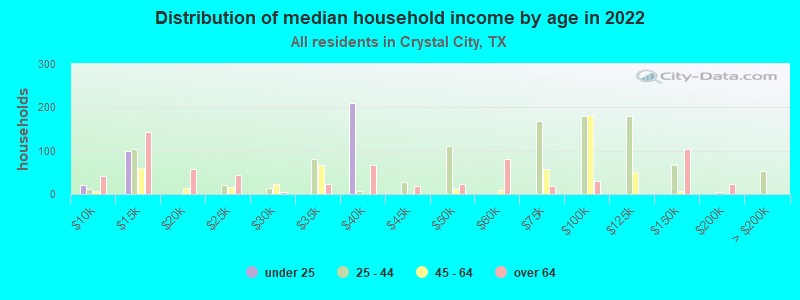
Income statistics for all residents
Median household income in Crystal City, TX in 2022:
Crystal City:
$48,705
Texas:
$72,284
Number of households with income < $10k:
Crystal City:
3.2% (79)
State:
5.5% (611,011)
Number of households with income $10k - 20k:
Crystal City:
18.5% (463)
Texas:
6.7% (743,157)
Number of households with income $20k - 30k:
Crystal City:
4.9% (122)
State:
7.2% (803,381)
Number of households with income $30k - 40k:
Crystal City:
17.1% (426)
Texas:
7.8% (866,080)
Number of households with income $40k - 50k:
Crystal City:
7.8% (195)
Texas:
7.3% (810,440)
Number of households with income $50k - 60k:
Crystal City:
3.5% (88)
Texas:
7.2% (799,783)
Number of households with income $60k - 75k:
Crystal City:
9.7% (242)
Texas:
9.9% (1,095,384)
Number of households with income $75k - 100k:
Crystal City:
15.9% (396)
State:
12.8% (1,419,057)
Number of households with income $100k - 125k:
Crystal City:
9.2% (229)
State:
9.5% (1,054,577)
Number of households with income $125k - 150k:
Crystal City:
7.2% (179)
Texas:
6.7% (741,518)
Number of households with income $150k - 200k:
Crystal City:
1.2% (29)
Texas:
8.7% (961,776)
Number of households with income > $200k:
Crystal City:
2.0% (50)
State:
10.7% (1,181,544)
Aggregate household income in Crystal City in 2022: $153,309,300
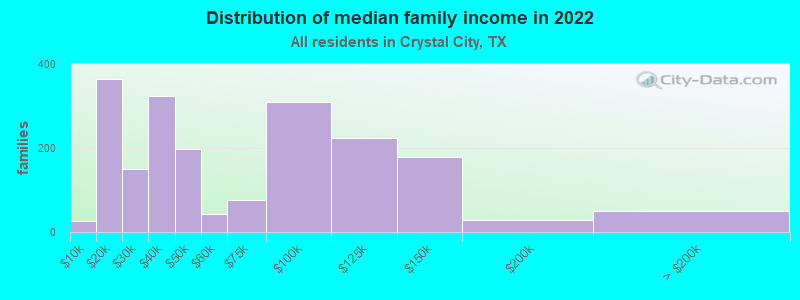
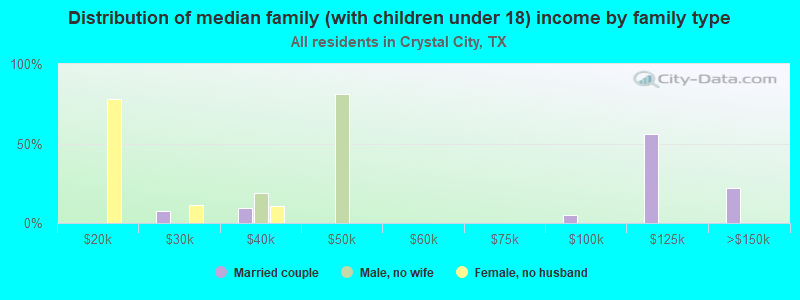
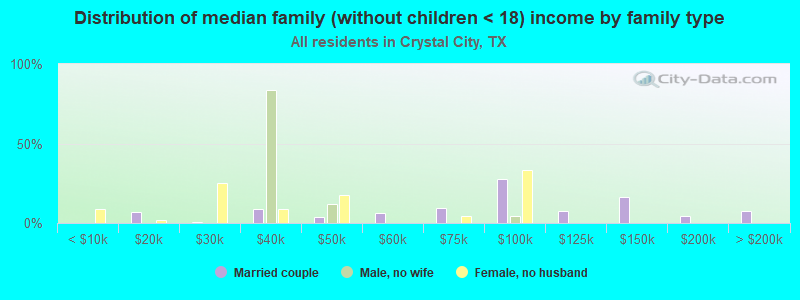
Median family income in Crystal City in 2022:
Crystal City:
$47,416
Texas:
$86,267
Number of families with income < $10k:
Crystal City:
1.3% (26)
State:
4.0% (297,884)
Number of families with income $10k - 20k:
Crystal City:
18.5% (364)
State:
4.3% (324,514)
Number of families with income $20k - 30k:
Crystal City:
7.6% (149)
State:
5.8% (430,949)
Number of families with income $30k - 40k:
Crystal City:
16.4% (324)
State:
6.6% (493,535)
Number of families with income $40k - 50k:
Crystal City:
10.1% (198)
State:
6.7% (499,663)
Number of families with income $50k - 60k:
Crystal City:
2.2% (42)
State:
6.6% (492,203)
Number of families with income $60k - 75k:
Crystal City:
3.9% (77)
State:
9.5% (710,229)
Number of families with income $75k - 100k:
Crystal City:
15.7% (309)
State:
13.6% (1,015,480)
Number of families with income $100k - 125k:
Crystal City:
11.4% (225)
State:
10.7% (797,961)
Number of families with income $125k - 150k:
Crystal City:
9.1% (179)
State:
8.1% (602,985)
Number of families with income $150k - 200k:
Crystal City:
1.4% (28)
State:
10.7% (804,459)
Number of families with income > $200k:
Crystal City:
2.5% (49)
State:
13.5% (1,013,514)
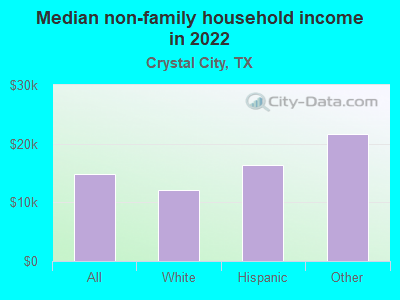
Median non-family income in Crystal City in 2022:
Crystal City:
$14,781
State:
$45,999
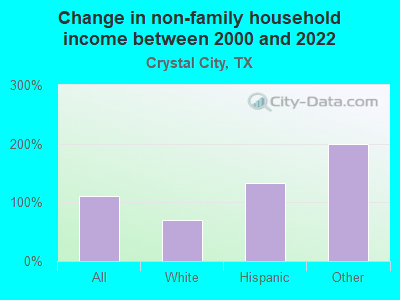
Change in median non-family income between 2000 and 2022:
Crystal City, Texas:
+109.5%
State:
+79.5%
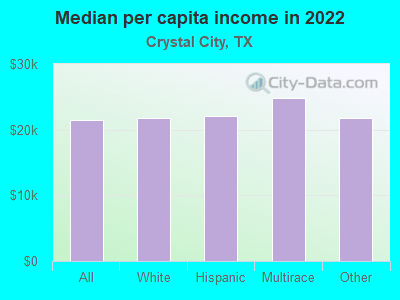
Median per capita income in Crystal City in 2022:
Crystal City:
$21,542
Texas:
$38,123
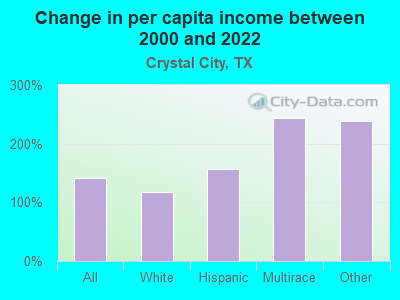
Change in median per capita income between 2000 and 2022:
Crystal City, Texas:
+142.1%
State:
+94.3%
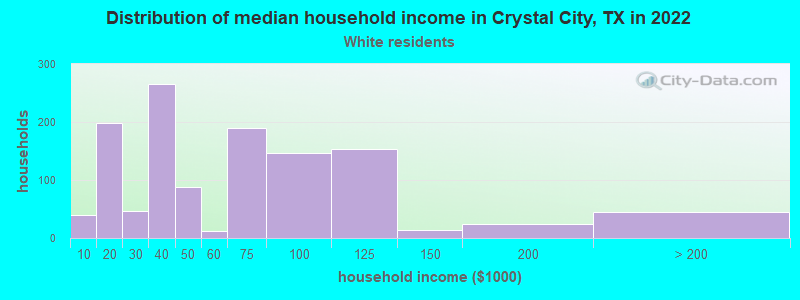
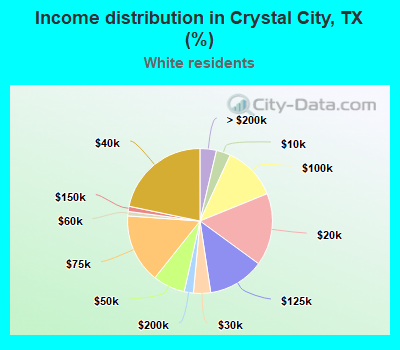
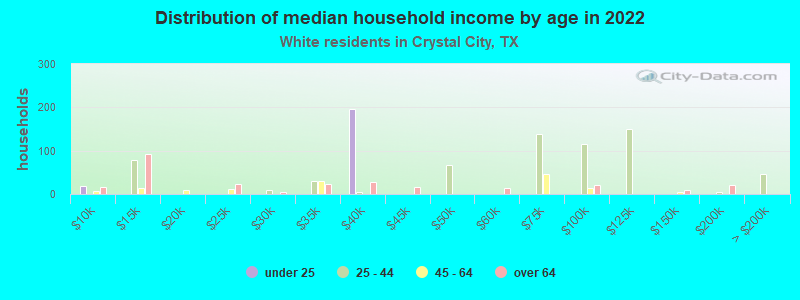
Income statistics for White residents
Median household income in Crystal City, TX in 2022:
Crystal City:
$49,776
State:
$82,032
Number of households with income < $10k:
Crystal City:
3.2% (39)
State:
4.7% (273,716)
Number of households with income $10k - 20k:
Crystal City:
16.2% (198)
Texas:
5.5% (322,702)
Number of households with income $20k - 30k:
Crystal City:
3.8% (47)
Texas:
6.2% (363,947)
Number of households with income $30k - 40k:
Crystal City:
21.7% (266)
State:
6.8% (399,275)
Number of households with income $40k - 50k:
Crystal City:
7.2% (88)
State:
6.5% (383,417)
Number of households with income $50k - 60k:
Crystal City:
1.0% (12)
State:
6.6% (388,535)
Number of households with income $60k - 75k:
Crystal City:
15.4% (189)
State:
9.7% (566,295)
Number of households with income $75k - 100k:
Crystal City:
12.0% (147)
State:
13.0% (760,276)
Number of households with income $100k - 125k:
Crystal City:
12.6% (154)
State:
10.2% (597,596)
Number of households with income $125k - 150k:
Crystal City:
1.1% (14)
Texas:
7.4% (436,830)
Number of households with income $150k - 200k:
Crystal City:
2.0% (25)
State:
9.9% (583,067)
Number of households with income > $200k:
Crystal City:
3.7% (45)
State:
13.5% (792,647)
Aggregate household income in Crystal City in 2022: $76,883,605
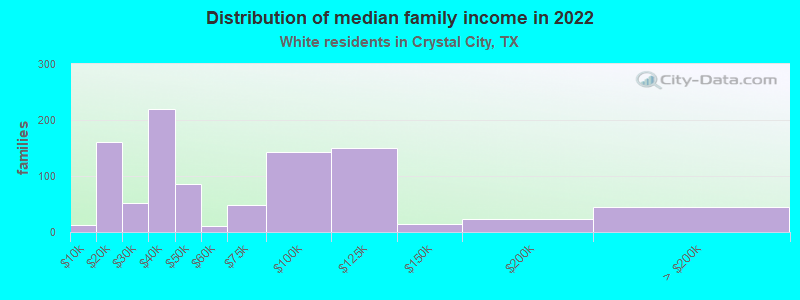
Median family income in Crystal City in 2022:
Crystal City:
$45,401
State:
$101,788
Number of families with income < $10k:
Crystal City:
1.3% (13)
State:
2.8% (108,142)
Number of families with income $10k - 20k:
Crystal City:
16.5% (160)
Texas:
2.9% (113,421)
Number of families with income $20k - 30k:
Crystal City:
5.4% (52)
Texas:
4.1% (157,688)
Number of families with income $30k - 40k:
Crystal City:
22.8% (220)
Texas:
5.2% (198,847)
Number of families with income $40k - 50k:
Crystal City:
9.0% (86)
State:
5.6% (216,490)
Number of families with income $50k - 60k:
Crystal City:
1.1% (11)
Texas:
5.7% (220,689)
Number of families with income $60k - 75k:
Crystal City:
4.9% (48)
Texas:
9.0% (346,106)
Number of families with income $75k - 100k:
Crystal City:
14.8% (143)
State:
13.7% (527,363)
Number of families with income $100k - 125k:
Crystal City:
15.5% (150)
State:
11.6% (448,411)
Number of families with income $125k - 150k:
Crystal City:
1.4% (14)
State:
9.2% (355,798)
Number of families with income $150k - 200k:
Crystal City:
2.5% (24)
State:
12.5% (480,185)
Number of families with income > $200k:
Crystal City:
4.6% (44)
Texas:
17.6% (677,490)
Median non-family income in Crystal City in 2022:
Crystal City:
$12,078
State:
$50,587
Change in median non-family income between 2000 and 2022:
Crystal City, Texas:
+70.3%
Texas:
+87.7%
Median per capita income in Crystal City in 2022:
Crystal City:
$21,774
State:
$47,740
Change in median per capita income between 2000 and 2022:
Crystal City, Texas:
+117.8%
Texas:
+114.3%
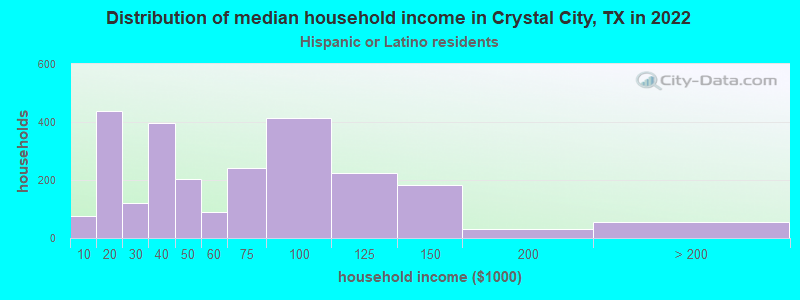
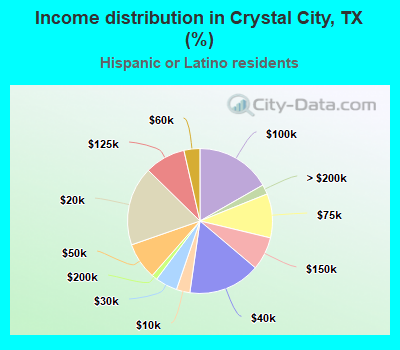
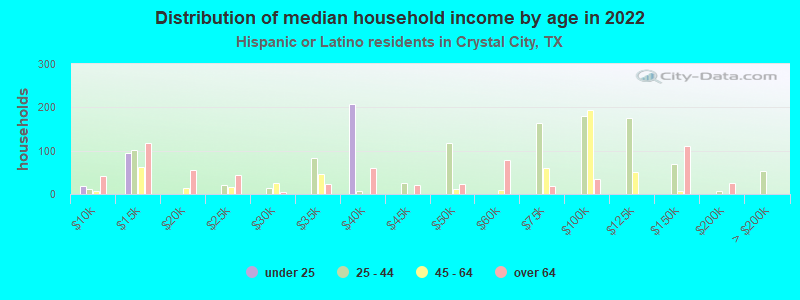
Income statistics for Hispanic or Latino residents
Median household income in Crystal City, TX in 2022:
Crystal City:
$50,335
Texas:
$60,504
Number of households with income < $10k:
Crystal City:
3.0% (75)
Texas:
5.8% (213,953)
Number of households with income $10k - 20k:
Crystal City:
17.7% (437)
State:
8.0% (297,456)
Number of households with income $20k - 30k:
Crystal City:
4.9% (122)
State:
9.2% (340,166)
Number of households with income $30k - 40k:
Crystal City:
16.1% (397)
State:
9.5% (354,336)
Number of households with income $40k - 50k:
Crystal City:
8.2% (203)
State:
8.8% (327,013)
Number of households with income $50k - 60k:
Crystal City:
3.6% (88)
State:
8.3% (308,818)
Number of households with income $60k - 75k:
Crystal City:
9.8% (243)
State:
10.9% (405,109)
Number of households with income $75k - 100k:
Crystal City:
16.7% (414)
State:
13.8% (511,639)
Number of households with income $100k - 125k:
Crystal City:
9.1% (225)
State:
8.6% (319,728)
Number of households with income $125k - 150k:
Crystal City:
7.4% (184)
State:
5.7% (210,932)
Number of households with income $150k - 200k:
Crystal City:
1.3% (31)
Texas:
6.4% (236,055)
Number of households with income > $200k:
Crystal City:
2.2% (54)
Texas:
5.1% (189,259)
Aggregate household income in Crystal City in 2022: $156,281,254
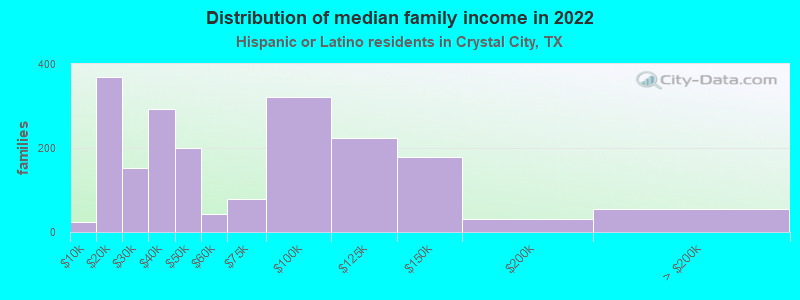
Median family income in Crystal City in 2022:
Crystal City:
$48,658
State:
$65,080
Number of families with income < $10k:
Crystal City:
1.3% (25)
Texas:
5.3% (147,493)
Number of families with income $10k - 20k:
Crystal City:
18.7% (369)
State:
6.3% (174,531)
Number of families with income $20k - 30k:
Crystal City:
7.7% (152)
Texas:
8.6% (238,528)
Number of families with income $30k - 40k:
Crystal City:
14.8% (292)
Texas:
9.1% (251,999)
Number of families with income $40k - 50k:
Crystal City:
10.1% (200)
State:
8.6% (240,188)
Number of families with income $50k - 60k:
Crystal City:
2.2% (42)
State:
8.0% (223,566)
Number of families with income $60k - 75k:
Crystal City:
4.0% (78)
State:
10.9% (302,688)
Number of families with income $75k - 100k:
Crystal City:
16.4% (322)
Texas:
14.3% (398,554)
Number of families with income $100k - 125k:
Crystal City:
11.4% (225)
Texas:
9.5% (264,007)
Number of families with income $125k - 150k:
Crystal City:
9.1% (178)
State:
6.2% (171,274)
Number of families with income $150k - 200k:
Crystal City:
1.6% (31)
State:
7.3% (202,259)
Number of families with income > $200k:
Crystal City:
2.8% (54)
Texas:
5.9% (165,129)
Median non-family income in Crystal City in 2022:
Crystal City:
$16,394
State:
$39,934
Change in median non-family income between 2000 and 2022:
Crystal City, Texas:
+133.3%
Texas:
+109.1%
Median per capita income in Crystal City in 2022:
Crystal City:
$22,050
Texas:
$24,862
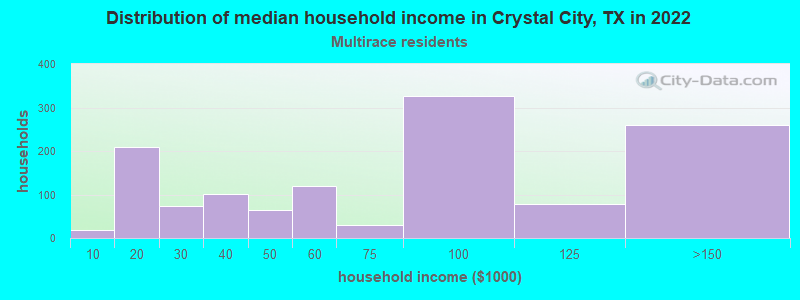
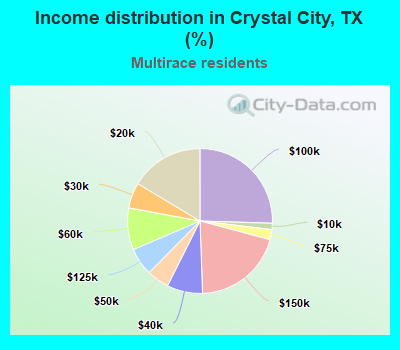
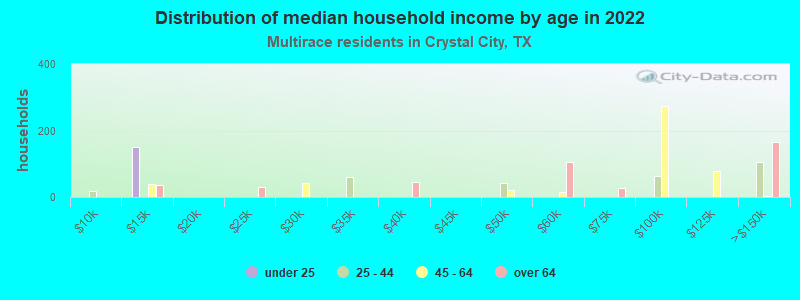
Income statistics for Multirace residents
Median household income in Crystal City, TX in 2022:
Crystal City:
$81,551
State:
$62,748
Number of households with income < $10k:
Crystal City:
1.4% (18)
State:
5.5% (122,324)
Number of households with income $10k - 20k:
Crystal City:
16.4% (210)
State:
8.2% (182,232)
Number of households with income $20k - 30k:
Crystal City:
5.7% (73)
State:
8.5% (189,456)
Number of households with income $30k - 40k:
Crystal City:
8.0% (102)
State:
8.9% (197,499)
Number of households with income $40k - 50k:
Crystal City:
5.0% (64)
State:
8.7% (191,735)
Number of households with income $50k - 60k:
Crystal City:
9.4% (120)
State:
8.0% (177,535)
Number of households with income $60k - 75k:
Crystal City:
2.3% (29)
State:
10.5% (232,479)
Number of households with income $75k - 100k:
Crystal City:
25.5% (327)
State:
13.1% (290,448)
Number of households with income $100k - 125k:
Crystal City:
6.2% (79)
Texas:
8.6% (191,595)
Number of households with income $125k - 150k:
Crystal City:
20.3% (260)
Texas:
6.0% (133,361)
Number of households with income $150k - 200k:
Crystal City:
0.0% (0)
State:
7.2% (159,195)
Number of households with income > $200k:
Crystal City:
0.0% (0)
State:
6.7% (148,064)
Aggregate household income in Crystal City in 2022: $95,104,832
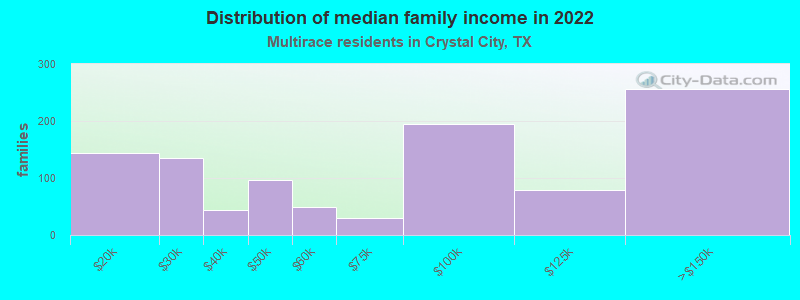
Median family income in Crystal City in 2022:
Crystal City:
$92,706
State:
$69,780
Number of families with income $10k - 20k:
Crystal City:
13.9% (143)
Texas:
5.9% (95,279)
Number of families with income $20k - 30k:
Crystal City:
13.2% (135)
State:
7.8% (126,627)
Number of families with income $30k - 40k:
Crystal City:
4.2% (43)
State:
8.5% (137,626)
Number of families with income $40k - 50k:
Crystal City:
9.4% (97)
State:
8.4% (135,809)
Number of families with income $50k - 60k:
Crystal City:
4.8% (49)
State:
7.9% (127,739)
Number of families with income $60k - 75k:
Crystal City:
2.9% (29)
State:
10.5% (169,549)
Number of families with income $75k - 100k:
Crystal City:
18.9% (194)
State:
14.0% (226,284)
Number of families with income $100k - 125k:
Crystal City:
7.7% (79)
State:
9.5% (153,597)
Number of families with income $125k - 150k:
Crystal City:
25.1% (257)
State:
6.7% (107,900)
Median per capita income in Crystal City in 2022:
Crystal City:
$24,754
State:
$26,785
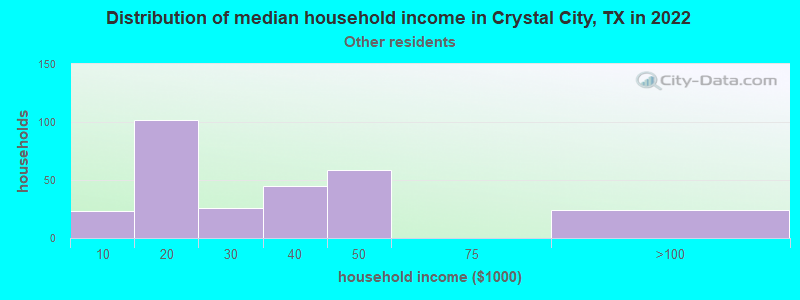
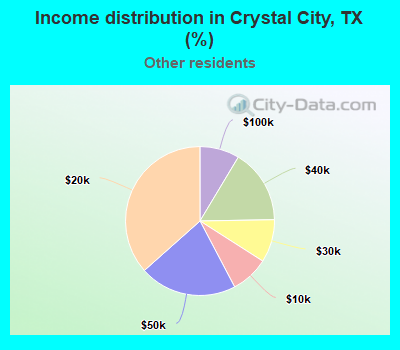
Income statistics for other residents
Median household income in Crystal City, TX in 2022:
Crystal City:
$21,152
State:
$57,114
Number of households with income < $10k:
Crystal City:
8.2% (23)
State:
5.9% (54,162)
Number of households with income $10k - 20k:
Crystal City:
36.6% (102)
Texas:
6.8% (62,891)
Number of households with income $20k - 30k:
Crystal City:
9.3% (26)
State:
10.6% (97,294)
Number of households with income $30k - 40k:
Crystal City:
16.1% (45)
State:
10.8% (99,670)
Number of households with income $40k - 50k:
Crystal City:
21.1% (59)
State:
9.3% (85,548)
Number of households with income $50k - 60k:
Crystal City:
0.0% (0)
State:
9.0% (82,757)
Number of households with income $60k - 75k:
Crystal City:
0.0% (0)
Texas:
10.9% (100,326)
Number of households with income $75k - 100k:
Crystal City:
8.6% (24)
State:
14.0% (128,767)
Number of households with income $100k - 125k:
Crystal City:
0.0% (0)
State:
8.2% (75,218)
Number of households with income $125k - 150k:
Crystal City:
0.0% (0)
State:
4.8% (44,223)
Number of households with income $150k - 200k:
Crystal City:
0.0% (0)
State:
5.6% (51,376)
Number of households with income > $200k:
Crystal City:
0.0% (0)
Texas:
4.0% (36,393)
Aggregate household income in Crystal City in 2022: $8,636,902
Median non-family income in Crystal City in 2022:
Crystal City:
$21,696
State:
$38,690
Median per capita income in Crystal City in 2022:
Crystal City:
$21,788
State:
$23,899
Discuss Crystal City, Texas (TX) on our hugely popular Texas forum.