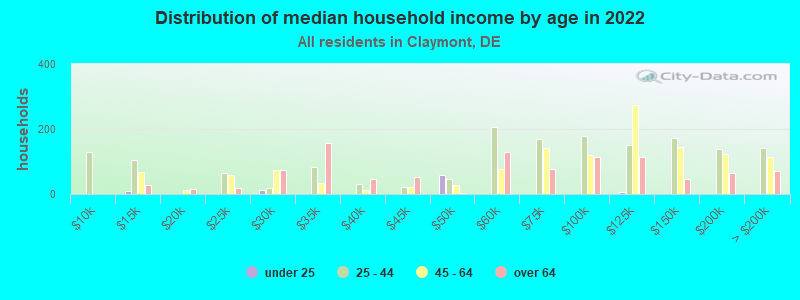
The median household income in Claymont, DE in 2022 was $73,447, which was 11.9% less than the median annual income of $82,174 across the entire state of Delaware. Compared to the median income of $40,813 in 2000 this represents an increase of 44.4%. The per capita income in 2022 was $39,415, which means an increase of 48.7% compared to 2000 when it was $20,211.
Whole page based on the data from 2000 / 2022 when the population of Claymont, Delaware was 9,220 / 10,279
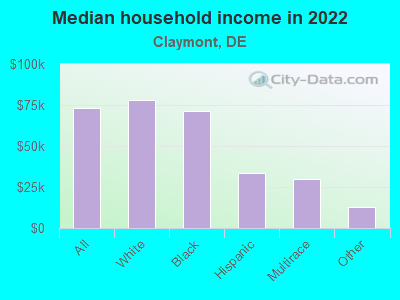
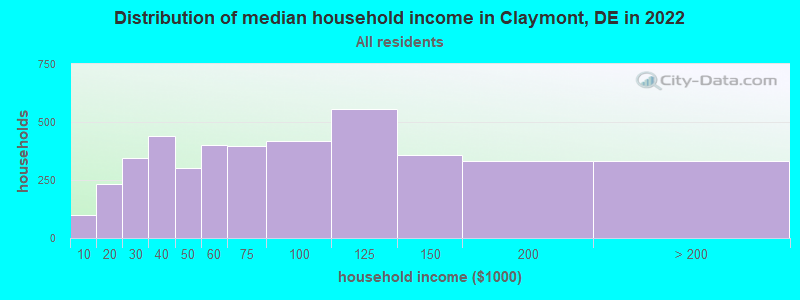
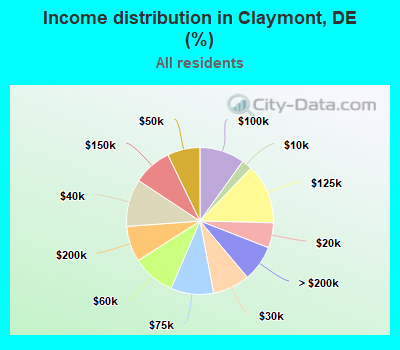
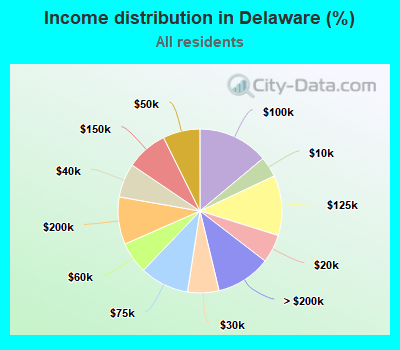
Income statistics for all residents
Median household income in Claymont, DE in 2022:
Claymont:
$73,447
State:
$82,174
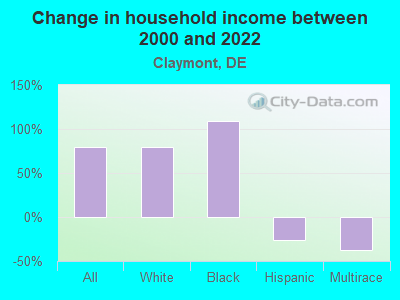
Change in median household income between 2000 and 2022:
Claymont, Delaware:
+80.0%
State:
+73.4%
Number of households with income < $10k:
Claymont:
2.3% (97)
State:
4.0% (16,288)
Number of households with income $10k - 20k:
Claymont:
5.5% (233)
State:
5.6% (22,545)
Number of households with income $20k - 30k:
Claymont:
8.2% (343)
State:
6.2% (24,941)
Number of households with income $30k - 40k:
Claymont:
10.5% (440)
State:
6.7% (27,051)
Number of households with income $40k - 50k:
Claymont:
7.2% (302)
Delaware:
7.3% (29,468)
Number of households with income $50k - 60k:
Claymont:
9.5% (400)
Delaware:
6.3% (25,207)
Number of households with income $60k - 75k:
Claymont:
9.4% (397)
State:
9.7% (38,914)
Number of households with income $75k - 100k:
Claymont:
9.9% (417)
State:
13.9% (56,111)
Number of households with income $100k - 125k:
Claymont:
13.2% (555)
State:
11.8% (47,641)
Number of households with income $125k - 150k:
Claymont:
8.5% (359)
State:
8.2% (32,964)
Number of households with income $150k - 200k:
Claymont:
7.9% (331)
State:
9.4% (37,675)
Number of households with income > $200k:
Claymont:
7.9% (334)
Delaware:
10.8% (43,529)
Aggregate household income in Claymont in 2022: $387,069,559
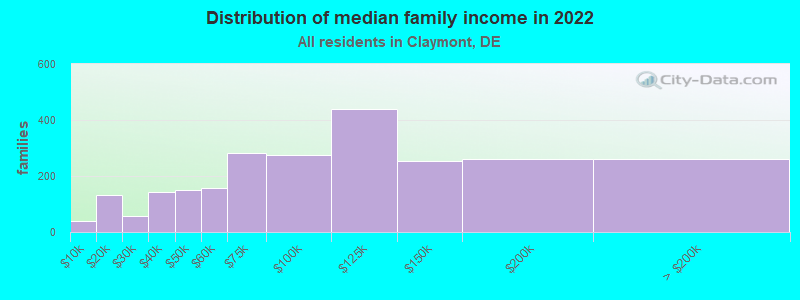
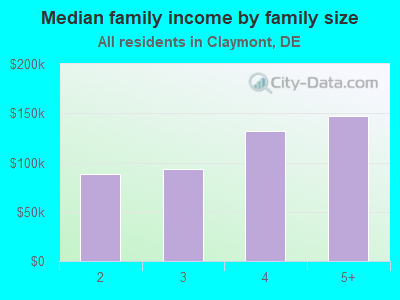
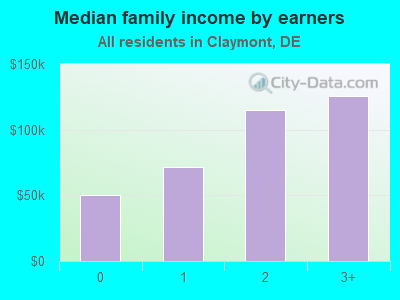
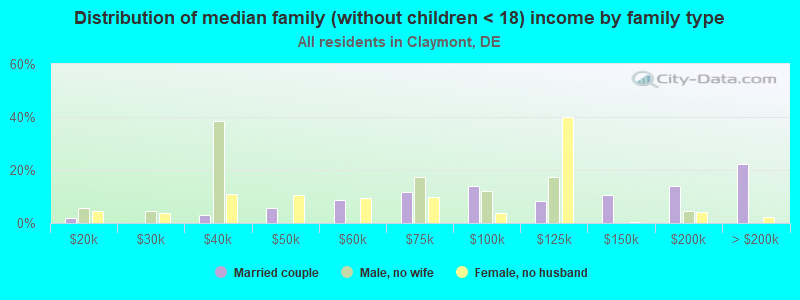
Median family income in Claymont in 2022:
Claymont:
$98,185
State:
$100,128
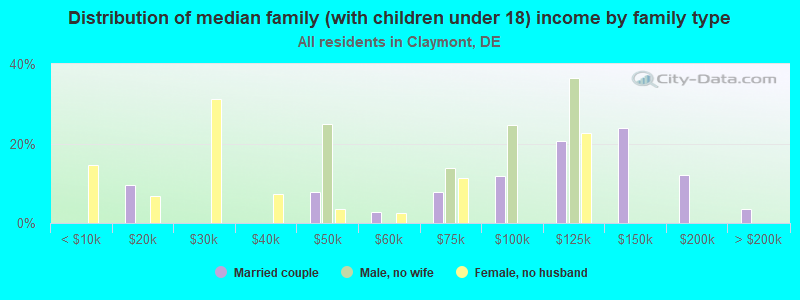
Number of families with income < $10k:
Claymont:
1.6% (38)
State:
2.4% (6,390)
Number of families with income $10k - 20k:
Claymont:
5.4% (133)
State:
3.0% (7,793)
Number of families with income $20k - 30k:
Claymont:
2.3% (56)
State:
3.3% (8,695)
Number of families with income $30k - 40k:
Claymont:
5.8% (142)
Delaware:
4.3% (11,461)
Number of families with income $40k - 50k:
Claymont:
6.2% (151)
Delaware:
6.3% (16,568)
Number of families with income $50k - 60k:
Claymont:
6.4% (157)
Delaware:
6.0% (15,705)
Number of families with income $60k - 75k:
Claymont:
11.5% (282)
Delaware:
9.9% (26,167)
Number of families with income $75k - 100k:
Claymont:
11.2% (274)
State:
14.8% (38,950)
Number of families with income $100k - 125k:
Claymont:
18.0% (441)
Delaware:
14.1% (37,212)
Number of families with income $125k - 150k:
Claymont:
10.3% (252)
State:
9.4% (24,883)
Number of families with income $150k - 200k:
Claymont:
10.6% (260)
State:
12.4% (32,601)
Number of families with income > $200k:
Claymont:
10.6% (261)
Delaware:
14.2% (37,460)
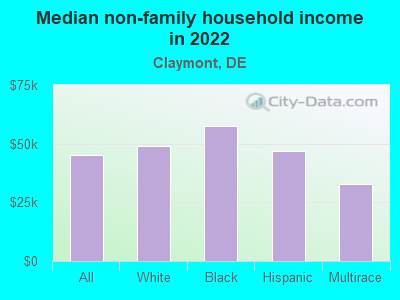
Median non-family income in Claymont in 2022:
Claymont:
$45,038
State:
$46,579
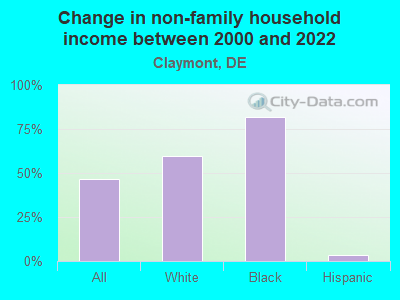
Change in median non-family income between 2000 and 2022:
Claymont, Delaware:
+46.4%
State:
+55.8%
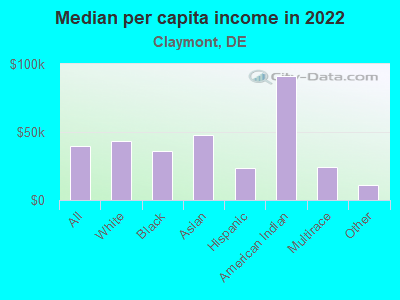
Median per capita income in Claymont in 2022:
Claymont:
$39,416
State:
$42,571
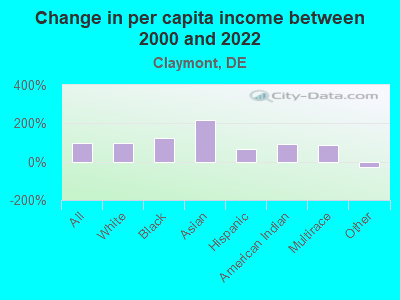
Change in median per capita income between 2000 and 2022:
Claymont, Delaware:
+95.0%
State:
+82.7%
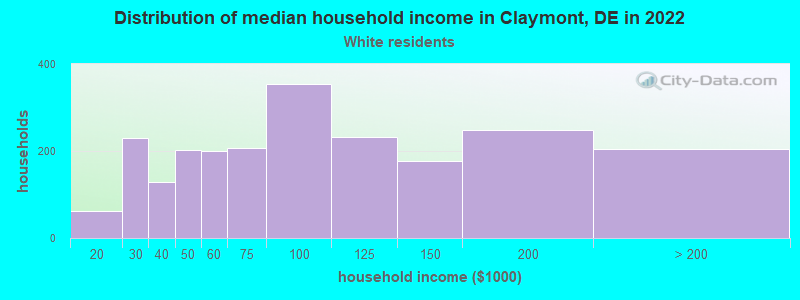
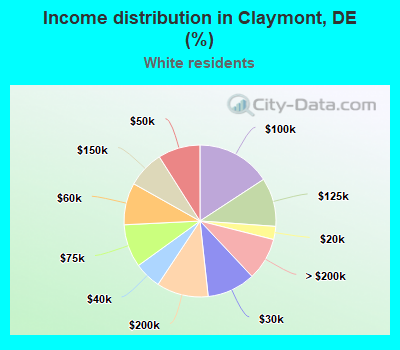
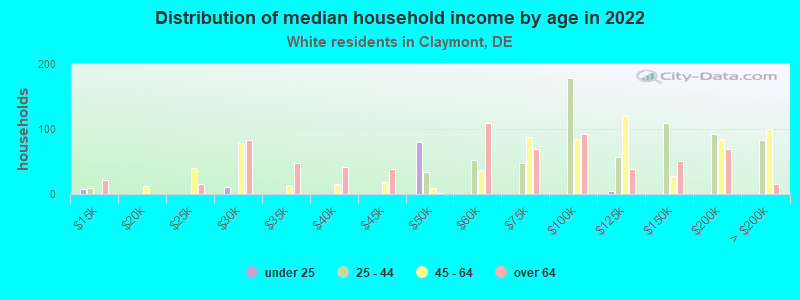
Income statistics for White residents
Median household income in Claymont, DE in 2022:
Claymont:
$77,840
Delaware:
$89,351
Change in median household income between 2000 and 2022:
Claymont, Delaware:
+80.2%
State:
+76.9%
Number of households with income < $10k:
Claymont:
0.0% (0)
Delaware:
3.4% (9,074)
Number of households with income $10k - 20k:
Claymont:
2.8% (63)
State:
4.1% (10,674)
Number of households with income $20k - 30k:
Claymont:
10.3% (231)
Delaware:
5.5% (14,529)
Number of households with income $30k - 40k:
Claymont:
5.7% (129)
Delaware:
5.9% (15,596)
Number of households with income $40k - 50k:
Claymont:
9.0% (202)
State:
6.5% (17,134)
Number of households with income $50k - 60k:
Claymont:
8.9% (201)
Delaware:
6.2% (16,208)
Number of households with income $60k - 75k:
Claymont:
9.2% (206)
State:
9.9% (26,007)
Number of households with income $75k - 100k:
Claymont:
15.8% (355)
State:
14.7% (38,630)
Number of households with income $100k - 125k:
Claymont:
10.4% (233)
State:
12.4% (32,584)
Number of households with income $125k - 150k:
Claymont:
7.9% (177)
State:
9.5% (24,918)
Number of households with income $150k - 200k:
Claymont:
11.0% (248)
State:
10.2% (27,001)
Number of households with income > $200k:
Claymont:
9.1% (204)
State:
11.8% (31,108)
Aggregate household income in Claymont in 2022: $219,752,589
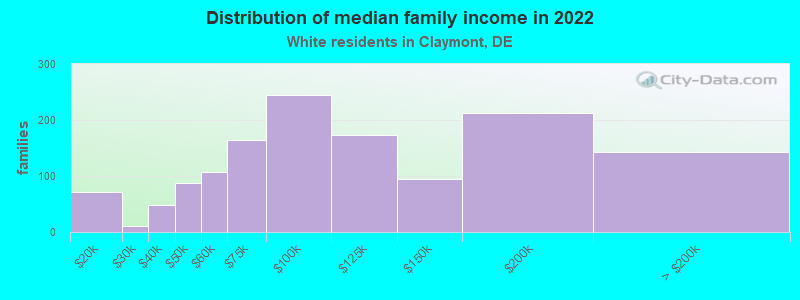
Median family income in Claymont in 2022:
Claymont:
$95,289
Delaware:
$107,254
Number of families with income $10k - 20k:
Claymont:
5.3% (72)
Delaware:
1.9% (3,364)
Number of families with income $20k - 30k:
Claymont:
0.8% (10)
State:
2.1% (3,677)
Number of families with income $30k - 40k:
Claymont:
3.6% (48)
State:
3.4% (5,879)
Number of families with income $40k - 50k:
Claymont:
6.4% (87)
Delaware:
5.0% (8,600)
Number of families with income $50k - 60k:
Claymont:
7.9% (107)
State:
5.6% (9,745)
Number of families with income $60k - 75k:
Claymont:
12.2% (165)
State:
10.0% (17,322)
Number of families with income $75k - 100k:
Claymont:
18.1% (245)
State:
15.9% (27,642)
Number of families with income $100k - 125k:
Claymont:
12.8% (174)
State:
14.4% (25,049)
Number of families with income $125k - 150k:
Claymont:
6.9% (94)
State:
11.0% (19,185)
Number of families with income $150k - 200k:
Claymont:
15.7% (213)
Delaware:
13.4% (23,326)
Number of families with income > $200k:
Claymont:
10.4% (142)
Delaware:
15.6% (27,066)
Median non-family income in Claymont in 2022:
Claymont:
$48,823
State:
$50,472
Change in median non-family income between 2000 and 2022:
Claymont, Delaware:
+59.9%
State:
+62.2%
Median per capita income in Claymont in 2022:
Claymont:
$43,634
State:
$49,694
Change in median per capita income between 2000 and 2022:
Claymont, Delaware:
+97.6%
State:
+94.2%
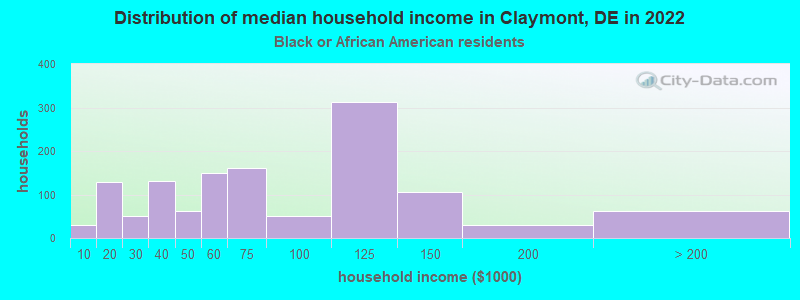
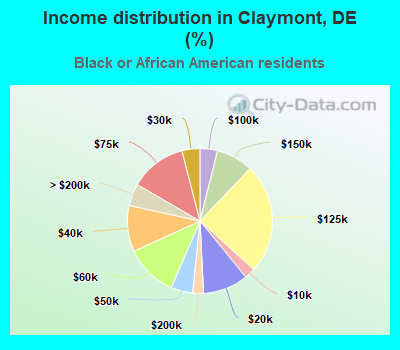
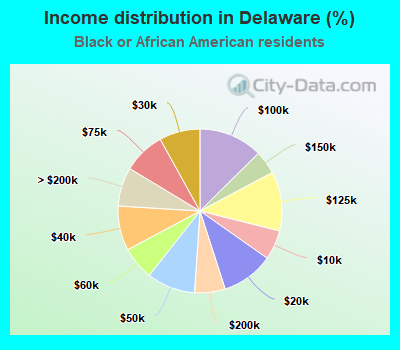
Income statistics for Black or African American residents
Median household income in Claymont, DE in 2022:
Claymont:
$71,242
State:
$61,228
Change in median household income between 2000 and 2022:
Claymont, Delaware:
+108.8%
State:
+72.4%
Number of households with income < $10k:
Claymont:
2.4% (31)
Delaware:
5.8% (4,827)
Number of households with income $10k - 20k:
Claymont:
10.1% (129)
State:
10.3% (8,504)
Number of households with income $20k - 30k:
Claymont:
4.0% (51)
Delaware:
8.0% (6,660)
Number of households with income $30k - 40k:
Claymont:
10.3% (131)
State:
8.8% (7,277)
Number of households with income $40k - 50k:
Claymont:
4.9% (62)
State:
9.6% (7,918)
Number of households with income $50k - 60k:
Claymont:
11.7% (149)
Delaware:
6.6% (5,428)
Number of households with income $60k - 75k:
Claymont:
12.6% (161)
Delaware:
8.3% (6,859)
Number of households with income $75k - 100k:
Claymont:
3.9% (50)
Delaware:
12.6% (10,436)
Number of households with income $100k - 125k:
Claymont:
24.5% (313)
State:
11.7% (9,680)
Number of households with income $125k - 150k:
Claymont:
8.2% (105)
Delaware:
4.6% (3,826)
Number of households with income $150k - 200k:
Claymont:
2.4% (31)
State:
6.0% (4,991)
Number of households with income > $200k:
Claymont:
4.9% (63)
Delaware:
7.7% (6,355)
Aggregate household income in Claymont in 2022: $115,642,073
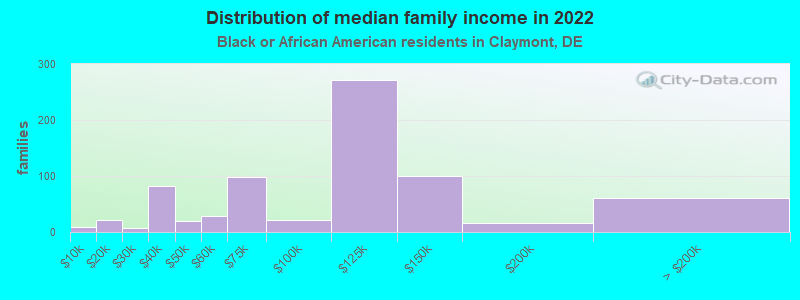
Median family income in Claymont in 2022:
Claymont:
$114,839
State:
$83,261
Number of families with income < $10k:
Claymont:
1.3% (9)
Delaware:
5.3% (2,684)
Number of families with income $10k - 20k:
Claymont:
2.9% (22)
State:
5.7% (2,917)
Number of families with income $20k - 30k:
Claymont:
1.0% (7)
State:
4.7% (2,390)
Number of families with income $30k - 40k:
Claymont:
11.3% (83)
State:
6.0% (3,030)
Number of families with income $40k - 50k:
Claymont:
2.7% (20)
State:
8.5% (4,339)
Number of families with income $50k - 60k:
Claymont:
3.9% (29)
State:
6.7% (3,434)
Number of families with income $60k - 75k:
Claymont:
13.3% (98)
Delaware:
9.8% (4,965)
Number of families with income $75k - 100k:
Claymont:
3.0% (22)
Delaware:
12.4% (6,312)
Number of families with income $100k - 125k:
Claymont:
36.8% (272)
State:
16.0% (8,129)
Number of families with income $125k - 150k:
Claymont:
13.5% (100)
State:
5.8% (2,928)
Number of families with income $150k - 200k:
Claymont:
2.2% (16)
State:
8.5% (4,350)
Number of families with income > $200k:
Claymont:
8.1% (60)
State:
10.6% (5,413)
Median non-family income in Claymont in 2022:
Claymont:
$57,585
State:
$36,936
Change in median non-family income between 2000 and 2022:
Claymont, Delaware:
+81.8%
Delaware:
+62.8%
Median per capita income in Claymont in 2022:
Claymont:
$36,146
Delaware:
$32,135
Change in median per capita income between 2000 and 2022:
Claymont, Delaware:
+122.6%
State:
+98.7%
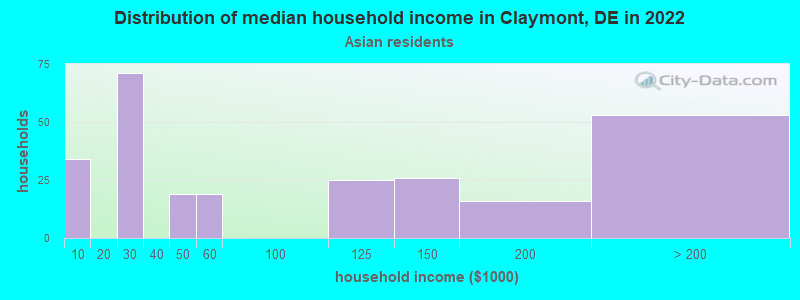
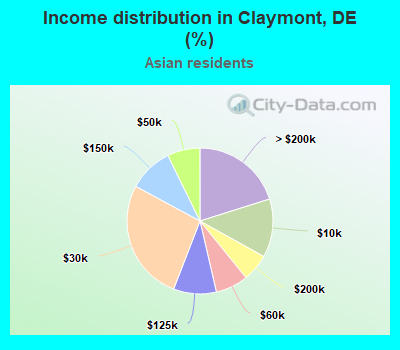
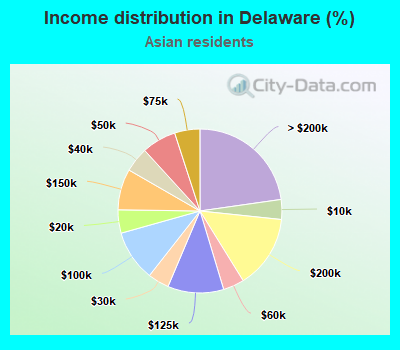
Income statistics for Asian residents
Number of households with income < $10k:
Claymont:
12.9% (34)
Delaware:
3.9% (588)
Number of households with income $10k - 20k:
Claymont:
0.0% (0)
State:
4.6% (693)
Number of households with income $20k - 30k:
Claymont:
27.0% (71)
State:
4.2% (632)
Number of households with income $30k - 40k:
Claymont:
0.0% (0)
Delaware:
4.9% (738)
Number of households with income $40k - 50k:
Claymont:
7.2% (19)
Delaware:
6.8% (1,021)
Number of households with income $50k - 60k:
Claymont:
7.2% (19)
Delaware:
4.1% (624)
Number of households with income $60k - 75k:
Claymont:
0.0% (0)
Delaware:
5.0% (751)
Number of households with income $75k - 100k:
Claymont:
0.0% (0)
State:
10.1% (1,514)
Number of households with income $100k - 125k:
Claymont:
9.5% (25)
State:
11.1% (1,664)
Number of households with income $125k - 150k:
Claymont:
9.9% (26)
Delaware:
8.1% (1,217)
Number of households with income $150k - 200k:
Claymont:
6.1% (16)
State:
14.5% (2,187)
Number of households with income > $200k:
Claymont:
20.2% (53)
State:
22.8% (3,427)
Aggregate household income in Claymont in 2022: $25,520,512
Median per capita income in Claymont in 2022:
Claymont:
$47,950
State:
$51,124
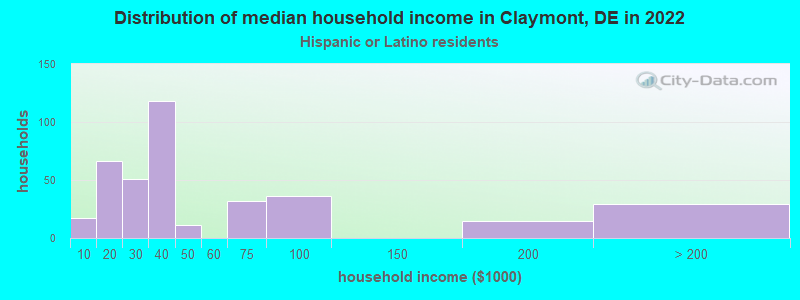
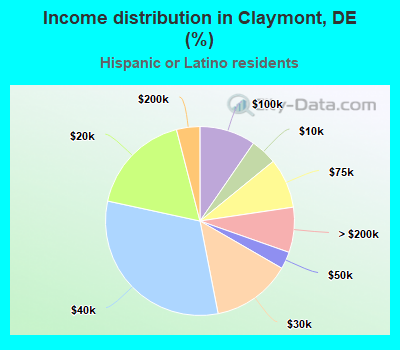
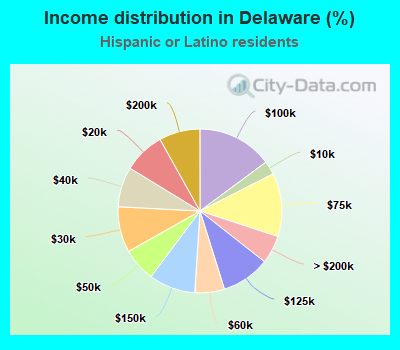
Income statistics for Hispanic or Latino residents
Median household income in Claymont, DE in 2022:
Claymont:
$33,690
State:
$71,733
Change in median household income between 2000 and 2022:: -26.2%
Claymont, Delaware:
-26.2%
Delaware:
+97.7%
Number of households with income < $10k:
Claymont:
4.5% (17)
Delaware:
2.7% (797)
Number of households with income $10k - 20k:
Claymont:
17.6% (66)
State:
8.2% (2,421)
Number of households with income $20k - 30k:
Claymont:
13.6% (51)
Delaware:
9.0% (2,672)
Number of households with income $30k - 40k:
Claymont:
31.5% (118)
Delaware:
7.9% (2,345)
Number of households with income $40k - 50k:
Claymont:
2.9% (11)
Delaware:
6.6% (1,962)
Number of households with income $50k - 60k:
Claymont:
0.0% (0)
State:
5.9% (1,735)
Number of households with income $60k - 75k:
Claymont:
8.5% (32)
Delaware:
12.5% (3,709)
Number of households with income $75k - 100k:
Claymont:
9.6% (36)
State:
14.8% (4,403)
Number of households with income $100k - 125k:
Claymont:
0.0% (0)
Delaware:
9.6% (2,833)
Number of households with income $125k - 150k:
Claymont:
0.0% (0)
State:
9.2% (2,723)
Number of households with income $150k - 200k:
Claymont:
4.0% (15)
State:
8.1% (2,398)
Number of households with income > $200k:
Claymont:
7.7% (29)
Delaware:
5.6% (1,653)
Aggregate household income in Claymont in 2022: $19,551,896
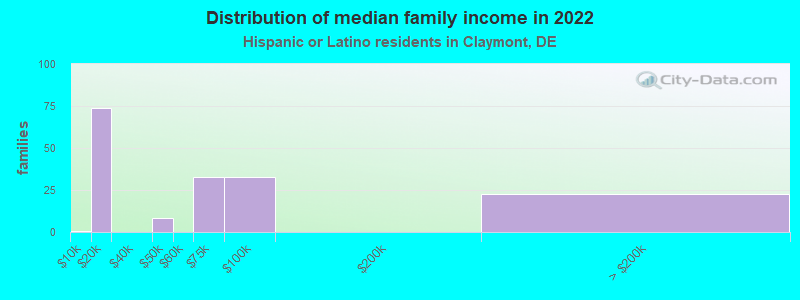
Median family income in Claymont in 2022:
Claymont:
$73,931
State:
$71,093
Number of families with income < $10k:
Claymont:
0.5% (1)
State:
2.5% (560)
Number of families with income $10k - 20k:
Claymont:
43.1% (74)
State:
6.3% (1,436)
Number of families with income $40k - 50k:
Claymont:
5.0% (9)
State:
10.6% (2,398)
Number of families with income $60k - 75k:
Claymont:
19.2% (33)
State:
12.2% (2,780)
Number of families with income $75k - 100k:
Claymont:
19.2% (33)
Delaware:
12.4% (2,809)
Number of families with income > $200k:
Claymont:
13.1% (23)
State:
4.9% (1,113)
Median non-family income in Claymont in 2022:
Claymont:
$46,778
State:
$46,692
Change in median non-family income between 2000 and 2022:
Claymont, Delaware:
+3.5%
State:
+81.9%
Median per capita income in Claymont in 2022:
Claymont:
$23,250
Delaware:
$25,402
Change in median per capita income between 2000 and 2022:
Claymont, Delaware:
+65.4%
State:
+98.7%
Income statistics for American Indian and Alaska Native residents
Median per capita income in Claymont in 2022:
Claymont:
$91,544
State:
$31,308
Change in median per capita income between 2000 and 2022:
Claymont, Delaware:
+92.5%
Delaware:
+87.7%
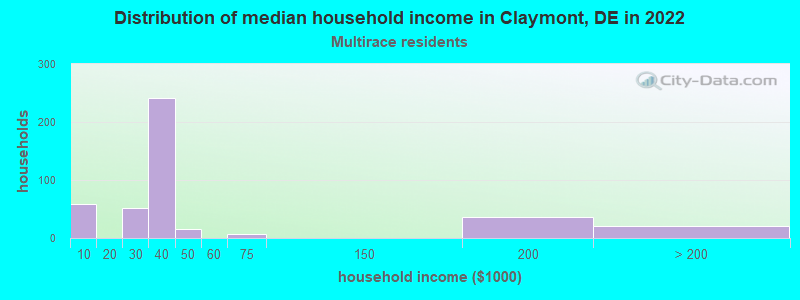
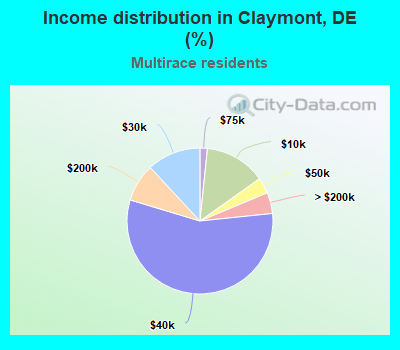
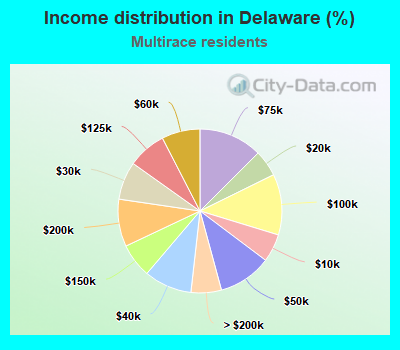
Income statistics for Multirace residents
Median household income in Claymont, DE in 2022:
Claymont:
$29,925
State:
$62,559
Change in median household income between 2000 and 2022:: -36.7%
Claymont, Delaware:
-36.7%
State:
+60.7%
Number of households with income < $10k:
Claymont:
13.6% (58)
Delaware:
5.6% (1,606)
Number of households with income $10k - 20k:
Claymont:
0.0% (0)
Delaware:
5.2% (1,507)
Number of households with income $20k - 30k:
Claymont:
11.9% (51)
State:
7.5% (2,173)
Number of households with income $30k - 40k:
Claymont:
56.3% (241)
State:
9.4% (2,728)
Number of households with income $40k - 50k:
Claymont:
3.5% (15)
State:
10.5% (3,041)
Number of households with income $50k - 60k:
Claymont:
0.0% (0)
State:
7.6% (2,189)
Number of households with income $60k - 75k:
Claymont:
1.6% (7)
State:
12.5% (3,623)
Number of households with income $75k - 100k:
Claymont:
0.0% (0)
Delaware:
12.0% (3,469)
Number of households with income $100k - 125k:
Claymont:
0.0% (0)
State:
7.6% (2,197)
Number of households with income $125k - 150k:
Claymont:
0.0% (0)
State:
6.8% (1,954)
Number of households with income $150k - 200k:
Claymont:
8.4% (36)
State:
9.4% (2,708)
Number of households with income > $200k:
Claymont:
4.7% (20)
State:
6.0% (1,737)
Aggregate household income in Claymont in 2022: $21,477,377
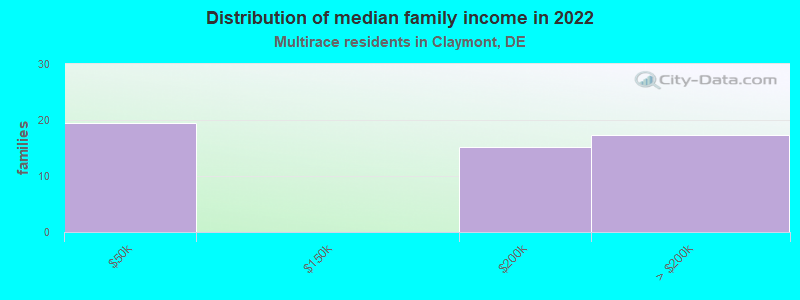
Median family income in Claymont in 2022:
Claymont:
$182,120
Delaware:
$72,735
Number of families with income $40k - 50k:
Claymont:
37.6% (20)
State:
14.3% (2,698)
Number of families with income $150k - 200k:
Claymont:
29.2% (15)
Delaware:
12.8% (2,427)
Number of families with income > $200k:
Claymont:
33.2% (17)
State:
6.2% (1,174)
Median non-family income in Claymont in 2022:
Claymont:
$32,610
Delaware:
$41,069
Change in median non-family income between 2000 and 2022:: -0.4%
Claymont, Delaware:
-0.4%
State:
+52.5%
Median per capita income in Claymont in 2022:
Claymont:
$24,563
State:
$25,790
Change in median per capita income between 2000 and 2022:
Claymont, Delaware:
+87.5%
State:
+107.7%
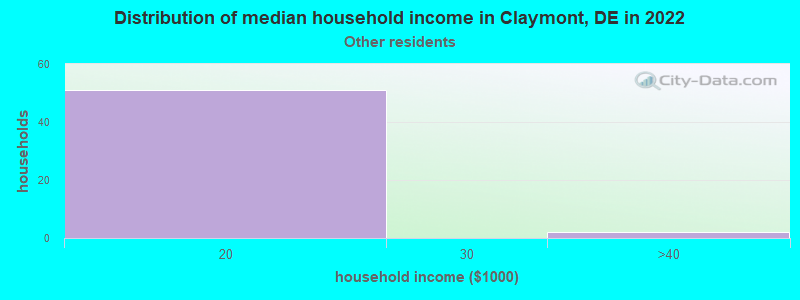
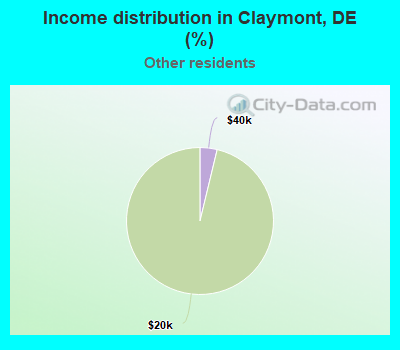
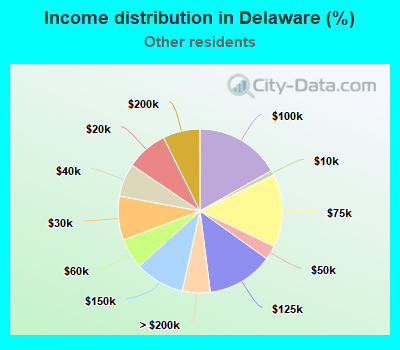
Income statistics for other residents
Median household income in Claymont, DE in 2022:
Claymont:
$13,069
Delaware:
$76,255
Number of households with income < $10k:
Claymont:
0.0% (0)
State:
1.0% (102)
Number of households with income $10k - 20k:
Claymont:
96.2% (51)
State:
8.2% (879)
Number of households with income $20k - 30k:
Claymont:
0.0% (0)
Delaware:
8.7% (928)
Number of households with income $30k - 40k:
Claymont:
3.8% (2)
State:
6.5% (700)
Number of households with income $40k - 50k:
Claymont:
0.0% (0)
Delaware:
2.8% (299)
Number of households with income $50k - 60k:
Claymont:
0.0% (0)
State:
5.9% (635)
Number of households with income $60k - 75k:
Claymont:
0.0% (0)
State:
14.3% (1,531)
Number of households with income $75k - 100k:
Claymont:
0.0% (0)
State:
16.8% (1,800)
Number of households with income $100k - 125k:
Claymont:
0.0% (0)
State:
13.1% (1,399)
Number of households with income $125k - 150k:
Claymont:
0.0% (0)
State:
9.8% (1,049)
Number of households with income $150k - 200k:
Claymont:
0.0% (0)
State:
7.3% (783)
Number of households with income > $200k:
Claymont:
0.0% (0)
Delaware:
5.5% (589)
Aggregate household income in Claymont in 2022: $751,134
Median per capita income in Claymont in 2022:
Claymont:
$10,741
Delaware:
$25,892
Change in median per capita income between 2000 and 2022:: -29.9%
Claymont, Delaware:
-29.9%
Delaware:
+110.3%
Discuss Claymont, Delaware (DE) on our hugely popular Delaware forum.