The median household income in Clallam Bay, WA in 2022 was $45,342, which was 101.4% less than the median annual income of $91,306 across the entire state of Washington. Compared to the median income of $36,449 in 2000 this represents an increase of 19.6%. The per capita income in 2022 was $24,846, which means an increase of 21.4% compared to 2000 when it was $19,517.
Whole page based on the data from 2000 / 2022 when the population of Clallam Bay, Washington was 363 / 738
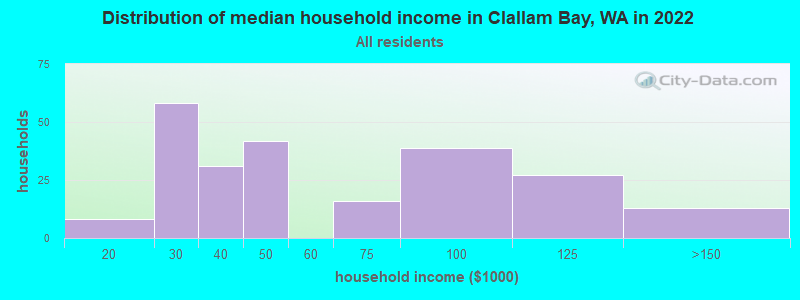
Income statistics for all residents
Median household income in Clallam Bay, WA in 2022:
Clallam Bay:
$45,342
Washington:
$91,306
Change in median household income between 2000 and 2022:
Clallam Bay, Washington:
+24.4%
State:
+99.5%
Number of households with income < $10k:
Clallam Bay:
0.0% (0)
Washington:
4.5% (139,331)
Number of households with income $10k - 20k:
Clallam Bay:
3.4% (8)
State:
5.0% (154,508)
Number of households with income $20k - 30k:
Clallam Bay:
24.8% (58)
State:
5.4% (166,555)
Number of households with income $30k - 40k:
Clallam Bay:
13.2% (31)
State:
5.5% (170,324)
Number of households with income $40k - 50k:
Clallam Bay:
17.9% (42)
State:
6.0% (183,941)
Number of households with income $50k - 60k:
Clallam Bay:
0.0% (0)
State:
6.1% (187,395)
Number of households with income $60k - 75k:
Clallam Bay:
6.8% (16)
State:
8.7% (266,771)
Number of households with income $75k - 100k:
Clallam Bay:
16.7% (39)
Washington:
13.1% (404,672)
Number of households with income $100k - 125k:
Clallam Bay:
11.5% (27)
State:
11.0% (337,911)
Number of households with income $125k - 150k:
Clallam Bay:
5.6% (13)
State:
8.0% (244,934)
Number of households with income $150k - 200k:
Clallam Bay:
0.0% (0)
State:
10.5% (323,812)
Number of households with income > $200k:
Clallam Bay:
0.0% (0)
State:
16.2% (499,799)
Aggregate household income in Clallam Bay in 2022: $15,896,712
Median family income in Clallam Bay in 2022:
Clallam Bay:
$48,702
State:
$109,192
Number of families with income $10k - 20k:
Clallam Bay:
5.9% (7)
State:
2.6% (50,138)
Number of families with income $20k - 30k:
Clallam Bay:
11.6% (14)
Washington:
3.2% (61,974)
Number of families with income $30k - 40k:
Clallam Bay:
35.1% (42)
Washington:
4.1% (80,240)
Number of families with income $40k - 50k:
Clallam Bay:
18.6% (22)
State:
4.9% (94,310)
Number of families with income $75k - 100k:
Clallam Bay:
17.1% (21)
Washington:
13.8% (267,812)
Number of families with income $100k - 125k:
Clallam Bay:
11.5% (14)
State:
12.4% (240,213)
Median income for 2 person families:
Clallam Bay:
$32,878
State:
$96,815
Median income for families with 0 earners:
Clallam Bay:
$0
State:
$60,470
Median income for families with 1 earner:
Clallam Bay:
$31,753
State:
$83,136
Median income for families with 2 earners:
Clallam Bay:
$0
State:
$135,539
Median income for families with 3+ earners:
Clallam Bay:
$0
Washington:
$163,538
Median per capita income in Clallam Bay in 2022:
Clallam Bay:
$24,846
State:
$50,764
Change in median per capita income between 2000 and 2022:
Clallam Bay, Washington:
+27.3%
State:
+121.0%
Income statistics for White residents
Median household income in Clallam Bay, WA in 2022:
Clallam Bay:
$44,242
State:
$91,916
Change in median household income between 2000 and 2022:
Clallam Bay, Washington:
+19.7%
State:
+95.4%
Number of households with income < $10k:
Clallam Bay:
0.0% (0)
State:
4.3% (95,850)
Number of households with income $10k - 20k:
Clallam Bay:
6.1% (9)
State:
4.8% (106,421)
Number of households with income $20k - 30k:
Clallam Bay:
29.9% (44)
State:
5.5% (122,860)
Number of households with income $30k - 40k:
Clallam Bay:
0.0% (0)
Washington:
5.4% (119,627)
Number of households with income $40k - 50k:
Clallam Bay:
28.6% (42)
State:
5.9% (132,276)
Number of households with income $50k - 60k:
Clallam Bay:
0.0% (0)
State:
6.1% (136,212)
Number of households with income $60k - 75k:
Clallam Bay:
9.5% (14)
State:
8.8% (196,086)
Number of households with income $75k - 100k:
Clallam Bay:
17.0% (25)
State:
13.4% (299,192)
Number of households with income $100k - 125k:
Clallam Bay:
8.8% (13)
State:
11.3% (252,209)
Number of households with income $125k - 150k:
Clallam Bay:
0.0% (0)
State:
7.9% (175,962)
Number of households with income $150k - 200k:
Clallam Bay:
0.0% (0)
Washington:
10.7% (239,156)
Number of households with income > $200k:
Clallam Bay:
0.0% (0)
State:
16.1% (359,917)
Aggregate household income in Clallam Bay in 2022: $9,072,457
Median per capita income in Clallam Bay in 2022:
Clallam Bay:
$24,105
State:
$55,212
Change in median per capita income between 2000 and 2022:
Clallam Bay, Washington:
+17.9%
State:
+123.8%
Income statistics for Asian residents
Median per capita income in Clallam Bay in 2022:
Clallam Bay:
$7,663
State:
$67,666
Change in median per capita income between 2000 and 2022:: -57.6%
Clallam Bay, Washington:
-57.6%
State:
+236.0%
Income statistics for Hispanic or Latino residents
Number of households with income < $10k:
Clallam Bay:
0.0% (0)
Washington:
4.9% (14,456)
Number of households with income $10k - 20k:
Clallam Bay:
0.0% (0)
State:
5.3% (15,449)
Number of households with income $20k - 30k:
Clallam Bay:
0.0% (0)
Washington:
6.8% (20,016)
Number of households with income $30k - 40k:
Clallam Bay:
65.9% (29)
Washington:
7.7% (22,548)
Number of households with income $40k - 50k:
Clallam Bay:
0.0% (0)
State:
7.3% (21,450)
Number of households with income $50k - 60k:
Clallam Bay:
0.0% (0)
Washington:
7.7% (22,744)
Number of households with income $60k - 75k:
Clallam Bay:
0.0% (0)
State:
10.5% (30,737)
Number of households with income $75k - 100k:
Clallam Bay:
34.1% (15)
State:
14.9% (43,843)
Number of households with income $100k - 125k:
Clallam Bay:
0.0% (0)
State:
11.1% (32,554)
Number of households with income $125k - 150k:
Clallam Bay:
0.0% (0)
State:
7.4% (21,624)
Number of households with income $150k - 200k:
Clallam Bay:
0.0% (0)
State:
7.3% (21,360)
Number of households with income > $200k:
Clallam Bay:
0.0% (0)
State:
9.2% (27,055)
Aggregate household income in Clallam Bay in 2022: $174,641,400
Median per capita income in Clallam Bay in 2022:
Clallam Bay:
$21,914
State:
$28,252
Change in median per capita income between 2000 and 2022:
Clallam Bay, Washington:
+128.4%
State:
+150.2%
Income statistics for American Indian and Alaska Native residents
Number of households with income < $10k:
Clallam Bay:
0.0% (0)
State:
5.9% (1,768)
Number of households with income $10k - 20k:
Clallam Bay:
0.0% (0)
Washington:
8.9% (2,694)
Number of households with income $20k - 30k:
Clallam Bay:
0.0% (0)
State:
8.0% (2,412)
Number of households with income $30k - 40k:
Clallam Bay:
0.0% (0)
State:
7.7% (2,327)
Number of households with income $40k - 50k:
Clallam Bay:
0.0% (0)
State:
5.8% (1,755)
Number of households with income $50k - 60k:
Clallam Bay:
0.0% (0)
State:
7.5% (2,259)
Number of households with income $60k - 75k:
Clallam Bay:
0.0% (0)
State:
8.8% (2,669)
Number of households with income $75k - 100k:
Clallam Bay:
0.0% (0)
State:
12.8% (3,861)
Number of households with income $100k - 125k:
Clallam Bay:
56.2% (18)
State:
12.0% (3,618)
Number of households with income $125k - 150k:
Clallam Bay:
43.8% (14)
State:
8.6% (2,580)
Number of households with income $150k - 200k:
Clallam Bay:
0.0% (0)
State:
5.9% (1,774)
Number of households with income > $200k:
Clallam Bay:
0.0% (0)
State:
8.1% (2,447)
Aggregate household income in Clallam Bay in 2022: $6,815,269
Median per capita income in Clallam Bay in 2022:
Clallam Bay:
$34,694
State:
$27,053
Income statistics for Multirace residents
Number of households with income < $10k:
Clallam Bay:
0.0% (0)
State:
4.3% (12,040)
Number of households with income $10k - 20k:
Clallam Bay:
0.0% (0)
State:
6.6% (18,437)
Number of households with income $20k - 30k:
Clallam Bay:
35.6% (26)
State:
5.2% (14,559)
Number of households with income $30k - 40k:
Clallam Bay:
64.4% (47)
Washington:
6.7% (18,491)
Number of households with income $40k - 50k:
Clallam Bay:
0.0% (0)
State:
6.3% (17,459)
Number of households with income $50k - 60k:
Clallam Bay:
0.0% (0)
State:
6.9% (19,086)
Number of households with income $60k - 75k:
Clallam Bay:
0.0% (0)
State:
9.1% (25,310)
Number of households with income $75k - 100k:
Clallam Bay:
0.0% (0)
State:
13.5% (37,493)
Number of households with income $100k - 125k:
Clallam Bay:
0.0% (0)
State:
10.7% (29,626)
Number of households with income $125k - 150k:
Clallam Bay:
0.0% (0)
State:
8.6% (23,899)
Number of households with income $150k - 200k:
Clallam Bay:
0.0% (0)
State:
10.2% (28,214)
Number of households with income > $200k:
Clallam Bay:
0.0% (0)
State:
11.9% (32,947)
Aggregate household income in Clallam Bay in 2022: $222,020,400
Median per capita income in Clallam Bay in 2022:
Clallam Bay:
$21,879
State:
$32,496
Change in median per capita income between 2000 and 2022:
Clallam Bay, Washington:
+110.2%
Washington:
+156.8%
Income statistics for other residents
Number of households with income < $10k:
Clallam Bay:
0.0% (0)
State:
5.3% (6,540)
Number of households with income $10k - 20k:
Clallam Bay:
0.0% (0)
State:
6.0% (7,385)
Number of households with income $20k - 30k:
Clallam Bay:
0.0% (0)
State:
7.5% (9,289)
Number of households with income $30k - 40k:
Clallam Bay:
0.0% (0)
Washington:
8.9% (11,015)
Number of households with income $40k - 50k:
Clallam Bay:
0.0% (0)
State:
7.6% (9,399)
Number of households with income $50k - 60k:
Clallam Bay:
0.0% (0)
State:
7.2% (8,867)
Number of households with income $60k - 75k:
Clallam Bay:
0.0% (0)
State:
10.5% (13,032)
Number of households with income $75k - 100k:
Clallam Bay:
100.0% (15)
Washington:
14.6% (18,007)
Number of households with income $100k - 125k:
Clallam Bay:
0.0% (0)
State:
12.2% (15,128)
Number of households with income $125k - 150k:
Clallam Bay:
0.0% (0)
Washington:
5.6% (6,950)
Number of households with income $150k - 200k:
Clallam Bay:
0.0% (0)
State:
7.1% (8,749)
Number of households with income > $200k:
Clallam Bay:
0.0% (0)
State:
7.5% (9,208)
Aggregate household income in Clallam Bay in 2022: $96,471,500
Median per capita income in Clallam Bay in 2022:
Clallam Bay:
$345
State:
$27,542
Discuss Clallam Bay, Washington (WA) on our hugely popular Washington forum.