The median household income in Chincoteague, VA in 2022 was $45,588, which was 88.4% less than the median annual income of $85,873 across the entire state of Virginia. Compared to the median income of $28,514 in 2000 this represents an increase of 37.5%. The per capita income in 2022 was $40,963, which means an increase of 50.3% compared to 2000 when it was $20,367.
Whole page based on the data from 2000 / 2022 when the population of Chincoteague, Virginia was 4,317 / 3,326
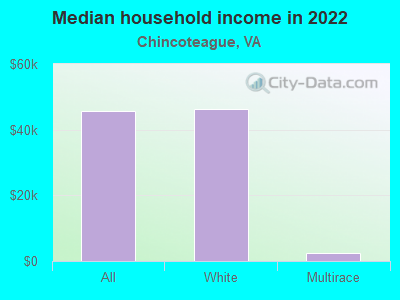
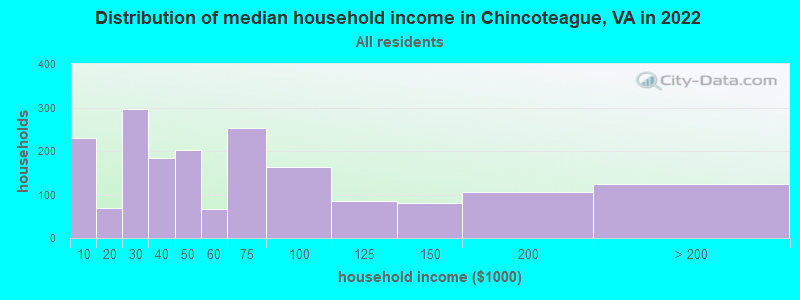
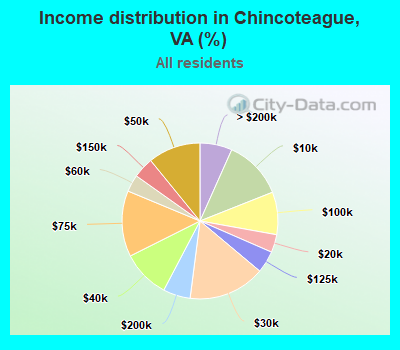
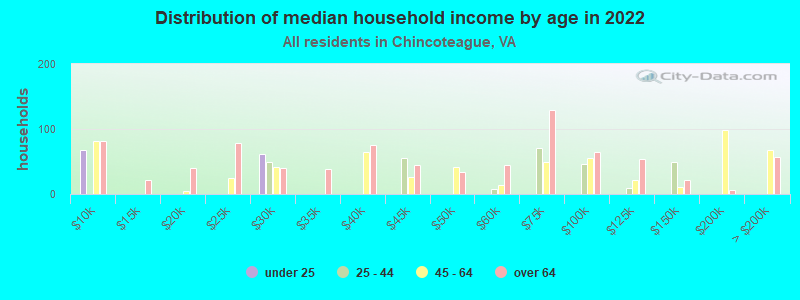
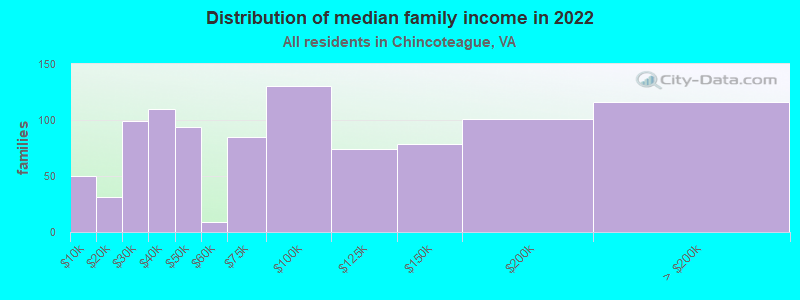
Income statistics for all residents
Median household income in Chincoteague, VA in 2022:
Chincoteague:
$45,589
Virginia:
$85,873
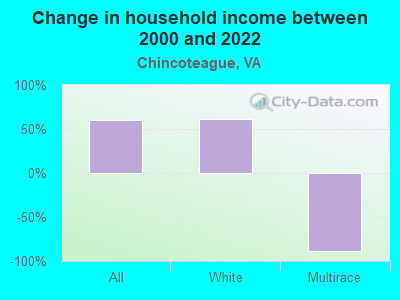
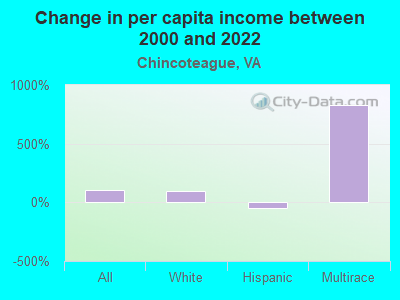
Change in median household income between 2000 and 2022:
Chincoteague, Virginia:
+59.9%
State:
+84.0%
Number of households with income < $10k:
Chincoteague:
12.3% (229)
State:
4.9% (165,315)
Number of households with income $10k - 20k:
Chincoteague:
3.7% (69)
State:
5.9% (199,380)
Number of households with income $20k - 30k:
Chincoteague:
15.9% (296)
Virginia:
6.0% (202,243)
Number of households with income $30k - 40k:
Chincoteague:
9.9% (184)
State:
6.1% (205,967)
Number of households with income $40k - 50k:
Chincoteague:
10.9% (202)
State:
6.4% (215,648)
Number of households with income $50k - 60k:
Chincoteague:
3.6% (66)
Virginia:
6.2% (210,516)
Number of households with income $60k - 75k:
Chincoteague:
13.7% (254)
State:
8.6% (292,112)
Number of households with income $75k - 100k:
Chincoteague:
8.8% (164)
Virginia:
12.2% (412,198)
Number of households with income $100k - 125k:
Chincoteague:
4.6% (85)
State:
10.3% (348,998)
Number of households with income $125k - 150k:
Chincoteague:
4.3% (80)
State:
7.7% (261,236)
Number of households with income $150k - 200k:
Chincoteague:
5.7% (105)
State:
10.3% (347,282)
Number of households with income > $200k:
Chincoteague:
6.7% (124)
State:
15.4% (519,712)
Aggregate household income in Chincoteague in 2022: $140,962,076
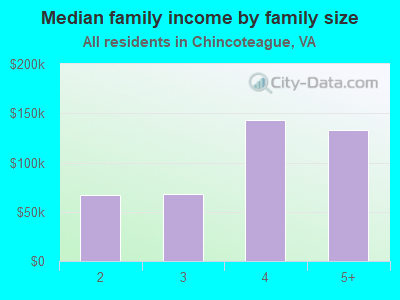
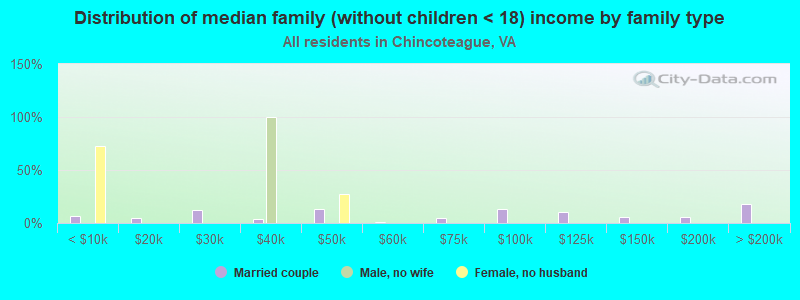
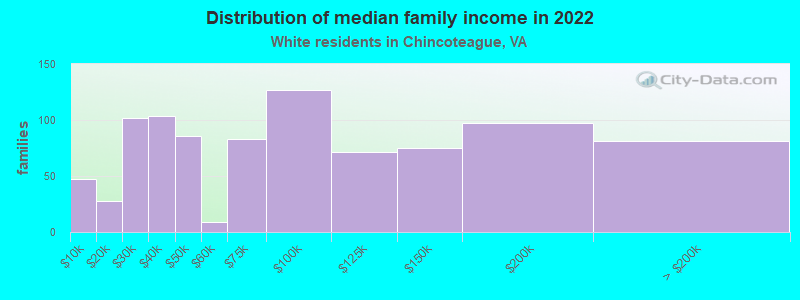
Median family income in Chincoteague in 2022:
Chincoteague:
$81,958
State:
$107,101
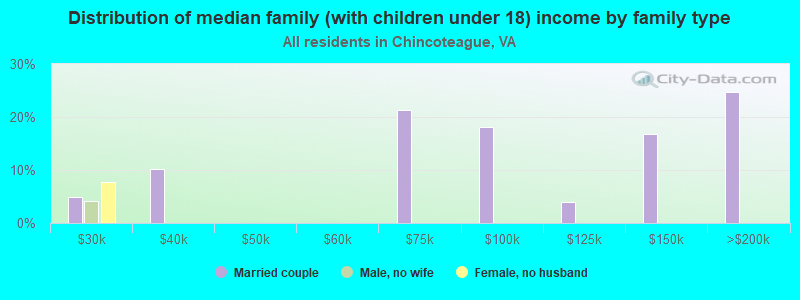
Number of families with income < $10k:
Chincoteague:
5.1% (50)
State:
2.8% (61,637)
Number of families with income $10k - 20k:
Chincoteague:
3.1% (31)
Virginia:
3.3% (71,807)
Number of families with income $20k - 30k:
Chincoteague:
10.2% (99)
Virginia:
4.0% (87,860)
Number of families with income $30k - 40k:
Chincoteague:
11.3% (110)
Virginia:
4.7% (103,002)
Number of families with income $40k - 50k:
Chincoteague:
9.6% (94)
Virginia:
5.4% (118,579)
Number of families with income $50k - 60k:
Chincoteague:
0.9% (9)
Virginia:
5.5% (120,924)
Number of families with income $60k - 75k:
Chincoteague:
8.7% (85)
State:
8.2% (180,564)
Number of families with income $75k - 100k:
Chincoteague:
13.3% (130)
State:
12.6% (277,221)
Number of families with income $100k - 125k:
Chincoteague:
7.5% (74)
Virginia:
11.3% (248,485)
Number of families with income $125k - 150k:
Chincoteague:
8.1% (79)
State:
9.0% (197,999)
Number of families with income $150k - 200k:
Chincoteague:
10.3% (101)
State:
12.7% (278,323)
Number of families with income > $200k:
Chincoteague:
11.8% (116)
Virginia:
20.3% (445,515)
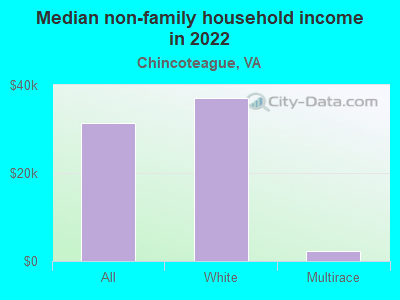
Median non-family income in Chincoteague in 2022:
Chincoteague:
$31,329
State:
$51,436
Change in median non-family income between 2000 and 2022:
Chincoteague, Virginia:
+47.4%
State:
+73.5%
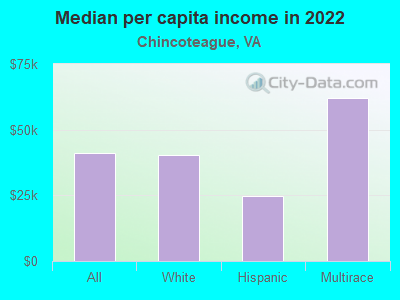
Median per capita income in Chincoteague in 2022:
Chincoteague:
$40,963
Virginia:
$47,199
Change in median per capita income between 2000 and 2022:
Chincoteague, Virginia:
+101.1%
Virginia:
+96.9%
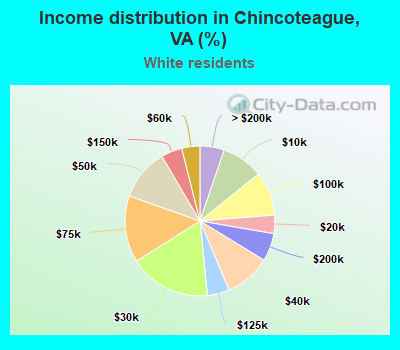
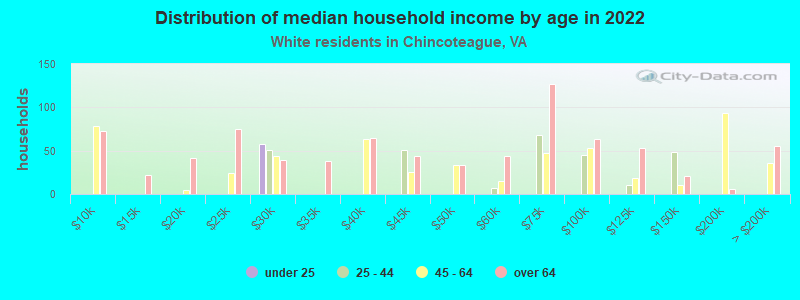
Income statistics for White residents
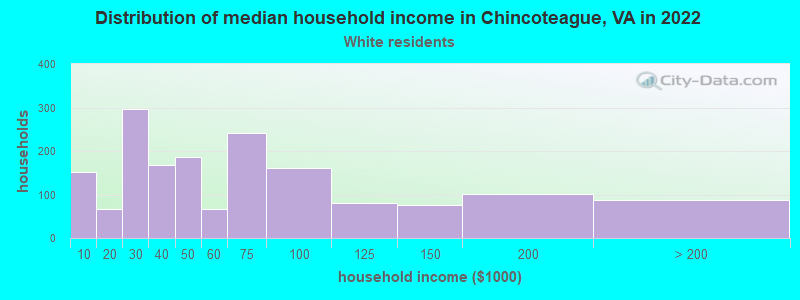
Median household income in Chincoteague, VA in 2022:
Chincoteague:
$46,195
State:
$91,924
Change in median household income between 2000 and 2022:
Chincoteague, Virginia:
+60.8%
State:
+81.9%
Number of households with income < $10k:
Chincoteague:
9.0% (151)
State:
4.1% (90,549)
Number of households with income $10k - 20k:
Chincoteague:
4.0% (67)
State:
5.2% (114,324)
Number of households with income $20k - 30k:
Chincoteague:
17.6% (296)
State:
5.7% (125,676)
Number of households with income $30k - 40k:
Chincoteague:
9.9% (167)
State:
5.5% (121,220)
Number of households with income $40k - 50k:
Chincoteague:
11.1% (187)
Virginia:
6.0% (133,011)
Number of households with income $50k - 60k:
Chincoteague:
3.9% (66)
State:
6.2% (136,856)
Number of households with income $60k - 75k:
Chincoteague:
14.4% (242)
State:
8.4% (186,094)
Number of households with income $75k - 100k:
Chincoteague:
9.5% (160)
State:
12.5% (277,077)
Number of households with income $100k - 125k:
Chincoteague:
4.8% (80)
State:
10.8% (237,562)
Number of households with income $125k - 150k:
Chincoteague:
4.5% (76)
State:
8.0% (177,532)
Number of households with income $150k - 200k:
Chincoteague:
6.0% (101)
Virginia:
11.0% (242,106)
Number of households with income > $200k:
Chincoteague:
5.2% (88)
State:
16.6% (366,064)
Aggregate household income in Chincoteague in 2022: $124,732,022
Median family income in Chincoteague in 2022:
Chincoteague:
$71,598
State:
$114,708
Number of families with income < $10k:
Chincoteague:
5.1% (47)
Virginia:
1.9% (27,415)
Number of families with income $10k - 20k:
Chincoteague:
3.1% (28)
State:
2.5% (35,529)
Number of families with income $20k - 30k:
Chincoteague:
11.2% (102)
State:
3.5% (49,027)
Number of families with income $30k - 40k:
Chincoteague:
11.4% (104)
State:
3.8% (53,514)
Number of families with income $40k - 50k:
Chincoteague:
9.5% (86)
Virginia:
4.7% (66,206)
Number of families with income $50k - 60k:
Chincoteague:
1.0% (9)
State:
5.2% (74,438)
Number of families with income $60k - 75k:
Chincoteague:
9.2% (83)
Virginia:
8.2% (116,265)
Number of families with income $75k - 100k:
Chincoteague:
13.9% (127)
Virginia:
12.9% (183,581)
Number of families with income $100k - 125k:
Chincoteague:
7.9% (71)
State:
11.9% (168,950)
Number of families with income $125k - 150k:
Chincoteague:
8.3% (75)
Virginia:
9.5% (134,452)
Number of families with income $150k - 200k:
Chincoteague:
10.7% (97)
State:
13.8% (195,800)
Number of families with income > $200k:
Chincoteague:
8.9% (81)
State:
22.1% (313,072)
Median non-family income in Chincoteague in 2022:
Chincoteague:
$37,024
State:
$53,785
Change in median non-family income between 2000 and 2022:
Chincoteague, Virginia:
+70.3%
Virginia:
+70.5%
Median per capita income in Chincoteague in 2022:
Chincoteague:
$40,509
Virginia:
$53,456
Change in median per capita income between 2000 and 2022:
Chincoteague, Virginia:
+97.6%
Virginia:
+99.2%
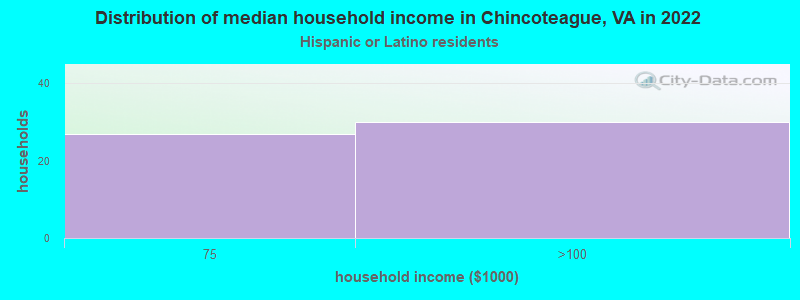
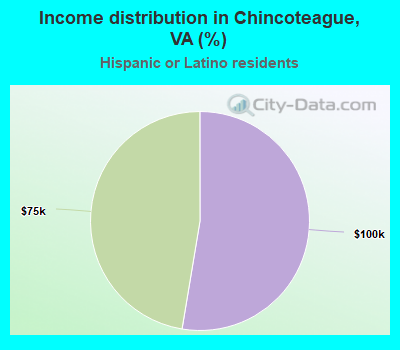
Income statistics for Hispanic or Latino residents
Number of households with income < $10k:
Chincoteague:
0.0% (0)
Virginia:
4.6% (11,664)
Number of households with income $10k - 20k:
Chincoteague:
0.0% (0)
State:
4.9% (12,443)
Number of households with income $20k - 30k:
Chincoteague:
0.0% (0)
State:
5.9% (14,859)
Number of households with income $30k - 40k:
Chincoteague:
0.0% (0)
State:
6.8% (17,059)
Number of households with income $40k - 50k:
Chincoteague:
0.0% (0)
State:
6.4% (16,261)
Number of households with income $50k - 60k:
Chincoteague:
0.0% (0)
State:
6.9% (17,468)
Number of households with income $60k - 75k:
Chincoteague:
47.4% (27)
State:
9.6% (24,193)
Number of households with income $75k - 100k:
Chincoteague:
52.6% (30)
State:
13.2% (33,405)
Number of households with income $100k - 125k:
Chincoteague:
0.0% (0)
Virginia:
10.5% (26,356)
Number of households with income $125k - 150k:
Chincoteague:
0.0% (0)
Virginia:
8.1% (20,494)
Number of households with income $150k - 200k:
Chincoteague:
0.0% (0)
State:
9.5% (23,943)
Number of households with income > $200k:
Chincoteague:
0.0% (0)
State:
13.5% (33,987)
Aggregate household income in Chincoteague in 2022: $3,007,728
Median per capita income in Chincoteague in 2022:
Chincoteague:
$24,611
State:
$32,277
Change in median per capita income between 2000 and 2022:: -50.8%
Chincoteague, Virginia:
-50.8%
State:
+104.6%
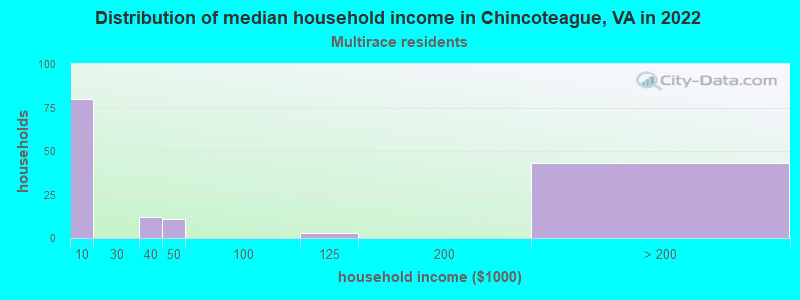
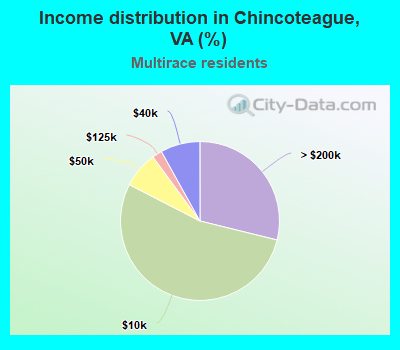
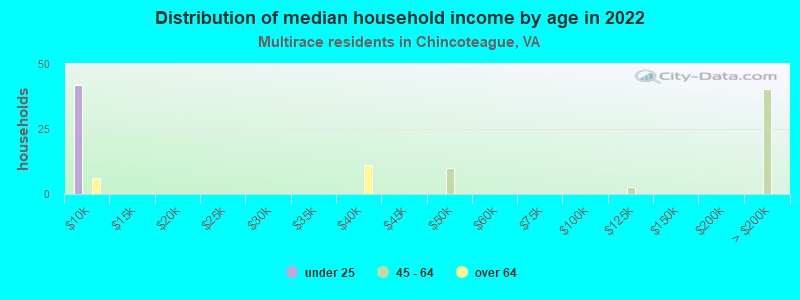
Income statistics for Multirace residents
Median household income in Chincoteague, VA in 2022:
Chincoteague:
$2,483
State:
$90,841
Change in median household income between 2000 and 2022:: -88.3%
Chincoteague, Virginia:
-88.3%
State:
+117.5%
Number of households with income < $10k:
Chincoteague:
53.7% (80)
State:
4.1% (9,125)
Number of households with income $10k - 20k:
Chincoteague:
0.0% (0)
State:
5.9% (12,969)
Number of households with income $20k - 30k:
Chincoteague:
0.0% (0)
Virginia:
4.8% (10,563)
Number of households with income $30k - 40k:
Chincoteague:
8.1% (12)
State:
6.6% (14,553)
Number of households with income $40k - 50k:
Chincoteague:
7.4% (11)
State:
5.2% (11,391)
Number of households with income $50k - 60k:
Chincoteague:
0.0% (0)
Virginia:
6.8% (14,994)
Number of households with income $60k - 75k:
Chincoteague:
0.0% (0)
State:
8.8% (19,323)
Number of households with income $75k - 100k:
Chincoteague:
0.0% (0)
Virginia:
12.1% (26,729)
Number of households with income $100k - 125k:
Chincoteague:
2.0% (3)
State:
10.4% (22,807)
Number of households with income $125k - 150k:
Chincoteague:
0.0% (0)
Virginia:
8.1% (17,881)
Number of households with income $150k - 200k:
Chincoteague:
0.0% (0)
Virginia:
10.4% (22,979)
Number of households with income > $200k:
Chincoteague:
28.9% (43)
State:
16.7% (36,748)
Aggregate household income in Chincoteague in 2022: $14,758,886
Median non-family income in Chincoteague in 2022:
Chincoteague:
$2,219
State:
$54,017
Median per capita income in Chincoteague in 2022:
Chincoteague:
$62,182
State:
$34,385
Discuss Chincoteague, Virginia (VA) on our hugely popular Virginia forum.