The median household income in Chinchilla, PA in 2022 was $105,174, which was 31.7% greater than the median annual income of $71,798 across the entire state of Pennsylvania. Compared to the median income of $34,438 in 2000 this represents an increase of 67.3%. The per capita income in 2022 was $49,206, which means an increase of 62.0% compared to 2000 when it was $18,710.
Whole page based on the data from 2000 / 2022 when the population of Chinchilla, Pennsylvania was 2,098 / 2,185
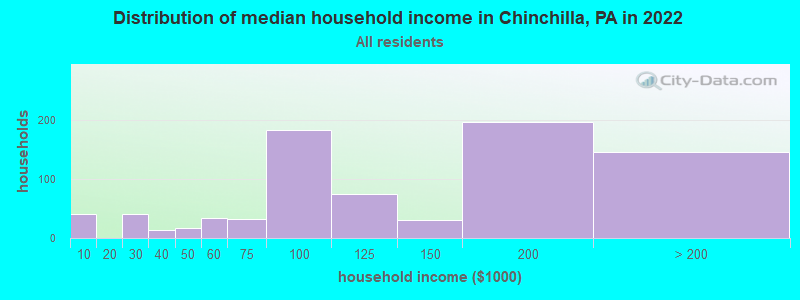
Income statistics for all residents
Median household income in Chinchilla, PA in 2022:
Chinchilla:
$105,175
Pennsylvania:
$71,798
Number of households with income < $10k:
Chinchilla:
5.1% (41)
Pennsylvania:
5.5% (291,562)
Number of households with income $10k - 20k:
Chinchilla:
0.0% (0)
State:
7.3% (384,726)
Number of households with income $20k - 30k:
Chinchilla:
5.1% (41)
State:
7.4% (389,464)
Number of households with income $30k - 40k:
Chinchilla:
1.7% (14)
State:
7.6% (402,138)
Number of households with income $40k - 50k:
Chinchilla:
2.1% (17)
State:
7.3% (387,945)
Number of households with income $50k - 60k:
Chinchilla:
4.2% (34)
State:
7.0% (372,468)
Number of households with income $60k - 75k:
Chinchilla:
4.1% (33)
State:
9.9% (524,786)
Number of households with income $75k - 100k:
Chinchilla:
22.6% (183)
Pennsylvania:
12.6% (666,253)
Number of households with income $100k - 125k:
Chinchilla:
9.1% (74)
State:
9.9% (526,402)
Number of households with income $125k - 150k:
Chinchilla:
3.7% (30)
State:
6.9% (362,702)
Number of households with income $150k - 200k:
Chinchilla:
24.3% (197)
State:
8.3% (440,827)
Number of households with income > $200k:
Chinchilla:
18.0% (146)
Pennsylvania:
10.3% (544,792)
Aggregate household income in Chinchilla in 2022: $105,603,531
Median family income in Chinchilla in 2022:
Chinchilla:
$163,286
State:
$93,029
Number of families with income $30k - 40k:
Chinchilla:
2.4% (12)
Pennsylvania:
5.8% (191,305)
Number of families with income $40k - 50k:
Chinchilla:
3.9% (20)
State:
6.4% (211,380)
Number of families with income $50k - 60k:
Chinchilla:
5.4% (27)
Pennsylvania:
6.4% (209,910)
Number of families with income $60k - 75k:
Chinchilla:
3.3% (17)
State:
9.7% (318,991)
Number of families with income $75k - 100k:
Chinchilla:
5.8% (30)
State:
14.0% (461,021)
Number of families with income $100k - 125k:
Chinchilla:
12.5% (64)
Pennsylvania:
12.2% (400,961)
Number of families with income $125k - 150k:
Chinchilla:
6.1% (31)
State:
8.8% (288,471)
Number of families with income $150k - 200k:
Chinchilla:
35.6% (182)
State:
11.2% (367,642)
Number of families with income > $200k:
Chinchilla:
25.0% (128)
Pennsylvania:
14.3% (470,863)
Median non-family income in Chinchilla in 2022:
Chinchilla:
$75,542
State:
$42,203
Median per capita income in Chinchilla in 2022:
Chinchilla:
$49,207
State:
$41,489
Income statistics for White residents
Median household income in Chinchilla, PA in 2022:
Chinchilla:
$112,254
State:
$76,765
Number of households with income < $10k:
Chinchilla:
5.5% (38)
Pennsylvania:
4.3% (179,792)
Number of households with income $10k - 20k:
Chinchilla:
0.0% (0)
Pennsylvania:
6.5% (268,738)
Number of households with income $20k - 30k:
Chinchilla:
5.3% (36)
State:
7.0% (288,138)
Number of households with income $30k - 40k:
Chinchilla:
2.0% (14)
State:
7.2% (300,208)
Number of households with income $40k - 50k:
Chinchilla:
2.3% (16)
State:
7.2% (298,756)
Number of households with income $50k - 60k:
Chinchilla:
4.2% (29)
State:
6.8% (283,251)
Number of households with income $60k - 75k:
Chinchilla:
4.7% (32)
Pennsylvania:
9.9% (408,159)
Number of households with income $75k - 100k:
Chinchilla:
15.3% (105)
State:
13.2% (547,809)
Number of households with income $100k - 125k:
Chinchilla:
9.9% (68)
State:
10.5% (436,652)
Number of households with income $125k - 150k:
Chinchilla:
4.5% (31)
State:
7.3% (304,132)
Number of households with income $150k - 200k:
Chinchilla:
27.6% (189)
State:
9.0% (374,658)
Number of households with income > $200k:
Chinchilla:
18.5% (127)
State:
10.9% (452,618)
Aggregate household income in Chinchilla in 2022: $83,525,513
Median family income in Chinchilla in 2022:
Chinchilla:
$165,454
Pennsylvania:
$99,396
Number of families with income $30k - 40k:
Chinchilla:
2.8% (13)
State:
5.2% (134,367)
Number of families with income $40k - 50k:
Chinchilla:
3.9% (19)
State:
6.0% (154,327)
Number of families with income $50k - 60k:
Chinchilla:
3.4% (16)
Pennsylvania:
6.1% (157,983)
Number of families with income $60k - 75k:
Chinchilla:
3.5% (17)
State:
9.6% (249,292)
Number of families with income $75k - 100k:
Chinchilla:
6.1% (30)
State:
14.7% (379,316)
Number of families with income $100k - 125k:
Chinchilla:
11.8% (57)
Pennsylvania:
12.9% (333,626)
Number of families with income $125k - 150k:
Chinchilla:
6.5% (31)
State:
9.4% (243,915)
Number of families with income $150k - 200k:
Chinchilla:
36.8% (177)
State:
12.2% (314,926)
Number of families with income > $200k:
Chinchilla:
25.3% (122)
State:
15.1% (390,885)
Median non-family income in Chinchilla in 2022:
Chinchilla:
$63,729
State:
$44,251
Median per capita income in Chinchilla in 2022:
Chinchilla:
$43,973
Pennsylvania:
$45,306
Change in median per capita income between 2000 and 2022:
Chinchilla, Pennsylvania:
+132.9%
State:
+105.4%
Income statistics for Asian residents
Number of households with income < $10k:
Chinchilla:
0.0% (0)
Pennsylvania:
5.8% (9,650)
Number of households with income $10k - 20k:
Chinchilla:
0.0% (0)
State:
4.3% (7,158)
Number of households with income $20k - 30k:
Chinchilla:
0.0% (0)
State:
5.7% (9,531)
Number of households with income $30k - 40k:
Chinchilla:
0.0% (0)
State:
5.7% (9,580)
Number of households with income $40k - 50k:
Chinchilla:
0.0% (0)
Pennsylvania:
5.4% (9,050)
Number of households with income $50k - 60k:
Chinchilla:
0.0% (0)
State:
6.1% (10,189)
Number of households with income $60k - 75k:
Chinchilla:
0.0% (0)
State:
7.8% (13,008)
Number of households with income $75k - 100k:
Chinchilla:
100.0% (79)
Pennsylvania:
10.1% (16,923)
Number of households with income $100k - 125k:
Chinchilla:
0.0% (0)
State:
8.8% (14,765)
Number of households with income $125k - 150k:
Chinchilla:
0.0% (0)
State:
7.5% (12,634)
Number of households with income $150k - 200k:
Chinchilla:
0.0% (0)
Pennsylvania:
10.0% (16,823)
Number of households with income > $200k:
Chinchilla:
0.0% (0)
Pennsylvania:
22.9% (38,426)
Aggregate household income in Chinchilla in 2022: $135,307,500
Median per capita income in Chinchilla in 2022:
Chinchilla:
$23,112
State:
$48,341
Change in median per capita income between 2000 and 2022:: -7.7%
Chinchilla, Pennsylvania:
-7.7%
State:
+140.6%
Income statistics for Hispanic or Latino residents
Number of households with income < $10k:
Chinchilla:
0.0% (0)
State:
8.7% (29,517)
Number of households with income $10k - 20k:
Chinchilla:
0.0% (0)
State:
10.0% (33,785)
Number of households with income $20k - 30k:
Chinchilla:
0.0% (0)
State:
9.9% (33,399)
Number of households with income $30k - 40k:
Chinchilla:
0.0% (0)
Pennsylvania:
8.8% (29,878)
Number of households with income $40k - 50k:
Chinchilla:
0.0% (0)
Pennsylvania:
8.5% (28,549)
Number of households with income $50k - 60k:
Chinchilla:
0.0% (0)
State:
7.6% (25,792)
Number of households with income $60k - 75k:
Chinchilla:
0.0% (0)
Pennsylvania:
10.6% (35,808)
Number of households with income $75k - 100k:
Chinchilla:
0.0% (0)
Pennsylvania:
11.9% (40,287)
Number of households with income $100k - 125k:
Chinchilla:
0.0% (0)
State:
8.0% (27,028)
Number of households with income $125k - 150k:
Chinchilla:
0.0% (0)
Pennsylvania:
5.2% (17,622)
Number of households with income $150k - 200k:
Chinchilla:
0.0% (0)
State:
5.2% (17,563)
Number of households with income > $200k:
Chinchilla:
100.0% (80)
State:
5.5% (18,469)
Aggregate household income in Chinchilla in 2022: $450,977,100
Median per capita income in Chinchilla in 2022:
Chinchilla:
$139,214
Pennsylvania:
$23,829
Income statistics for Multirace residents
Median per capita income in Chinchilla in 2022:
Chinchilla:
$22,841
State:
$27,581
Income statistics for other residents
Number of households with income < $10k:
Chinchilla:
0.0% (0)
State:
9.2% (14,206)
Number of households with income $10k - 20k:
Chinchilla:
0.0% (0)
Pennsylvania:
11.0% (17,038)
Number of households with income $20k - 30k:
Chinchilla:
0.0% (0)
Pennsylvania:
11.0% (17,000)
Number of households with income $30k - 40k:
Chinchilla:
0.0% (0)
State:
11.0% (17,022)
Number of households with income $40k - 50k:
Chinchilla:
0.0% (0)
Pennsylvania:
7.7% (11,829)
Number of households with income $50k - 60k:
Chinchilla:
0.0% (0)
State:
8.0% (12,320)
Number of households with income $60k - 75k:
Chinchilla:
0.0% (0)
State:
8.8% (13,590)
Number of households with income $75k - 100k:
Chinchilla:
0.0% (0)
Pennsylvania:
10.5% (16,166)
Number of households with income $100k - 125k:
Chinchilla:
0.0% (0)
Pennsylvania:
8.0% (12,371)
Number of households with income $125k - 150k:
Chinchilla:
0.0% (0)
State:
4.0% (6,190)
Number of households with income $150k - 200k:
Chinchilla:
0.0% (0)
State:
5.1% (7,862)
Number of households with income > $200k:
Chinchilla:
100.0% (28)
State:
5.6% (8,691)
Aggregate household income in Chinchilla in 2022: $238,345,700
Median per capita income in Chinchilla in 2022:
Chinchilla:
$23,816
Pennsylvania:
$24,779
Discuss Chinchilla, Pennsylvania (PA) on our hugely popular Pennsylvania forum.