The median household income in Chemung, IL in 2022 was $62,316, which was 23.1% less than the median annual income of $76,708 across the entire state of Illinois. Compared to the median income of $64,826 in 2000 this represents a decrease of 4.0%. The per capita income in 2022 was $23,555, which means a decrease of 12.4% compared to 2000 when it was $26,476.
Whole page based on the data from 2000 / 2022 when the population of Chemung, Illinois was 308 / 387
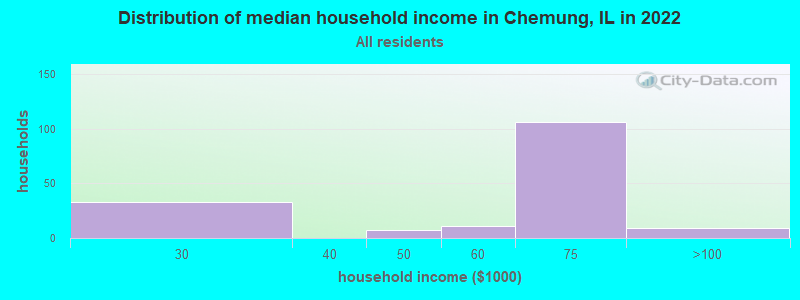
Income statistics for all residents
Median household income in Chemung, IL in 2022:
Chemung:
$62,317
Illinois:
$76,708
Change in median household income between 2000 and 2022:: -3.9%
Chemung, Illinois:
-3.9%
State:
+64.6%
Number of households with income < $10k:
Chemung:
0.0% (0)
Illinois:
5.9% (296,090)
Number of households with income $10k - 20k:
Chemung:
0.0% (0)
State:
6.6% (333,259)
Number of households with income $20k - 30k:
Chemung:
19.9% (33)
State:
6.8% (342,921)
Number of households with income $30k - 40k:
Chemung:
0.0% (0)
Illinois:
7.0% (355,254)
Number of households with income $40k - 50k:
Chemung:
4.2% (7)
State:
6.7% (340,678)
Number of households with income $50k - 60k:
Chemung:
6.6% (11)
State:
6.7% (339,405)
Number of households with income $60k - 75k:
Chemung:
63.9% (106)
Illinois:
9.2% (465,709)
Number of households with income $75k - 100k:
Chemung:
5.4% (9)
State:
12.9% (651,353)
Number of households with income $100k - 125k:
Chemung:
0.0% (0)
Illinois:
10.3% (522,359)
Number of households with income $125k - 150k:
Chemung:
0.0% (0)
State:
7.3% (367,136)
Number of households with income $150k - 200k:
Chemung:
0.0% (0)
Illinois:
9.0% (455,249)
Number of households with income > $200k:
Chemung:
0.0% (0)
State:
11.6% (586,947)
Aggregate household income in Chemung in 2022: $9,453,755
Median family income in Chemung in 2022:
Chemung:
$63,751
State:
$96,948
Number of families with income $20k - 30k:
Chemung:
16.6% (20)
Illinois:
4.7% (146,403)
Number of families with income $40k - 50k:
Chemung:
4.2% (5)
State:
5.8% (181,164)
Number of families with income $60k - 75k:
Chemung:
71.9% (88)
State:
9.0% (282,985)
Number of families with income $75k - 100k:
Chemung:
7.2% (9)
State:
13.8% (432,725)
Median income for 2 person families:
Chemung:
$63,382
Illinois:
$83,024
Median income for families with 0 earners:
Chemung:
$0
Illinois:
$51,619
Median income for families with 1 earner:
Chemung:
$31,658
State:
$64,303
Median income for families with 2 earners:
Chemung:
$0
State:
$122,565
Median income for families with 3+ earners:
Chemung:
$0
State:
$145,010
Median per capita income in Chemung in 2022:
Chemung:
$23,556
State:
$43,317
Change in median per capita income between 2000 and 2022:: -11.0%
Chemung, Illinois:
-11.0%
Illinois:
+87.5%
Income statistics for White residents
Median household income in Chemung, IL in 2022:
Chemung:
$62,570
State:
$83,346
Change in median household income between 2000 and 2022:: -4.1%
Chemung, Illinois:
-4.1%
State:
+67.5%
Number of households with income < $10k:
Chemung:
0.0% (0)
State:
4.5% (149,895)
Number of households with income $10k - 20k:
Chemung:
0.0% (0)
State:
5.5% (184,529)
Number of households with income $20k - 30k:
Chemung:
22.2% (35)
State:
6.1% (205,767)
Number of households with income $30k - 40k:
Chemung:
0.0% (0)
Illinois:
6.7% (225,572)
Number of households with income $40k - 50k:
Chemung:
3.8% (6)
State:
6.5% (216,965)
Number of households with income $50k - 60k:
Chemung:
7.0% (11)
State:
6.6% (222,841)
Number of households with income $60k - 75k:
Chemung:
61.4% (97)
Illinois:
9.3% (312,758)
Number of households with income $75k - 100k:
Chemung:
5.7% (9)
State:
12.9% (433,180)
Number of households with income $100k - 125k:
Chemung:
0.0% (0)
State:
10.7% (360,753)
Number of households with income $125k - 150k:
Chemung:
0.0% (0)
Illinois:
7.9% (266,532)
Number of households with income $150k - 200k:
Chemung:
0.0% (0)
State:
10.0% (337,357)
Number of households with income > $200k:
Chemung:
0.0% (0)
State:
13.3% (446,069)
Aggregate household income in Chemung in 2022: $9,079,658
Median family income in Chemung in 2022:
Chemung:
$63,797
State:
$107,938
Number of families with income $20k - 30k:
Chemung:
19.6% (24)
State:
3.5% (70,927)
Number of families with income $40k - 50k:
Chemung:
3.7% (4)
Illinois:
5.0% (102,597)
Number of families with income $60k - 75k:
Chemung:
69.4% (83)
State:
8.8% (179,665)
Number of families with income $75k - 100k:
Chemung:
7.3% (9)
Illinois:
13.5% (276,887)
Median per capita income in Chemung in 2022:
Chemung:
$24,120
State:
$50,738
Change in median per capita income between 2000 and 2022:: -10.7%
Chemung, Illinois:
-10.7%
State:
+95.5%
Income statistics for Hispanic or Latino residents
Number of households with income < $10k:
Chemung:
0.0% (0)
State:
4.9% (33,145)
Number of households with income $10k - 20k:
Chemung:
0.0% (0)
Illinois:
5.4% (36,345)
Number of households with income $20k - 30k:
Chemung:
100.0% (27)
State:
7.5% (50,677)
Number of households with income $30k - 40k:
Chemung:
0.0% (0)
State:
7.7% (52,008)
Number of households with income $40k - 50k:
Chemung:
0.0% (0)
Illinois:
8.1% (54,702)
Number of households with income $50k - 60k:
Chemung:
0.0% (0)
State:
7.5% (51,062)
Number of households with income $60k - 75k:
Chemung:
0.0% (0)
State:
11.3% (76,576)
Number of households with income $75k - 100k:
Chemung:
0.0% (0)
Illinois:
15.5% (105,152)
Number of households with income $100k - 125k:
Chemung:
0.0% (0)
Illinois:
11.5% (77,760)
Number of households with income $125k - 150k:
Chemung:
0.0% (0)
State:
7.3% (49,310)
Number of households with income $150k - 200k:
Chemung:
0.0% (0)
State:
7.6% (51,233)
Number of households with income > $200k:
Chemung:
0.0% (0)
State:
5.9% (40,028)
Aggregate household income in Chemung in 2022: $9,960,693
Median per capita income in Chemung in 2022:
Chemung:
$13,250
State:
$26,551
Change in median per capita income between 2000 and 2022:: -2.8%
Chemung, Illinois:
-2.8%
State:
+111.0%
Discuss Chemung, Illinois (IL) on our hugely popular Illinois forum.