Brussels, Wisconsin (WI) income map, earnings map, and wages data
The median household income in Brussels, WI in 2022 was $69,117, which was 2.7% less than the median annual income of $70,996 across the entire state of Wisconsin. Compared to the median income of $42,212 in 2000 this represents an increase of 38.9%. The per capita income in 2022 was $32,349, which means an increase of 47.8% compared to 2000 when it was $16,871.
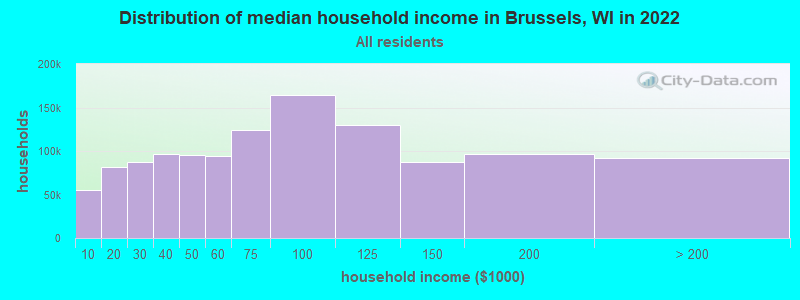
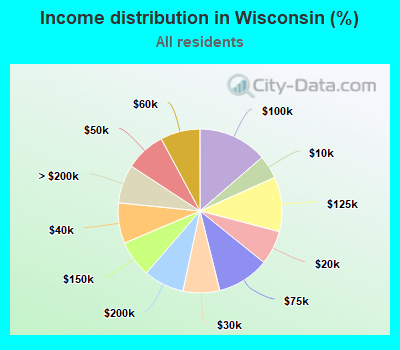
Income statistics for all residents
Median household income in Brussels, WI in 2022:| Brussels: | $69,117 |
| State: | $70,996 |
Change in median household income between 2000 and 2022:| Brussels, Wisconsin: | +63.7% |
| State: | +62.1% |
Number of households with income < $10k:| Brussels: | 4.6% (55,728) |
| State: | 4.6% (115,058) |
Number of households with income $10k - 20k:| Brussels: | 6.8% (81,224) |
| State: | 6.7% (167,685) |
Number of households with income $20k - 30k:| Brussels: | 7.3% (87,286) |
| Wisconsin: | 7.2% (180,435) |
Number of households with income $30k - 40k:| Brussels: | 8.0% (96,393) |
| State: | 8.0% (199,167) |
Number of households with income $40k - 50k:| Brussels: | 7.9% (95,500) |
| State: | 7.9% (197,648) |
Number of households with income $50k - 60k:| Brussels: | 7.8% (94,310) |
| State: | 7.8% (195,297) |
Number of households with income $60k - 75k:| Brussels: | 10.3% (123,920) |
| State: | 10.3% (256,633) |
Number of households with income $75k - 100k:| Brussels: | 13.7% (164,175) |
| State: | 13.7% (340,492) |
Number of households with income $100k - 125k:| Brussels: | 10.8% (129,383) |
| State: | 10.8% (268,847) |
Number of households with income $125k - 150k:| Brussels: | 7.2% (87,093) |
| State: | 7.3% (180,911) |
Number of households with income $150k - 200k:| Brussels: | 8.0% (95,987) |
| State: | 8.0% (199,297) |
Number of households with income > $200k:| Brussels: | 7.6% (91,515) |
| State: | 7.6% (189,651) |
Aggregate household income in Brussels in 2022: $1,038,263,735
Median family income in Brussels in 2022:| Brussels: | $79,081 |
| State: | $91,700 |
Median non-family income in Brussels in 2022:| Brussels: | $35,341 |
| State: | $42,812 |
Change in median non-family income between 2000 and 2022:| Brussels, Wisconsin: | +68.3% |
| State: | +65.7% |
Median per capita income in Brussels in 2022:| Brussels: | $32,349 |
| Wisconsin: | $40,188 |
Change in median per capita income between 2000 and 2022:| Brussels, Wisconsin: | +91.7% |
| Wisconsin: | +88.9% |
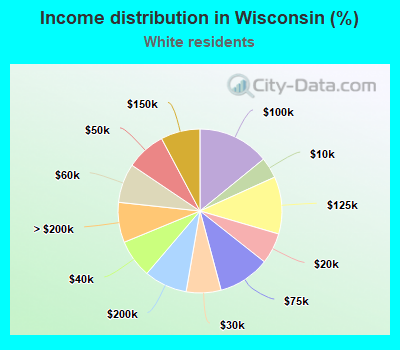
Income statistics for White residents
Median household income in Brussels, WI in 2022:| Brussels: | $69,715 |
| State: | $74,405 |
Change in median household income between 2000 and 2022:| Brussels, Wisconsin: | +65.9% |
| Wisconsin: | +64.5% |
Number of households with income < $10k:| Brussels: | 4.1% (40,628) |
| State: | 4.1% (87,410) |
Number of households with income $10k - 20k:| Brussels: | 6.1% (60,212) |
| Wisconsin: | 6.1% (129,511) |
Number of households with income $20k - 30k:| Brussels: | 6.9% (67,498) |
| State: | 6.9% (145,235) |
Number of households with income $30k - 40k:| Brussels: | 7.6% (74,473) |
| State: | 7.6% (160,205) |
Number of households with income $40k - 50k:| Brussels: | 7.8% (76,971) |
| State: | 7.8% (165,627) |
Number of households with income $50k - 60k:| Brussels: | 7.7% (75,956) |
| State: | 7.7% (163,506) |
Number of households with income $60k - 75k:| Brussels: | 10.2% (100,583) |
| State: | 10.2% (216,479) |
Number of households with income $75k - 100k:| Brussels: | 14.1% (138,853) |
| State: | 14.1% (298,984) |
Number of households with income $100k - 125k:| Brussels: | 11.3% (111,200) |
| State: | 11.3% (239,588) |
Number of households with income $125k - 150k:| Brussels: | 7.8% (76,371) |
| Wisconsin: | 7.8% (164,502) |
Number of households with income $150k - 200k:| Brussels: | 8.5% (83,603) |
| State: | 8.5% (180,048) |
Number of households with income > $200k:| Brussels: | 7.9% (78,058) |
| State: | 7.9% (167,999) |
Aggregate household income in Brussels in 2022: $902,256,733
Median family income in Brussels in 2022:| Brussels: | $79,750 |
| State: | $96,327 |
Number of families with income < $10k:| Brussels: | 1.4% (3) |
| State: | 2.0% (25,684) |
Number of families with income $10k - 20k:| Brussels: | 3.9% (10) |
| State: | 2.4% (30,426) |
Number of families with income $20k - 30k:| Brussels: | 5.8% (15) |
| State: | 3.5% (45,298) |
Number of families with income $30k - 40k:| Brussels: | 8.4% (21) |
| Wisconsin: | 4.9% (62,935) |
Number of families with income $40k - 50k:| Brussels: | 9.0% (23) |
| Wisconsin: | 6.0% (76,575) |
Number of families with income $50k - 60k:| Brussels: | 8.8% (22) |
| State: | 6.9% (88,079) |
Number of families with income $60k - 75k:| Brussels: | 7.4% (19) |
| State: | 10.6% (136,022) |
Number of families with income $75k - 100k:| Brussels: | 14.6% (37) |
| State: | 16.0% (204,807) |
Number of families with income $100k - 125k:| Brussels: | 19.9% (50) |
| State: | 14.3% (183,287) |
Number of families with income $125k - 150k:| Brussels: | 20.8% (53) |
| State: | 10.2% (131,464) |
Median non-family income in Brussels in 2022:| Brussels: | $35,494 |
| Wisconsin: | $44,213 |
Change in median non-family income between 2000 and 2022:| Brussels, Wisconsin: | +70.0% |
| State: | +68.5% |
Median per capita income in Brussels in 2022:| Brussels: | $33,229 |
| State: | $43,415 |
Change in median per capita income between 2000 and 2022:| Brussels, Wisconsin: | +96.6% |
| State: | +94.0% |
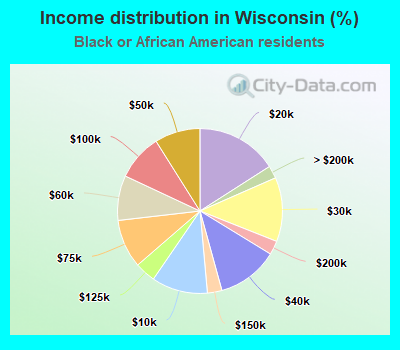
Income statistics for Black or African American residents
Median household income in Brussels, WI in 2022:| Brussels: | $59,836 |
| State: | $38,730 |
Change in median household income between 2000 and 2022:| Brussels, Wisconsin: | +16.8% |
| State: | +51.4% |
Number of households with income < $10k:| Brussels: | 11.0% (29,842) |
| Wisconsin: | 11.0% (14,900) |
Number of households with income $10k - 20k:| Brussels: | 15.9% (43,293) |
| Wisconsin: | 15.9% (21,616) |
Number of households with income $20k - 30k:| Brussels: | 12.6% (34,178) |
| Wisconsin: | 12.6% (17,065) |
Number of households with income $30k - 40k:| Brussels: | 12.0% (32,507) |
| Wisconsin: | 12.0% (16,231) |
Number of households with income $40k - 50k:| Brussels: | 8.9% (24,267) |
| State: | 8.9% (12,116) |
Number of households with income $50k - 60k:| Brussels: | 8.8% (23,908) |
| Wisconsin: | 8.8% (11,937) |
Number of households with income $60k - 75k:| Brussels: | 9.5% (25,884) |
| State: | 9.5% (12,924) |
Number of households with income $75k - 100k:| Brussels: | 9.1% (24,647) |
| Wisconsin: | 9.1% (12,306) |
Number of households with income $100k - 125k:| Brussels: | 4.1% (11,066) |
| State: | 4.1% (5,525) |
Number of households with income $125k - 150k:| Brussels: | 2.9% (7,755) |
| State: | 2.9% (3,872) |
Number of households with income $150k - 200k:| Brussels: | 2.7% (7,390) |
| Wisconsin: | 2.7% (3,690) |
Number of households with income > $200k:| Brussels: | 2.5% (6,729) |
| State: | 2.5% (3,360) |
Aggregate household income in Brussels in 2022: $450,756
Median family income in Brussels in 2022:| Brussels: | $90,318 |
| State: | $50,061 |
Median per capita income in Brussels in 2022:| Brussels: | $40,226 |
| State: | $22,861 |
Change in median per capita income between 2000 and 2022:| Brussels, Wisconsin: | +71.2% |
| Wisconsin: | +87.6% |
Income statistics for Hispanic or Latino residents
Number of households with income < $10k:| Brussels: | 6.2% (11,424) |
| State: | 6.2% (7,841) |
Number of households with income $10k - 20k:| Brussels: | 7.2% (13,248) |
| Wisconsin: | 7.2% (9,100) |
Number of households with income $20k - 30k:| Brussels: | 7.3% (13,413) |
| Wisconsin: | 7.3% (9,213) |
Number of households with income $30k - 40k:| Brussels: | 9.9% (18,215) |
| Wisconsin: | 9.9% (12,505) |
Number of households with income $40k - 50k:| Brussels: | 9.9% (18,256) |
| State: | 9.9% (12,552) |
Number of households with income $50k - 60k:| Brussels: | 8.9% (16,398) |
| Wisconsin: | 8.9% (11,263) |
Number of households with income $60k - 75k:| Brussels: | 13.0% (23,941) |
| Wisconsin: | 13.0% (16,458) |
Number of households with income $75k - 100k:| Brussels: | 14.7% (27,057) |
| State: | 14.7% (18,587) |
Number of households with income $100k - 125k:| Brussels: | 8.8% (16,204) |
| Wisconsin: | 8.8% (11,136) |
Number of households with income $125k - 150k:| Brussels: | 4.2% (7,692) |
| State: | 4.2% (5,292) |
Number of households with income $150k - 200k:| Brussels: | 5.3% (9,794) |
| State: | 5.3% (6,737) |
Number of households with income > $200k:| Brussels: | 4.6% (8,500) |
| State: | 4.6% (5,851) |
Median per capita income in Brussels in 2022:| Brussels: | $67,393 |
| State: | $23,991 |
Change in median per capita income between 2000 and 2022:| Brussels, Wisconsin: | +101.2% |
| Wisconsin: | +108.6% |
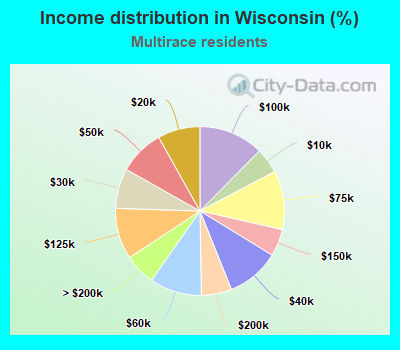
Income statistics for Multirace residents
Median household income in Brussels, WI in 2022:| Brussels: | $52,821 |
| Wisconsin: | $60,490 |
Change in median household income between 2000 and 2022:| Brussels, Wisconsin: | +69.0% |
| State: | +69.6% |
Number of households with income < $10k:| Brussels: | 4.9% (2,761) |
| State: | 4.8% (6,288) |
Number of households with income $10k - 20k:| Brussels: | 8.2% (4,650) |
| Wisconsin: | 8.1% (10,562) |
Number of households with income $20k - 30k:| Brussels: | 7.7% (4,380) |
| Wisconsin: | 7.7% (9,975) |
Number of households with income $30k - 40k:| Brussels: | 10.3% (5,813) |
| State: | 10.2% (13,246) |
Number of households with income $40k - 50k:| Brussels: | 8.7% (4,936) |
| State: | 8.7% (11,305) |
Number of households with income $50k - 60k:| Brussels: | 10.0% (5,677) |
| State: | 10.0% (12,968) |
Number of households with income $60k - 75k:| Brussels: | 11.2% (6,345) |
| State: | 11.3% (14,655) |
Number of households with income $75k - 100k:| Brussels: | 12.5% (7,063) |
| Wisconsin: | 12.4% (16,181) |
Number of households with income $100k - 125k:| Brussels: | 9.8% (5,541) |
| State: | 9.8% (12,743) |
Number of households with income $125k - 150k:| Brussels: | 5.2% (2,929) |
| State: | 5.2% (6,773) |
Number of households with income $150k - 200k:| Brussels: | 5.7% (3,237) |
| Wisconsin: | 5.8% (7,552) |
Number of households with income > $200k:| Brussels: | 5.9% (3,367) |
| State: | 6.0% (7,788) |
Aggregate household income in Brussels in 2022: $562,157
Median non-family income in Brussels in 2022:| Brussels: | $66,888 |
| State: | $43,723 |
Change in median non-family income between 2000 and 2022:| Brussels, Wisconsin: | +114.0% |
| Wisconsin: | +93.3% |
Median per capita income in Brussels in 2022:| Brussels: | $28,016 |
| State: | $24,783 |
Change in median per capita income between 2000 and 2022:| Brussels, Wisconsin: | +125.9% |
| State: | +124.7% |