Brushy Creek, South Carolina (SC) income map, earnings map, and wages data
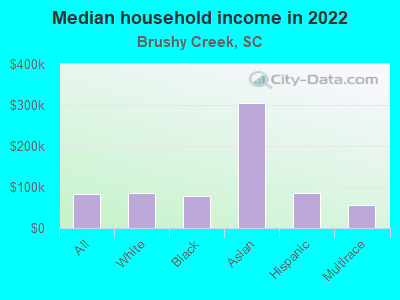
The median household income in Brushy Creek, SC in 2022 was $83,020, which was 22.8% greater than the median annual income of $64,115 across the entire state of South Carolina. Compared to the median income of $48,720 in 2000 this represents an increase of 41.3%. The per capita income in 2022 was $38,279, which means an increase of 47.2% compared to 2000 when it was $20,208.
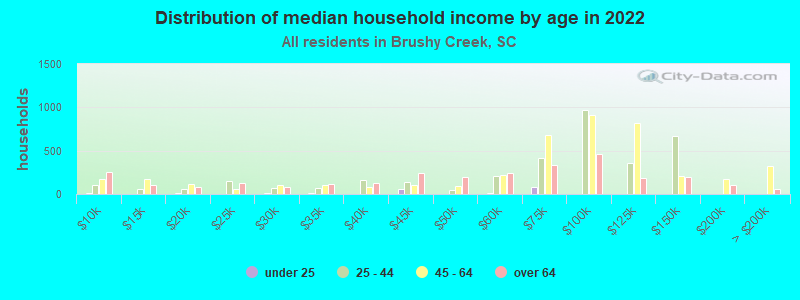
Income statistics for all residents
Median household income in Brushy Creek, SC in 2022:| Brushy Creek: | $83,020 |
| South Carolina: | $64,115 |
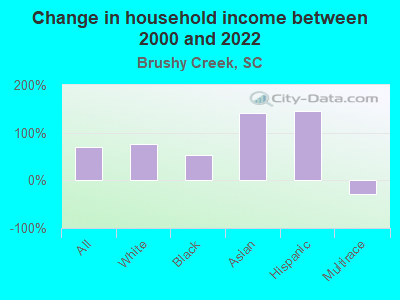
Change in median household income between 2000 and 2022:| Brushy Creek, South Carolina: | +70.4% |
| State: | +72.9% |
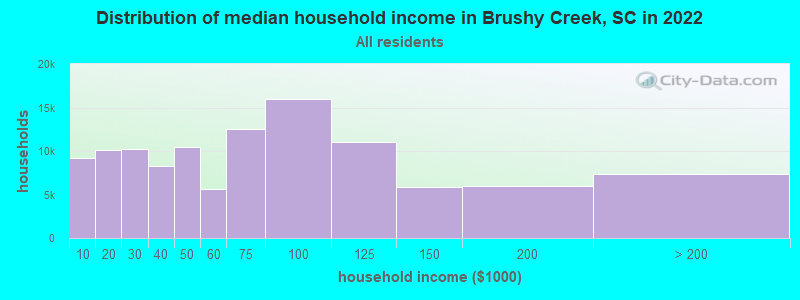
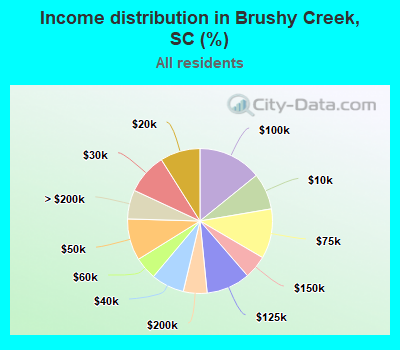
Number of households with income < $10k:| Brushy Creek: | 8.2% (9,184) |
| State: | 6.1% (130,922) |
Number of households with income $10k - 20k:| Brushy Creek: | 8.9% (10,068) |
| South Carolina: | 7.9% (168,918) |
Number of households with income $20k - 30k:| Brushy Creek: | 9.1% (10,264) |
| South Carolina: | 8.0% (171,564) |
Number of households with income $30k - 40k:| Brushy Creek: | 7.4% (8,321) |
| South Carolina: | 9.2% (195,662) |
Number of households with income $40k - 50k:| Brushy Creek: | 9.3% (10,494) |
| South Carolina: | 8.2% (176,179) |
Number of households with income $50k - 60k:| Brushy Creek: | 5.0% (5,679) |
| State: | 7.5% (159,159) |
Number of households with income $60k - 75k:| Brushy Creek: | 11.1% (12,509) |
| State: | 9.9% (211,862) |
Number of households with income $75k - 100k:| Brushy Creek: | 14.2% (15,963) |
| South Carolina: | 13.5% (287,601) |
Number of households with income $100k - 125k:| Brushy Creek: | 9.8% (11,014) |
| State: | 9.3% (199,068) |
Number of households with income $125k - 150k:| Brushy Creek: | 5.2% (5,874) |
| State: | 6.2% (133,330) |
Number of households with income $150k - 200k:| Brushy Creek: | 5.3% (5,968) |
| State: | 6.6% (141,363) |
Number of households with income > $200k:| Brushy Creek: | 6.5% (7,301) |
| State: | 7.5% (160,452) |
Aggregate household income in Brushy Creek in 2022: $1,338,160,725
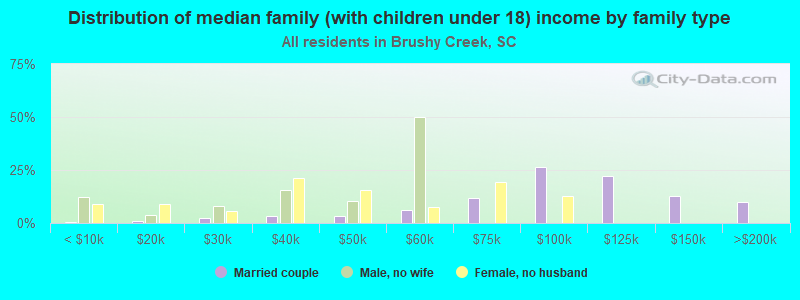
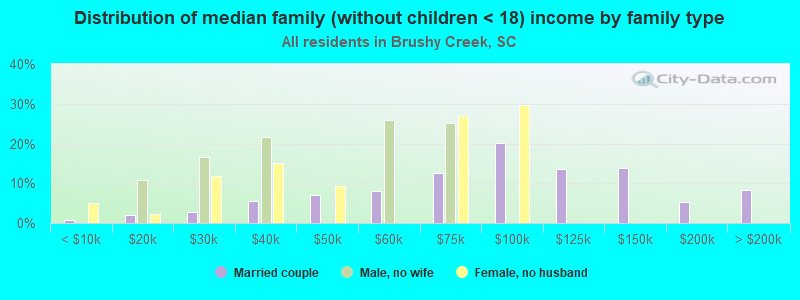
Median family income in Brushy Creek in 2022:| Brushy Creek: | $93,166 |
| South Carolina: | $79,886 |
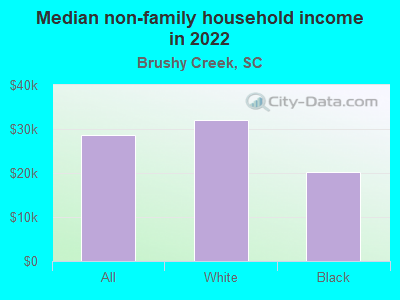
Median non-family income in Brushy Creek in 2022:| Brushy Creek: | $28,550 |
| South Carolina: | $38,426 |
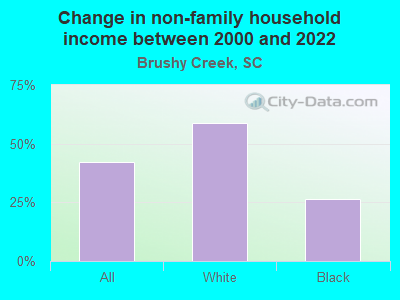
Change in median non-family income between 2000 and 2022:| Brushy Creek, South Carolina: | +42.3% |
| State: | +78.7% |
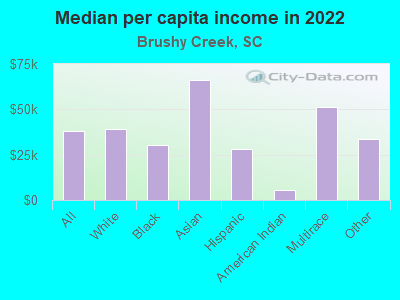
Median per capita income in Brushy Creek in 2022:| Brushy Creek: | $38,279 |
| South Carolina: | $36,675 |
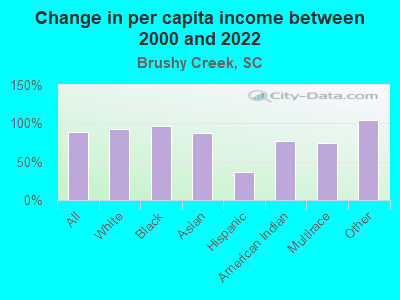
Change in median per capita income between 2000 and 2022:| Brushy Creek, South Carolina: | +89.4% |
| South Carolina: | +95.1% |
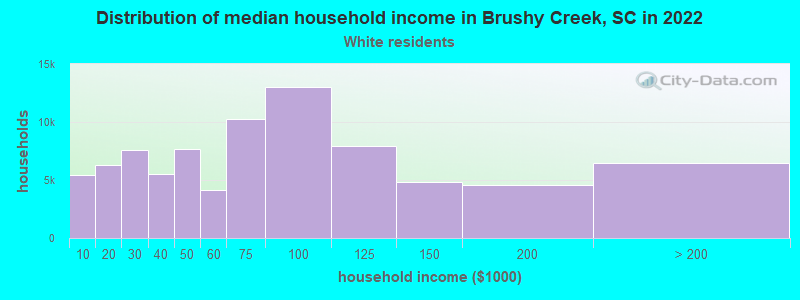
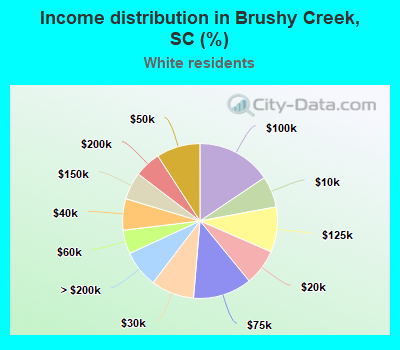
Income statistics for White residents
Median household income in Brushy Creek, SC in 2022:| Brushy Creek: | $84,517 |
| South Carolina: | $73,516 |
Change in median household income between 2000 and 2022:| Brushy Creek, South Carolina: | +76.5% |
| State: | +74.8% |
Number of households with income < $10k:| Brushy Creek: | 6.5% (5,452) |
| South Carolina: | 4.8% (68,379) |
Number of households with income $10k - 20k:| Brushy Creek: | 7.6% (6,329) |
| State: | 5.9% (85,105) |
Number of households with income $20k - 30k:| Brushy Creek: | 9.0% (7,548) |
| South Carolina: | 7.1% (101,178) |
Number of households with income $30k - 40k:| Brushy Creek: | 6.6% (5,485) |
| State: | 8.0% (114,877) |
Number of households with income $40k - 50k:| Brushy Creek: | 9.1% (7,660) |
| State: | 7.9% (112,749) |
Number of households with income $50k - 60k:| Brushy Creek: | 5.0% (4,153) |
| South Carolina: | 7.1% (101,835) |
Number of households with income $60k - 75k:| Brushy Creek: | 12.3% (10,266) |
| State: | 10.2% (145,879) |
Number of households with income $75k - 100k:| Brushy Creek: | 15.6% (13,038) |
| State: | 14.0% (200,068) |
Number of households with income $100k - 125k:| Brushy Creek: | 9.4% (7,908) |
| State: | 10.4% (148,542) |
Number of households with income $125k - 150k:| Brushy Creek: | 5.7% (4,792) |
| State: | 7.3% (105,118) |
Number of households with income $150k - 200k:| Brushy Creek: | 5.5% (4,588) |
| State: | 8.0% (114,506) |
Number of households with income > $200k:| Brushy Creek: | 7.8% (6,502) |
| South Carolina: | 9.3% (133,550) |
Aggregate household income in Brushy Creek in 2022: $1,068,552,518
Median family income in Brushy Creek in 2022:| Brushy Creek: | $90,157 |
| State: | $90,709 |
Number of families with income < $10k:| Brushy Creek: | 2.5% (181) |
| State: | 2.4% (22,376) |
Number of families with income $10k - 20k:| Brushy Creek: | 1.8% (130) |
| State: | 3.0% (28,325) |
Number of families with income $20k - 30k:| Brushy Creek: | 4.7% (339) |
| South Carolina: | 4.4% (42,131) |
Number of families with income $30k - 40k:| Brushy Creek: | 4.5% (321) |
| State: | 6.1% (57,510) |
Number of families with income $40k - 50k:| Brushy Creek: | 7.3% (523) |
| State: | 7.0% (66,712) |
Number of families with income $50k - 60k:| Brushy Creek: | 5.1% (363) |
| South Carolina: | 6.6% (62,489) |
Number of families with income $60k - 75k:| Brushy Creek: | 15.1% (1,079) |
| State: | 10.0% (94,724) |
Number of families with income $75k - 100k:| Brushy Creek: | 25.2% (1,809) |
| State: | 15.5% (147,207) |
Number of families with income $100k - 125k:| Brushy Creek: | 13.9% (1,000) |
| South Carolina: | 12.5% (118,160) |
Number of families with income $125k - 150k:| Brushy Creek: | 7.5% (540) |
| South Carolina: | 9.5% (90,395) |
Number of families with income $150k - 200k:| Brushy Creek: | 6.6% (472) |
| State: | 10.6% (100,043) |
Number of families with income > $200k:| Brushy Creek: | 5.7% (411) |
| State: | 12.4% (117,500) |
Median non-family income in Brushy Creek in 2022:| Brushy Creek: | $32,064 |
| State: | $42,596 |
Change in median non-family income between 2000 and 2022:| Brushy Creek, South Carolina: | +58.7% |
| State: | +74.9% |
Median per capita income in Brushy Creek in 2022:| Brushy Creek: | $38,953 |
| State: | $42,728 |
Change in median per capita income between 2000 and 2022:| Brushy Creek, South Carolina: | +91.5% |
| South Carolina: | +93.4% |
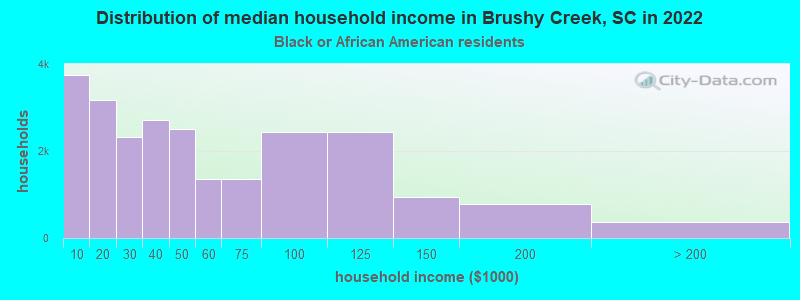
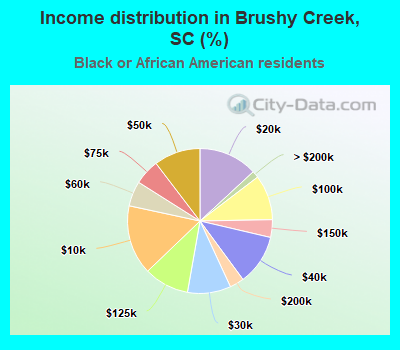
Income statistics for Black or African American residents
Median household income in Brushy Creek, SC in 2022:| Brushy Creek: | $77,516 |
| State: | $44,187 |
Change in median household income between 2000 and 2022:| Brushy Creek, South Carolina: | +52.9% |
| State: | +76.5% |
Number of households with income < $10k:| Brushy Creek: | 15.5% (3,742) |
| State: | 10.0% (52,303) |
Number of households with income $10k - 20k:| Brushy Creek: | 13.1% (3,164) |
| State: | 13.4% (69,913) |
Number of households with income $20k - 30k:| Brushy Creek: | 9.7% (2,329) |
| South Carolina: | 10.4% (54,216) |
Number of households with income $30k - 40k:| Brushy Creek: | 11.2% (2,710) |
| State: | 12.0% (62,722) |
Number of households with income $40k - 50k:| Brushy Creek: | 10.4% (2,497) |
| South Carolina: | 9.2% (47,773) |
Number of households with income $50k - 60k:| Brushy Creek: | 5.6% (1,346) |
| State: | 8.3% (43,083) |
Number of households with income $60k - 75k:| Brushy Creek: | 5.7% (1,365) |
| South Carolina: | 9.3% (48,640) |
Number of households with income $75k - 100k:| Brushy Creek: | 10.1% (2,426) |
| State: | 12.2% (63,723) |
Number of households with income $100k - 125k:| Brushy Creek: | 10.1% (2,426) |
| State: | 6.4% (33,117) |
Number of households with income $125k - 150k:| Brushy Creek: | 4.0% (952) |
| State: | 3.2% (16,465) |
Number of households with income $150k - 200k:| Brushy Creek: | 3.2% (771) |
| South Carolina: | 3.2% (16,672) |
Number of households with income > $200k:| Brushy Creek: | 1.5% (364) |
| State: | 2.3% (12,213) |
Aggregate household income in Brushy Creek in 2022: $34,586,551
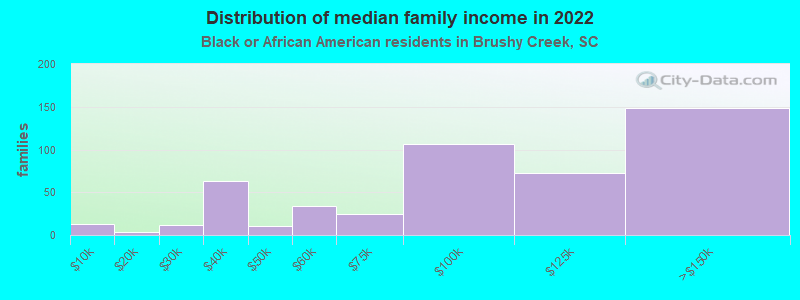
Median family income in Brushy Creek in 2022:| Brushy Creek: | $83,843 |
| State: | $54,267 |
Number of families with income < $10k:| Brushy Creek: | 2.6% (13) |
| South Carolina: | 7.3% (23,752) |
Number of families with income $10k - 20k:| Brushy Creek: | 0.9% (4) |
| State: | 8.5% (27,789) |
Number of families with income $20k - 30k:| Brushy Creek: | 2.5% (12) |
| South Carolina: | 9.4% (30,766) |
Number of families with income $30k - 40k:| Brushy Creek: | 13.0% (63) |
| State: | 11.6% (37,651) |
Number of families with income $40k - 50k:| Brushy Creek: | 2.0% (10) |
| State: | 9.5% (30,858) |
Number of families with income $50k - 60k:| Brushy Creek: | 6.9% (34) |
| State: | 8.7% (28,419) |
Number of families with income $60k - 75k:| Brushy Creek: | 5.0% (25) |
| State: | 9.6% (31,402) |
Number of families with income $75k - 100k:| Brushy Creek: | 21.7% (106) |
| State: | 15.2% (49,441) |
Number of families with income $100k - 125k:| Brushy Creek: | 14.7% (72) |
| State: | 8.6% (27,974) |
Number of families with income $125k - 150k:| Brushy Creek: | 30.6% (149) |
| South Carolina: | 3.9% (12,743) |
Median non-family income in Brushy Creek in 2022:| Brushy Creek: | $20,245 |
| South Carolina: | $28,585 |
Change in median non-family income between 2000 and 2022:| Brushy Creek, South Carolina: | +26.5% |
| South Carolina: | +100.5% |
Median per capita income in Brushy Creek in 2022:| Brushy Creek: | $30,511 |
| South Carolina: | $24,863 |
Change in median per capita income between 2000 and 2022:| Brushy Creek, South Carolina: | +96.9% |
| South Carolina: | +111.1% |
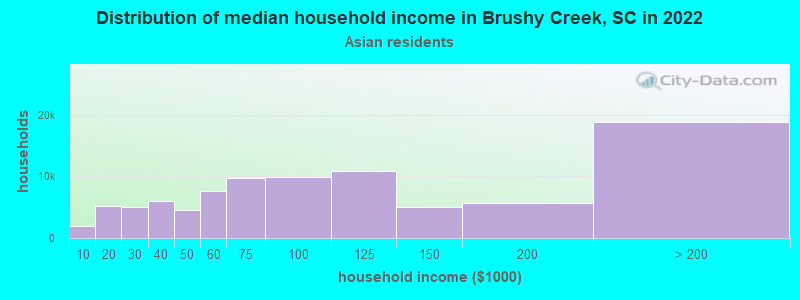
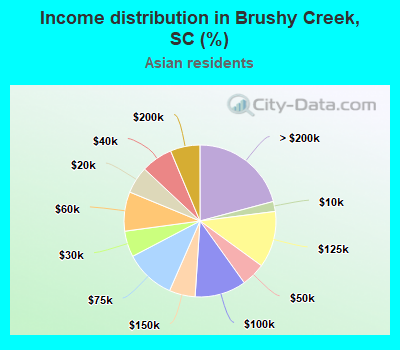
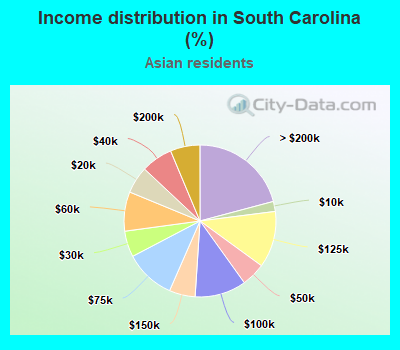
Income statistics for Asian residents
Median household income in Brushy Creek, SC in 2022:| Brushy Creek: | $303,779 |
| State: | $87,807 |
Change in median household income between 2000 and 2022:| Brushy Creek, South Carolina: | +141.8% |
| State: | +99.9% |
Number of households with income < $10k:| Brushy Creek: | 2.1% (1,934) |
| South Carolina: | 2.1% (676) |
Number of households with income $10k - 20k:| Brushy Creek: | 5.8% (5,201) |
| State: | 5.8% (1,818) |
Number of households with income $20k - 30k:| Brushy Creek: | 5.5% (5,007) |
| State: | 5.5% (1,750) |
Number of households with income $30k - 40k:| Brushy Creek: | 6.7% (6,046) |
| South Carolina: | 6.7% (2,113) |
Number of households with income $40k - 50k:| Brushy Creek: | 5.1% (4,592) |
| State: | 5.1% (1,605) |
Number of households with income $50k - 60k:| Brushy Creek: | 8.4% (7,562) |
| South Carolina: | 8.4% (2,643) |
Number of households with income $60k - 75k:| Brushy Creek: | 10.8% (9,708) |
| State: | 10.8% (3,393) |
Number of households with income $75k - 100k:| Brushy Creek: | 10.9% (9,871) |
| State: | 10.9% (3,450) |
Number of households with income $100k - 125k:| Brushy Creek: | 12.0% (10,861) |
| State: | 12.0% (3,796) |
Number of households with income $125k - 150k:| Brushy Creek: | 5.5% (4,984) |
| State: | 5.5% (1,742) |
Number of households with income $150k - 200k:| Brushy Creek: | 6.3% (5,694) |
| State: | 6.3% (1,990) |
Number of households with income > $200k:| Brushy Creek: | 20.9% (18,830) |
| South Carolina: | 20.9% (6,581) |
Aggregate household income in Brushy Creek in 2022: $4,309,786
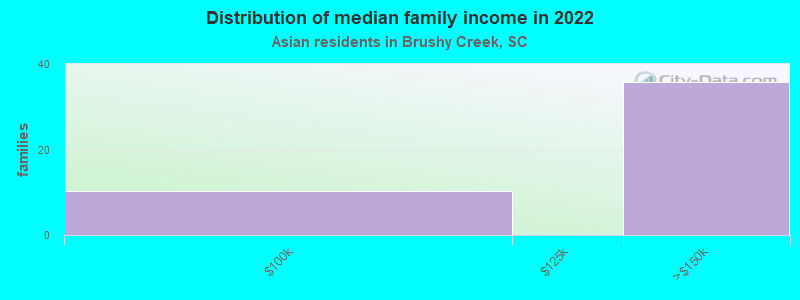
Median family income in Brushy Creek in 2022:| Brushy Creek: | $235,604 |
| State: | $110,614 |
Number of families with income $75k - 100k:| Brushy Creek: | 22.2% (10) |
| State: | 12.4% (2,645) |
Number of families with income $125k - 150k:| Brushy Creek: | 77.8% (36) |
| South Carolina: | 6.5% (1,394) |
Median per capita income in Brushy Creek in 2022:| Brushy Creek: | $66,413 |
| South Carolina: | $48,909 |
Change in median per capita income between 2000 and 2022:| Brushy Creek, South Carolina: | +88.0% |
| State: | +138.1% |
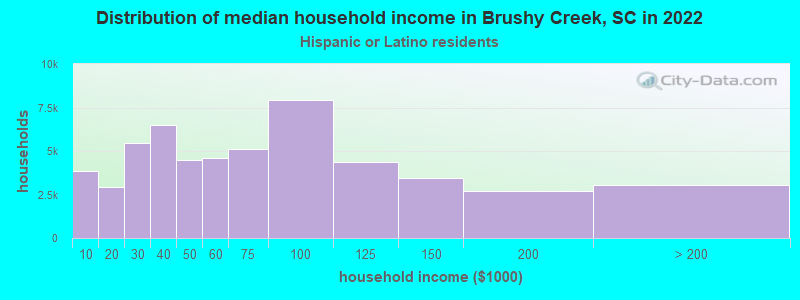
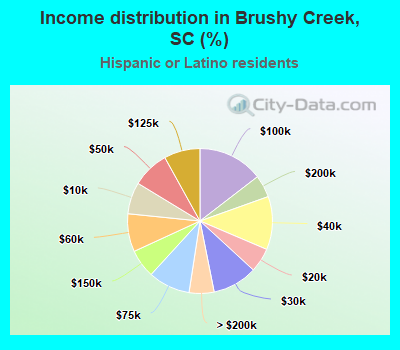
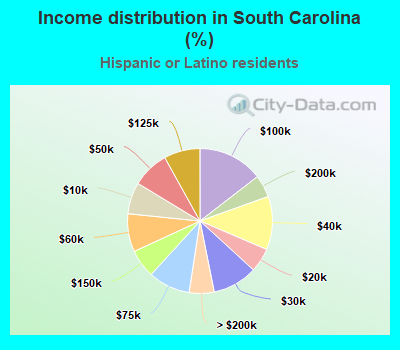
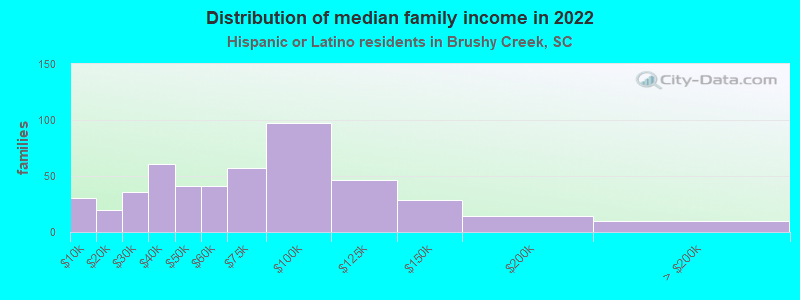
Income statistics for Hispanic or Latino residents
Median household income in Brushy Creek, SC in 2022:| Brushy Creek: | $84,860 |
| State: | $58,486 |
Change in median household income between 2000 and 2022:| Brushy Creek, South Carolina: | +144.6% |
| State: | +84.8% |
Number of households with income < $10k:| Brushy Creek: | 7.1% (3,854) |
| State: | 7.1% (7,036) |
Number of households with income $10k - 20k:| Brushy Creek: | 5.4% (2,948) |
| State: | 5.4% (5,379) |
Number of households with income $20k - 30k:| Brushy Creek: | 10.0% (5,466) |
| State: | 10.0% (9,993) |
Number of households with income $30k - 40k:| Brushy Creek: | 11.9% (6,472) |
| South Carolina: | 11.9% (11,872) |
Number of households with income $40k - 50k:| Brushy Creek: | 8.3% (4,501) |
| State: | 8.3% (8,239) |
Number of households with income $50k - 60k:| Brushy Creek: | 8.5% (4,623) |
| State: | 8.5% (8,475) |
Number of households with income $60k - 75k:| Brushy Creek: | 9.4% (5,097) |
| State: | 9.4% (9,330) |
Number of households with income $75k - 100k:| Brushy Creek: | 14.6% (7,931) |
| State: | 14.5% (14,491) |
Number of households with income $100k - 125k:| Brushy Creek: | 8.0% (4,377) |
| State: | 8.1% (8,026) |
Number of households with income $125k - 150k:| Brushy Creek: | 6.3% (3,447) |
| South Carolina: | 6.3% (6,313) |
Number of households with income $150k - 200k:| Brushy Creek: | 5.0% (2,704) |
| State: | 5.0% (4,963) |
Number of households with income > $200k:| Brushy Creek: | 5.6% (3,025) |
| State: | 5.6% (5,548) |
Aggregate household income in Brushy Creek in 2022: $24,639,058
Median family income in Brushy Creek in 2022:| Brushy Creek: | $188,291 |
| South Carolina: | $62,837 |
Number of families with income < $10k:| Brushy Creek: | 6.3% (30) |
| State: | 6.1% (4,418) |
Number of families with income $10k - 20k:| Brushy Creek: | 4.1% (20) |
| State: | 4.8% (3,459) |
Number of families with income $20k - 30k:| Brushy Creek: | 7.5% (36) |
| State: | 8.4% (6,079) |
Number of families with income $30k - 40k:| Brushy Creek: | 12.7% (61) |
| South Carolina: | 12.3% (8,946) |
Number of families with income $40k - 50k:| Brushy Creek: | 8.5% (41) |
| State: | 8.9% (6,476) |
Number of families with income $50k - 60k:| Brushy Creek: | 8.4% (41) |
| South Carolina: | 7.1% (5,144) |
Number of families with income $60k - 75k:| Brushy Creek: | 11.9% (57) |
| South Carolina: | 9.5% (6,918) |
Number of families with income $75k - 100k:| Brushy Creek: | 20.1% (97) |
| State: | 15.0% (10,886) |
Number of families with income $100k - 125k:| Brushy Creek: | 9.6% (47) |
| South Carolina: | 9.5% (6,862) |
Number of families with income $125k - 150k:| Brushy Creek: | 5.9% (28) |
| State: | 6.7% (4,870) |
Number of families with income $150k - 200k:| Brushy Creek: | 3.0% (14) |
| State: | 6.0% (4,384) |
Number of families with income > $200k:| Brushy Creek: | 2.0% (10) |
| State: | 5.6% (4,034) |
Median per capita income in Brushy Creek in 2022:| Brushy Creek: | $28,390 |
| South Carolina: | $23,692 |
Change in median per capita income between 2000 and 2022:| Brushy Creek, South Carolina: | +37.0% |
| South Carolina: | +95.1% |
Income statistics for American Indian and Alaska Native residents
Number of households with income < $10k:| Brushy Creek: | 6.0% (77) |
| South Carolina: | 6.0% (394) |
Number of households with income $10k - 20k:| Brushy Creek: | 15.2% (195) |
| South Carolina: | 15.2% (994) |
Number of households with income $20k - 30k:| Brushy Creek: | 7.0% (89) |
| State: | 6.9% (454) |
Number of households with income $30k - 40k:| Brushy Creek: | 10.8% (138) |
| State: | 10.8% (705) |
Number of households with income $40k - 50k:| Brushy Creek: | 8.4% (108) |
| State: | 8.5% (555) |
Number of households with income $50k - 60k:| Brushy Creek: | 9.2% (118) |
| State: | 9.2% (601) |
Number of households with income $60k - 75k:| Brushy Creek: | 5.8% (74) |
| State: | 5.8% (380) |
Number of households with income $75k - 100k:| Brushy Creek: | 10.6% (136) |
| State: | 10.7% (697) |
Number of households with income $100k - 125k:| Brushy Creek: | 12.6% (161) |
| State: | 12.6% (822) |
Number of households with income $125k - 150k:| Brushy Creek: | 3.5% (45) |
| South Carolina: | 3.5% (228) |
Number of households with income $150k - 200k:| Brushy Creek: | 3.6% (46) |
| South Carolina: | 3.6% (234) |
Number of households with income > $200k:| Brushy Creek: | 7.3% (93) |
| State: | 7.3% (477) |
Median per capita income in Brushy Creek in 2022:| Brushy Creek: | $5,314 |
| State: | $26,654 |
Change in median per capita income between 2000 and 2022:| Brushy Creek, South Carolina: | +77.1% |
| State: | +73.9% |
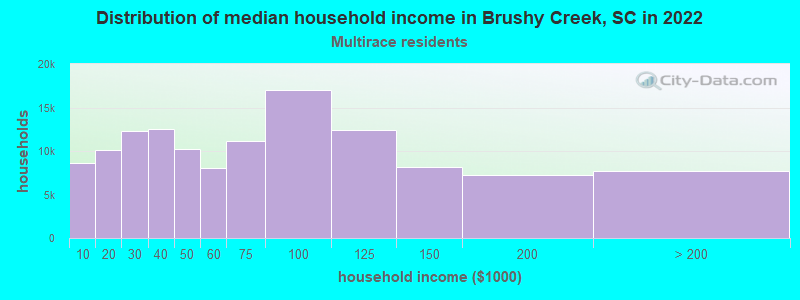
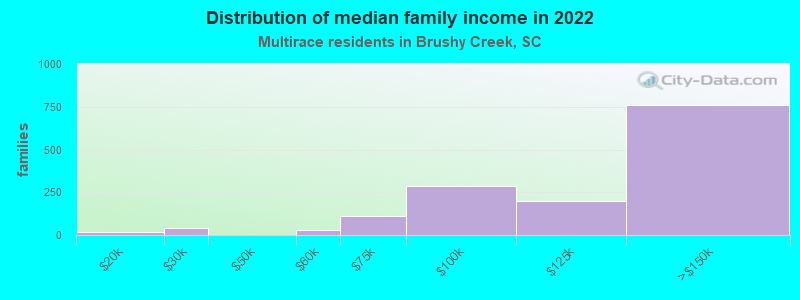
Income statistics for Multirace residents
Median household income in Brushy Creek, SC in 2022:| Brushy Creek: | $56,127 |
| State: | $61,314 |
Number of households with income < $10k:| Brushy Creek: | 6.9% (8,621) |
| State: | 6.9% (6,974) |
Number of households with income $10k - 20k:| Brushy Creek: | 8.1% (10,109) |
| State: | 8.0% (8,052) |
Number of households with income $20k - 30k:| Brushy Creek: | 9.8% (12,284) |
| State: | 9.9% (9,972) |
Number of households with income $30k - 40k:| Brushy Creek: | 10.0% (12,515) |
| South Carolina: | 10.0% (10,121) |
Number of households with income $40k - 50k:| Brushy Creek: | 8.1% (10,183) |
| State: | 8.1% (8,188) |
Number of households with income $50k - 60k:| Brushy Creek: | 6.4% (7,996) |
| State: | 6.5% (6,530) |
Number of households with income $60k - 75k:| Brushy Creek: | 8.9% (11,171) |
| South Carolina: | 8.9% (9,021) |
Number of households with income $75k - 100k:| Brushy Creek: | 13.6% (17,014) |
| State: | 13.4% (13,544) |
Number of households with income $100k - 125k:| Brushy Creek: | 9.9% (12,363) |
| South Carolina: | 9.8% (9,916) |
Number of households with income $125k - 150k:| Brushy Creek: | 6.5% (8,159) |
| State: | 6.6% (6,657) |
Number of households with income $150k - 200k:| Brushy Creek: | 5.8% (7,273) |
| South Carolina: | 5.9% (5,979) |
Number of households with income > $200k:| Brushy Creek: | 6.1% (7,700) |
| South Carolina: | 6.2% (6,266) |
Aggregate household income in Brushy Creek in 2022: $55,652,374
Median family income in Brushy Creek in 2022:| Brushy Creek: | $82,844 |
| State: | $72,647 |
Number of families with income $10k - 20k:| Brushy Creek: | 1.3% (18) |
| State: | 5.7% (3,829) |
Number of families with income $20k - 30k:| Brushy Creek: | 2.7% (39) |
| State: | 8.6% (5,823) |
Number of families with income $50k - 60k:| Brushy Creek: | 2.1% (31) |
| State: | 5.7% (3,867) |
Number of families with income $60k - 75k:| Brushy Creek: | 7.8% (113) |
| State: | 9.9% (6,674) |
Number of families with income $75k - 100k:| Brushy Creek: | 19.8% (287) |
| State: | 15.0% (10,101) |
Number of families with income $100k - 125k:| Brushy Creek: | 13.7% (199) |
| South Carolina: | 11.6% (7,846) |
Number of families with income $125k - 150k:| Brushy Creek: | 52.6% (763) |
| South Carolina: | 7.0% (4,709) |
Median per capita income in Brushy Creek in 2022:| Brushy Creek: | $51,277 |
| South Carolina: | $26,391 |
Change in median per capita income between 2000 and 2022:| Brushy Creek, South Carolina: | +74.0% |
| State: | +120.8% |
Income statistics for other residents
Number of households with income < $10k:| Brushy Creek: | 6.3% (6) |
| South Carolina: | 4.5% (1,945) |
Number of households with income $10k - 20k:| Brushy Creek: | 7.4% (7) |
| State: | 6.9% (2,977) |
Number of households with income $20k - 30k:| Brushy Creek: | 11.6% (11) |
| South Carolina: | 9.2% (3,988) |
Number of households with income $30k - 40k:| Brushy Creek: | 10.5% (10) |
| State: | 11.8% (5,124) |
Number of households with income $40k - 50k:| Brushy Creek: | 11.6% (11) |
| State: | 12.3% (5,309) |
Number of households with income $50k - 60k:| Brushy Creek: | 8.4% (8) |
| State: | 9.7% (4,196) |
Number of households with income $60k - 75k:| Brushy Creek: | 10.5% (10) |
| South Carolina: | 10.5% (4,549) |
Number of households with income $75k - 100k:| Brushy Creek: | 12.6% (12) |
| State: | 14.1% (6,099) |
Number of households with income $100k - 125k:| Brushy Creek: | 6.3% (6) |
| State: | 6.3% (2,747) |
Number of households with income $125k - 150k:| Brushy Creek: | 7.4% (7) |
| State: | 7.0% (3,024) |
Number of households with income $150k - 200k:| Brushy Creek: | 4.2% (4) |
| State: | 4.6% (1,982) |
Number of households with income > $200k:| Brushy Creek: | 3.2% (3) |
| State: | 3.2% (1,365) |
Aggregate household income in Brushy Creek in 2022: $4,995,566
Median family income in Brushy Creek in 2022:| Brushy Creek: | $147,268 |
| State: | $60,279 |
Number of families with income $75k - 100k:| Brushy Creek: | 100.0% (134) |
| South Carolina: | 14.0% (4,390) |
Median per capita income in Brushy Creek in 2022:| Brushy Creek: | $33,427 |
| State: | $22,305 |
Change in median per capita income between 2000 and 2022:| Brushy Creek, South Carolina: | +104.7% |
| State: | +113.0% |