Boylston, Massachusetts (MA) income map, earnings map, and wages data
The median household income in Boylston, MA in 2022 was $121,985, which was 22.5% greater than the median annual income of $94,488 across the entire state of Massachusetts. Compared to the median income of $67,703 in 2000 this represents an increase of 44.5%. The per capita income in 2022 was $62,927, which means an increase of 48.7% compared to 2000 when it was $32,274.
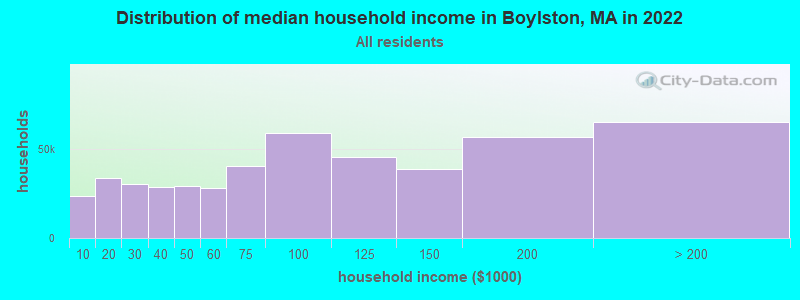
Income statistics for all residents
Median household income in Boylston, MA in 2022:| Boylston: | $121,985 |
| State: | $94,488 |
Change in median household income between 2000 and 2022:| Boylston, Massachusetts: | +80.2% |
| State: | +87.1% |
Number of households with income < $10k:| Boylston: | 4.9% (23,466) |
| State: | 5.2% (146,170) |
Number of households with income $10k - 20k:| Boylston: | 7.0% (33,480) |
| State: | 6.4% (180,001) |
Number of households with income $20k - 30k:| Boylston: | 6.4% (30,492) |
| State: | 5.6% (156,667) |
Number of households with income $30k - 40k:| Boylston: | 5.9% (28,380) |
| Massachusetts: | 5.6% (157,168) |
Number of households with income $40k - 50k:| Boylston: | 6.1% (29,062) |
| State: | 5.4% (151,455) |
Number of households with income $50k - 60k:| Boylston: | 5.8% (27,826) |
| State: | 5.1% (142,726) |
Number of households with income $60k - 75k:| Boylston: | 8.4% (40,379) |
| State: | 7.6% (212,203) |
Number of households with income $75k - 100k:| Boylston: | 12.3% (58,730) |
| State: | 11.3% (317,064) |
Number of households with income $100k - 125k:| Boylston: | 9.5% (45,586) |
| Massachusetts: | 9.7% (270,603) |
Number of households with income $125k - 150k:| Boylston: | 8.1% (38,954) |
| State: | 8.0% (223,140) |
Number of households with income $150k - 200k:| Boylston: | 11.9% (56,735) |
| Massachusetts: | 11.0% (308,695) |
Number of households with income > $200k:| Boylston: | 13.6% (65,032) |
| State: | 19.0% (531,884) |
Aggregate household income in Boylston in 2022: $2,295,463,069
Median family income in Boylston in 2022:| Boylston: | $142,793 |
| Massachusetts: | $120,263 |
Median non-family income in Boylston in 2022:| Boylston: | $64,412 |
| State: | $55,979 |
Change in median non-family income between 2000 and 2022:| Boylston, Massachusetts: | +85.7% |
| State: | +88.0% |
Median per capita income in Boylston in 2022:| Boylston: | $62,927 |
| State: | $54,025 |
Change in median per capita income between 2000 and 2022:| Boylston, Massachusetts: | +95.0% |
| Massachusetts: | +108.2% |
Income statistics for White residents
Median household income in Boylston, MA in 2022:| Boylston: | $125,566 |
| State: | $101,391 |
Change in median household income between 2000 and 2022:| Boylston, Massachusetts: | +85.1% |
| State: | +93.3% |
Number of households with income < $10k:| Boylston: | 4.6% (16,771) |
| Massachusetts: | 4.4% (91,120) |
Number of households with income $10k - 20k:| Boylston: | 6.5% (23,982) |
| State: | 5.9% (122,055) |
Number of households with income $20k - 30k:| Boylston: | 6.1% (22,238) |
| Massachusetts: | 5.1% (105,311) |
Number of households with income $30k - 40k:| Boylston: | 5.5% (20,065) |
| State: | 5.3% (110,239) |
Number of households with income $40k - 50k:| Boylston: | 5.6% (20,545) |
| State: | 5.0% (104,636) |
Number of households with income $50k - 60k:| Boylston: | 5.4% (19,922) |
| State: | 4.8% (99,486) |
Number of households with income $60k - 75k:| Boylston: | 8.4% (30,852) |
| State: | 7.5% (155,124) |
Number of households with income $75k - 100k:| Boylston: | 12.2% (44,836) |
| State: | 11.4% (236,252) |
Number of households with income $100k - 125k:| Boylston: | 10.1% (37,258) |
| State: | 9.9% (204,731) |
Number of households with income $125k - 150k:| Boylston: | 8.4% (30,727) |
| Massachusetts: | 8.5% (175,324) |
Number of households with income $150k - 200k:| Boylston: | 12.5% (45,776) |
| Massachusetts: | 11.7% (242,980) |
Number of households with income > $200k:| Boylston: | 14.7% (54,144) |
| Massachusetts: | 20.5% (425,966) |
Aggregate household income in Boylston in 2022: $1,858,168,065
Median family income in Boylston in 2022:| Boylston: | $150,347 |
| Massachusetts: | $133,153 |
Number of families with income < $10k:| Boylston: | 0.4% (6) |
| Massachusetts: | 2.0% (25,038) |
Number of families with income $10k - 20k:| Boylston: | 0.8% (12) |
| State: | 2.1% (26,403) |
Number of families with income $20k - 30k:| Boylston: | 1.6% (24) |
| State: | 2.6% (32,525) |
Number of families with income $30k - 40k:| Boylston: | 2.8% (42) |
| Massachusetts: | 3.9% (48,079) |
Number of families with income $40k - 50k:| Boylston: | 2.0% (29) |
| State: | 3.8% (46,908) |
Number of families with income $50k - 60k:| Boylston: | 2.5% (37) |
| State: | 3.8% (46,476) |
Number of families with income $60k - 75k:| Boylston: | 6.2% (93) |
| Massachusetts: | 6.4% (79,040) |
Number of families with income $75k - 100k:| Boylston: | 8.4% (126) |
| State: | 11.1% (137,395) |
Number of families with income $100k - 125k:| Boylston: | 15.9% (237) |
| Massachusetts: | 11.1% (136,771) |
Number of families with income $125k - 150k:| Boylston: | 10.5% (156) |
| State: | 10.0% (123,709) |
Number of families with income $150k - 200k:| Boylston: | 22.4% (335) |
| State: | 14.7% (181,602) |
Number of families with income > $200k:| Boylston: | 26.6% (398) |
| State: | 28.5% (351,887) |
Median non-family income in Boylston in 2022:| Boylston: | $66,602 |
| State: | $59,323 |
Change in median non-family income between 2000 and 2022:| Boylston, Massachusetts: | +92.0% |
| State: | +94.3% |
Median per capita income in Boylston in 2022:| Boylston: | $66,175 |
| Massachusetts: | $60,804 |
Change in median per capita income between 2000 and 2022:| Boylston, Massachusetts: | +105.3% |
| State: | +118.7% |
Income statistics for Black or African American residents
Median household income in Boylston, MA in 2022:| Boylston: | $99,757 |
| State: | $63,189 |
Change in median household income between 2000 and 2022:| Boylston, Massachusetts: | +69.8% |
| Massachusetts: | +87.4% |
Number of households with income < $10k:| Boylston: | 7.3% (1,892) |
| Massachusetts: | 9.1% (15,797) |
Number of households with income $10k - 20k:| Boylston: | 11.9% (3,092) |
| State: | 9.4% (16,267) |
Number of households with income $20k - 30k:| Boylston: | 9.8% (2,547) |
| State: | 7.8% (13,520) |
Number of households with income $30k - 40k:| Boylston: | 3.3% (845) |
| State: | 8.3% (14,412) |
Number of households with income $40k - 50k:| Boylston: | 13.5% (3,503) |
| State: | 7.9% (13,790) |
Number of households with income $50k - 60k:| Boylston: | 5.8% (1,498) |
| State: | 5.8% (10,041) |
Number of households with income $60k - 75k:| Boylston: | 10.7% (2,786) |
| State: | 8.5% (14,822) |
Number of households with income $75k - 100k:| Boylston: | 13.0% (3,384) |
| Massachusetts: | 11.0% (19,122) |
Number of households with income $100k - 125k:| Boylston: | 7.5% (1,953) |
| State: | 8.4% (14,575) |
Number of households with income $125k - 150k:| Boylston: | 5.0% (1,290) |
| State: | 6.0% (10,429) |
Number of households with income $150k - 200k:| Boylston: | 7.3% (1,882) |
| State: | 7.2% (12,539) |
Number of households with income > $200k:| Boylston: | 4.9% (1,282) |
| State: | 10.5% (18,185) |
Aggregate household income in Boylston in 2022: $3,357,374
Median family income in Boylston in 2022:| Boylston: | $96,393 |
| State: | $79,815 |
Number of families with income $50k - 60k:| Boylston: | 25.5% (7) |
| Massachusetts: | 6.4% (6,986) |
Number of families with income $60k - 75k:| Boylston: | 74.5% (20) |
| State: | 7.9% (8,699) |
Median per capita income in Boylston in 2022:| Boylston: | $56,074 |
| State: | $33,524 |
Change in median per capita income between 2000 and 2022:| Boylston, Massachusetts: | +95.7% |
| Massachusetts: | +109.4% |
Income statistics for Asian residents
Median household income in Boylston, MA in 2022:| Boylston: | $380,221 |
| State: | $117,855 |
Change in median household income between 2000 and 2022:| Boylston, Massachusetts: | +149.6% |
| State: | +129.9% |
Number of households with income < $10k:| Boylston: | 5.7% (2,411) |
| State: | 6.8% (11,982) |
Number of households with income $10k - 20k:| Boylston: | 5.8% (2,423) |
| Massachusetts: | 4.8% (8,376) |
Number of households with income $20k - 30k:| Boylston: | 1.9% (801) |
| State: | 3.7% (6,558) |
Number of households with income $30k - 40k:| Boylston: | 3.5% (1,490) |
| Massachusetts: | 3.3% (5,748) |
Number of households with income $40k - 50k:| Boylston: | 4.9% (2,071) |
| Massachusetts: | 4.1% (7,192) |
Number of households with income $50k - 60k:| Boylston: | 3.5% (1,473) |
| State: | 5.0% (8,734) |
Number of households with income $60k - 75k:| Boylston: | 4.3% (1,825) |
| Massachusetts: | 5.8% (10,203) |
Number of households with income $75k - 100k:| Boylston: | 6.1% (2,563) |
| State: | 8.6% (15,154) |
Number of households with income $100k - 125k:| Boylston: | 9.7% (4,099) |
| State: | 10.8% (18,942) |
Number of households with income $125k - 150k:| Boylston: | 8.1% (3,395) |
| State: | 8.0% (14,037) |
Number of households with income $150k - 200k:| Boylston: | 21.1% (8,870) |
| Massachusetts: | 12.5% (21,856) |
Number of households with income > $200k:| Boylston: | 25.4% (10,675) |
| Massachusetts: | 26.6% (46,694) |
Aggregate household income in Boylston in 2022: $6,680,982
Median family income in Boylston in 2022:| Boylston: | $408,075 |
| Massachusetts: | $140,113 |
Number of families with income $150k - 200k:| Boylston: | 100.0% (65) |
| Massachusetts: | 13.2% (15,478) |
Median per capita income in Boylston in 2022:| Boylston: | $151,755 |
| State: | $58,900 |
Income statistics for Hispanic or Latino residents
Number of households with income < $10k:| Boylston: | 8.1% (4,717) |
| State: | 8.8% (25,307) |
Number of households with income $10k - 20k:| Boylston: | 10.5% (6,066) |
| State: | 10.0% (28,653) |
Number of households with income $20k - 30k:| Boylston: | 10.3% (5,999) |
| State: | 8.8% (25,189) |
Number of households with income $30k - 40k:| Boylston: | 9.5% (5,519) |
| State: | 7.2% (20,822) |
Number of households with income $40k - 50k:| Boylston: | 7.1% (4,127) |
| State: | 7.2% (20,817) |
Number of households with income $50k - 60k:| Boylston: | 8.0% (4,634) |
| State: | 6.5% (18,748) |
Number of households with income $60k - 75k:| Boylston: | 11.1% (6,422) |
| Massachusetts: | 8.8% (25,390) |
Number of households with income $75k - 100k:| Boylston: | 14.1% (8,172) |
| Massachusetts: | 12.0% (34,488) |
Number of households with income $100k - 125k:| Boylston: | 5.7% (3,299) |
| State: | 8.6% (24,599) |
Number of households with income $125k - 150k:| Boylston: | 8.8% (5,123) |
| State: | 6.2% (17,743) |
Number of households with income $150k - 200k:| Boylston: | 3.6% (2,060) |
| State: | 7.3% (21,017) |
Number of households with income > $200k:| Boylston: | 3.2% (1,847) |
| State: | 8.6% (24,606) |
Median per capita income in Boylston in 2022:| Boylston: | $39,274 |
| State: | $28,993 |
Change in median per capita income between 2000 and 2022:| Boylston, Massachusetts: | +110.9% |
| State: | +142.4% |
Income statistics for Multirace residents
Median household income in Boylston, MA in 2022:| Boylston: | $235,168 |
| State: | $71,552 |
Change in median household income between 2000 and 2022:| Boylston, Massachusetts: | +84.7% |
| State: | +109.0% |
Number of households with income < $10k:| Boylston: | 7.4% (8,758) |
| Massachusetts: | 6.6% (15,127) |
Number of households with income $10k - 20k:| Boylston: | 10.3% (12,170) |
| State: | 9.2% (21,158) |
Number of households with income $20k - 30k:| Boylston: | 10.2% (12,029) |
| State: | 7.8% (18,016) |
Number of households with income $30k - 40k:| Boylston: | 11.3% (13,318) |
| Massachusetts: | 7.9% (18,260) |
Number of households with income $40k - 50k:| Boylston: | 6.2% (7,303) |
| State: | 5.6% (13,027) |
Number of households with income $50k - 60k:| Boylston: | 8.7% (10,285) |
| Massachusetts: | 5.6% (12,909) |
Number of households with income $60k - 75k:| Boylston: | 8.2% (9,619) |
| State: | 9.0% (20,800) |
Number of households with income $75k - 100k:| Boylston: | 13.5% (15,899) |
| Massachusetts: | 12.1% (27,875) |
Number of households with income $100k - 125k:| Boylston: | 6.2% (7,273) |
| Massachusetts: | 8.1% (18,754) |
Number of households with income $125k - 150k:| Boylston: | 6.4% (7,567) |
| State: | 6.8% (15,621) |
Number of households with income $150k - 200k:| Boylston: | 5.9% (6,983) |
| State: | 9.4% (21,618) |
Number of households with income > $200k:| Boylston: | 5.6% (6,565) |
| State: | 12.0% (27,592) |
Aggregate household income in Boylston in 2022: $6,118,146
Median family income in Boylston in 2022:| Boylston: | $230,351 |
| State: | $78,380 |
Number of families with income $125k - 150k:| Boylston: | 100.0% (106) |
| State: | 7.2% (11,128) |
Median per capita income in Boylston in 2022:| Boylston: | $65,284 |
| State: | $34,029 |
Change in median per capita income between 2000 and 2022:| Boylston, Massachusetts: | +104.0% |
| Massachusetts: | +132.1% |
Income statistics for other residents
Number of households with income < $10k:| Boylston: | 2.6% (623) |
| Massachusetts: | 8.4% (11,559) |
Number of households with income $10k - 20k:| Boylston: | 5.7% (1,401) |
| Massachusetts: | 8.4% (11,499) |
Number of households with income $20k - 30k:| Boylston: | 6.2% (1,523) |
| State: | 9.5% (13,070) |
Number of households with income $30k - 40k:| Boylston: | 10.5% (2,565) |
| Massachusetts: | 6.0% (8,291) |
Number of households with income $40k - 50k:| Boylston: | 9.1% (2,208) |
| State: | 9.2% (12,611) |
Number of households with income $50k - 60k:| Boylston: | 9.0% (2,199) |
| Massachusetts: | 7.9% (10,879) |
Number of households with income $60k - 75k:| Boylston: | 11.0% (2,689) |
| State: | 7.5% (10,239) |
Number of households with income $75k - 100k:| Boylston: | 18.6% (4,537) |
| State: | 13.1% (18,032) |
Number of households with income $100k - 125k:| Boylston: | 6.5% (1,576) |
| State: | 9.6% (13,141) |
Number of households with income $125k - 150k:| Boylston: | 8.4% (2,043) |
| Massachusetts: | 5.0% (6,808) |
Number of households with income $150k - 200k:| Boylston: | 7.9% (1,937) |
| State: | 6.4% (8,843) |
Number of households with income > $200k:| Boylston: | 4.4% (1,076) |
| State: | 9.0% (12,396) |
Median per capita income in Boylston in 2022:| Boylston: | $57,653 |
| State: | $30,797 |