The median household income in Blue Ball, PA in 2022 was $104,209, which was 31.1% greater than the median annual income of $71,798 across the entire state of Pennsylvania. Compared to the median income of $45,507 in 2000 this represents an increase of 56.3%. The per capita income in 2022 was $55,492, which means an increase of 63.2% compared to 2000 when it was $20,398.
Whole page based on the data from 2000 / 2022 when the population of Blue Ball, Pennsylvania was 1,031 / 958
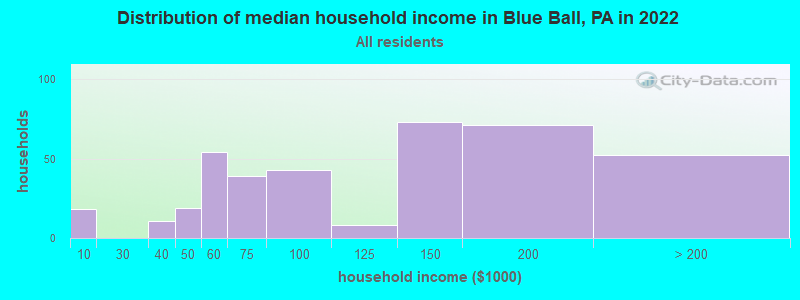
Income statistics for all residents
Median household income in Blue Ball, PA in 2022:
Blue Ball:
$104,210
State:
$71,798
Change in median household income between 2000 and 2022:
Blue Ball, Pennsylvania:
+129.0%
State:
+79.0%
Number of households with income < $10k:
Blue Ball:
4.6% (18)
State:
5.5% (291,562)
Number of households with income $10k - 20k:
Blue Ball:
0.0% (0)
State:
7.3% (384,726)
Number of households with income $20k - 30k:
Blue Ball:
0.0% (0)
State:
7.4% (389,464)
Number of households with income $30k - 40k:
Blue Ball:
2.8% (11)
Pennsylvania:
7.6% (402,138)
Number of households with income $40k - 50k:
Blue Ball:
4.9% (19)
State:
7.3% (387,945)
Number of households with income $50k - 60k:
Blue Ball:
13.9% (54)
State:
7.0% (372,468)
Number of households with income $60k - 75k:
Blue Ball:
10.1% (39)
State:
9.9% (524,786)
Number of households with income $75k - 100k:
Blue Ball:
11.1% (43)
State:
12.6% (666,253)
Number of households with income $100k - 125k:
Blue Ball:
2.1% (8)
State:
9.9% (526,402)
Number of households with income $125k - 150k:
Blue Ball:
18.8% (73)
State:
6.9% (362,702)
Number of households with income $150k - 200k:
Blue Ball:
18.3% (71)
Pennsylvania:
8.3% (440,827)
Number of households with income > $200k:
Blue Ball:
13.4% (52)
State:
10.3% (544,792)
Aggregate household income in Blue Ball in 2022: $52,414,544
Median family income in Blue Ball in 2022:
Blue Ball:
$132,142
State:
$93,029
Number of families with income $50k - 60k:
Blue Ball:
20.3% (49)
State:
6.4% (209,910)
Number of families with income $60k - 75k:
Blue Ball:
4.1% (10)
State:
9.7% (318,991)
Number of families with income $75k - 100k:
Blue Ball:
14.5% (35)
State:
14.0% (461,021)
Number of families with income $100k - 125k:
Blue Ball:
3.0% (7)
Pennsylvania:
12.2% (400,961)
Number of families with income $125k - 150k:
Blue Ball:
30.6% (74)
State:
8.8% (288,471)
Number of families with income $150k - 200k:
Blue Ball:
6.1% (15)
Pennsylvania:
11.2% (367,642)
Number of families with income > $200k:
Blue Ball:
21.4% (52)
Pennsylvania:
14.3% (470,863)
Median income for families with 0 earners:
Blue Ball:
$0
State:
$48,949
Median income for families with 1 earner:
Blue Ball:
$0
State:
$64,277
Median income for families with 2 earners:
Blue Ball:
$106,853
State:
$118,220
Median income for families with 3+ earners:
Blue Ball:
$0
State:
$150,374
Median per capita income in Blue Ball in 2022:
Blue Ball:
$55,492
State:
$41,489
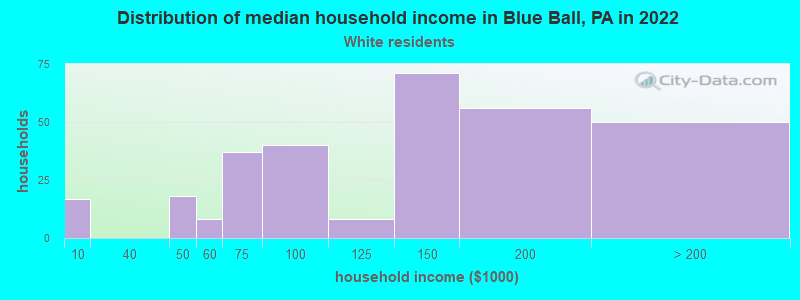
Income statistics for White residents
Median household income in Blue Ball, PA in 2022:
Blue Ball:
$131,287
State:
$76,765
Number of households with income < $10k:
Blue Ball:
5.6% (17)
State:
4.3% (179,792)
Number of households with income $10k - 20k:
Blue Ball:
0.0% (0)
State:
6.5% (268,738)
Number of households with income $20k - 30k:
Blue Ball:
0.0% (0)
State:
7.0% (288,138)
Number of households with income $30k - 40k:
Blue Ball:
0.0% (0)
Pennsylvania:
7.2% (300,208)
Number of households with income $40k - 50k:
Blue Ball:
5.9% (18)
State:
7.2% (298,756)
Number of households with income $50k - 60k:
Blue Ball:
2.6% (8)
State:
6.8% (283,251)
Number of households with income $60k - 75k:
Blue Ball:
12.1% (37)
State:
9.9% (408,159)
Number of households with income $75k - 100k:
Blue Ball:
13.1% (40)
State:
13.2% (547,809)
Number of households with income $100k - 125k:
Blue Ball:
2.6% (8)
State:
10.5% (436,652)
Number of households with income $125k - 150k:
Blue Ball:
23.3% (71)
State:
7.3% (304,132)
Number of households with income $150k - 200k:
Blue Ball:
18.4% (56)
State:
9.0% (374,658)
Number of households with income > $200k:
Blue Ball:
16.4% (50)
State:
10.9% (452,618)
Aggregate household income in Blue Ball in 2022: $44,893,674
Median family income in Blue Ball in 2022:
Blue Ball:
$136,715
State:
$99,396
Number of families with income $50k - 60k:
Blue Ball:
4.3% (8)
State:
6.1% (157,983)
Number of families with income $60k - 75k:
Blue Ball:
5.7% (10)
State:
9.6% (249,292)
Number of families with income $75k - 100k:
Blue Ball:
18.0% (32)
State:
14.7% (379,316)
Number of families with income $100k - 125k:
Blue Ball:
4.0% (7)
State:
12.9% (333,626)
Number of families with income $125k - 150k:
Blue Ball:
39.9% (71)
State:
9.4% (243,915)
Number of families with income > $200k:
Blue Ball:
28.2% (50)
Pennsylvania:
15.1% (390,885)
Median per capita income in Blue Ball in 2022:
Blue Ball:
$66,218
State:
$45,306
Income statistics for Black or African American residents
Number of households with income < $10k:
Blue Ball:
0.0% (0)
State:
12.0% (64,705)
Number of households with income $10k - 20k:
Blue Ball:
0.0% (0)
State:
12.7% (68,459)
Number of households with income $20k - 30k:
Blue Ball:
0.0% (0)
State:
9.3% (49,778)
Number of households with income $30k - 40k:
Blue Ball:
0.0% (0)
State:
10.0% (53,629)
Number of households with income $40k - 50k:
Blue Ball:
0.0% (0)
State:
8.5% (45,601)
Number of households with income $50k - 60k:
Blue Ball:
100.0% (27)
State:
7.8% (41,725)
Number of households with income $60k - 75k:
Blue Ball:
0.0% (0)
State:
10.4% (55,653)
Number of households with income $75k - 100k:
Blue Ball:
0.0% (0)
State:
9.5% (51,281)
Number of households with income $100k - 125k:
Blue Ball:
0.0% (0)
Pennsylvania:
7.1% (38,125)
Number of households with income $125k - 150k:
Blue Ball:
0.0% (0)
State:
4.5% (24,172)
Number of households with income $150k - 200k:
Blue Ball:
0.0% (0)
State:
4.0% (21,749)
Number of households with income > $200k:
Blue Ball:
0.0% (0)
State:
4.2% (22,562)
Aggregate household income in Blue Ball in 2022: $455,926,500
Median per capita income in Blue Ball in 2022:
Blue Ball:
$17,574
Pennsylvania:
$28,010
Change in median per capita income between 2000 and 2022:
Blue Ball, Pennsylvania:
+33.7%
State:
+101.5%
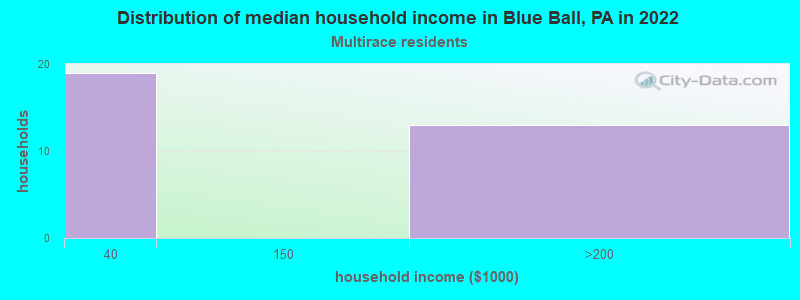
Income statistics for Multirace residents
Number of households with income < $10k:
Blue Ball:
0.0% (0)
State:
7.8% (21,911)
Number of households with income $10k - 20k:
Blue Ball:
0.0% (0)
State:
8.2% (22,847)
Number of households with income $20k - 30k:
Blue Ball:
0.0% (0)
Pennsylvania:
8.7% (24,252)
Number of households with income $30k - 40k:
Blue Ball:
59.4% (19)
State:
7.3% (20,502)
Number of households with income $40k - 50k:
Blue Ball:
0.0% (0)
Pennsylvania:
7.7% (21,525)
Number of households with income $50k - 60k:
Blue Ball:
0.0% (0)
State:
8.6% (24,174)
Number of households with income $60k - 75k:
Blue Ball:
0.0% (0)
State:
11.9% (33,350)
Number of households with income $75k - 100k:
Blue Ball:
0.0% (0)
State:
11.5% (32,274)
Number of households with income $100k - 125k:
Blue Ball:
0.0% (0)
State:
8.3% (23,361)
Number of households with income $125k - 150k:
Blue Ball:
0.0% (0)
Pennsylvania:
5.3% (14,784)
Number of households with income $150k - 200k:
Blue Ball:
40.6% (13)
State:
6.9% (19,314)
Number of households with income > $200k:
Blue Ball:
0.0% (0)
State:
7.8% (21,759)
Aggregate household income in Blue Ball in 2022: $1,207,429,100
Median per capita income in Blue Ball in 2022:
Blue Ball:
$38,400
Pennsylvania:
$27,581
Discuss Blue Ball, Pennsylvania (PA) on our hugely popular Pennsylvania forum.