The median household income in Birch Run, MI in 2022 was $57,052, which was 17.4% less than the median annual income of $66,986 across the entire state of Michigan. Compared to the median income of $41,685 in 2000 this represents an increase of 26.9%. The per capita income in 2022 was $41,017, which means an increase of 49.7% compared to 2000 when it was $20,631.
Whole page based on the data from 2000 / 2022 when the population of Birch Run, Michigan was 1,653 / 1,171
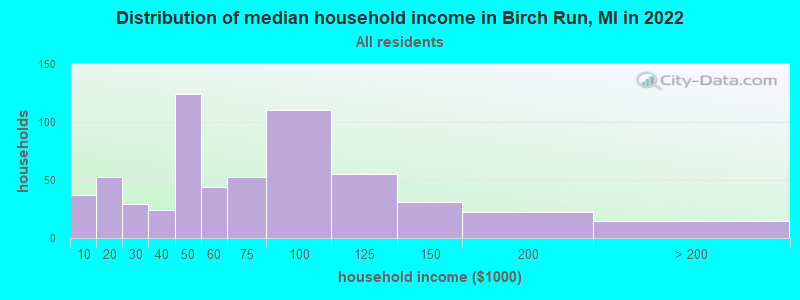
Income statistics for all residents
Median household income in Birch Run, MI in 2022:
Birch Run:
$57,053
State:
$66,986
Change in median household income between 2000 and 2022:
Birch Run, Michigan:
+36.9%
State:
+50.0%
Number of households with income < $10k:
Birch Run:
6.2% (37)
State:
5.7% (231,223)
Number of households with income $10k - 20k:
Birch Run:
8.9% (53)
State:
7.5% (306,955)
Number of households with income $20k - 30k:
Birch Run:
4.9% (29)
State:
7.9% (324,153)
Number of households with income $30k - 40k:
Birch Run:
4.0% (24)
Michigan:
8.3% (341,408)
Number of households with income $40k - 50k:
Birch Run:
20.8% (124)
State:
7.9% (322,255)
Number of households with income $50k - 60k:
Birch Run:
7.4% (44)
State:
7.5% (305,914)
Number of households with income $60k - 75k:
Birch Run:
8.9% (53)
State:
10.1% (414,440)
Number of households with income $75k - 100k:
Birch Run:
18.4% (110)
Michigan:
13.2% (538,299)
Number of households with income $100k - 125k:
Birch Run:
9.2% (55)
State:
9.7% (396,282)
Number of households with income $125k - 150k:
Birch Run:
5.2% (31)
State:
6.7% (273,144)
Number of households with income $150k - 200k:
Birch Run:
3.7% (22)
Michigan:
7.5% (305,077)
Number of households with income > $200k:
Birch Run:
2.5% (15)
State:
8.1% (330,644)
Aggregate household income in Birch Run in 2022: $48,142,385
Median family income in Birch Run in 2022:
Birch Run:
$93,656
State:
$85,865
Number of families with income $20k - 30k:
Birch Run:
3.7% (12)
Michigan:
5.0% (127,320)
Number of families with income $30k - 40k:
Birch Run:
1.7% (5)
Michigan:
6.4% (163,565)
Number of families with income $40k - 50k:
Birch Run:
10.7% (34)
State:
6.8% (172,384)
Number of families with income $50k - 60k:
Birch Run:
7.0% (22)
State:
7.1% (179,870)
Number of families with income $60k - 75k:
Birch Run:
17.8% (56)
State:
10.3% (263,723)
Number of families with income $75k - 100k:
Birch Run:
32.9% (104)
State:
15.0% (383,364)
Number of families with income $100k - 125k:
Birch Run:
10.0% (32)
State:
11.8% (301,751)
Number of families with income $125k - 150k:
Birch Run:
8.4% (26)
Michigan:
8.6% (220,338)
Number of families with income $150k - 200k:
Birch Run:
6.8% (21)
State:
10.2% (259,462)
Number of families with income > $200k:
Birch Run:
1.0% (3)
State:
11.3% (287,206)
Median non-family income in Birch Run in 2022:
Birch Run:
$39,769
State:
$40,459
Change in median non-family income between 2000 and 2022:
Birch Run, Michigan:
+46.1%
State:
+54.5%
Median per capita income in Birch Run in 2022:
Birch Run:
$41,018
Michigan:
$38,151
Change in median per capita income between 2000 and 2022:
Birch Run, Michigan:
+98.8%
State:
+72.1%
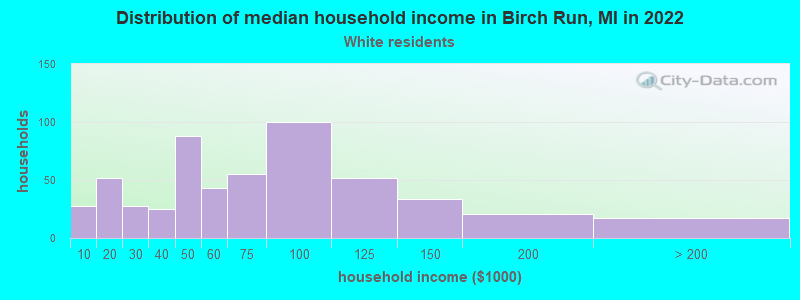
Income statistics for White residents
Median household income in Birch Run, MI in 2022:
Birch Run:
$60,056
State:
$71,609
Change in median household income between 2000 and 2022:
Birch Run, Michigan:
+42.5%
Michigan:
+52.9%
Number of households with income < $10k:
Birch Run:
5.2% (28)
State:
4.4% (140,440)
Number of households with income $10k - 20k:
Birch Run:
9.6% (52)
Michigan:
6.5% (205,547)
Number of households with income $20k - 30k:
Birch Run:
5.2% (28)
State:
7.6% (242,254)
Number of households with income $30k - 40k:
Birch Run:
4.6% (25)
State:
8.1% (257,175)
Number of households with income $40k - 50k:
Birch Run:
16.2% (88)
State:
7.8% (246,839)
Number of households with income $50k - 60k:
Birch Run:
7.9% (43)
State:
7.4% (233,723)
Number of households with income $60k - 75k:
Birch Run:
10.1% (55)
State:
10.4% (328,664)
Number of households with income $75k - 100k:
Birch Run:
18.4% (100)
State:
13.6% (431,867)
Number of households with income $100k - 125k:
Birch Run:
9.6% (52)
Michigan:
10.3% (325,164)
Number of households with income $125k - 150k:
Birch Run:
6.3% (34)
Michigan:
7.1% (226,232)
Number of households with income $150k - 200k:
Birch Run:
3.9% (21)
Michigan:
8.1% (255,445)
Number of households with income > $200k:
Birch Run:
3.1% (17)
Michigan:
8.7% (276,727)
Aggregate household income in Birch Run in 2022: $47,489,718
Median family income in Birch Run in 2022:
Birch Run:
$93,016
Michigan:
$90,317
Number of families with income $20k - 30k:
Birch Run:
3.4% (10)
State:
4.6% (91,551)
Number of families with income $30k - 40k:
Birch Run:
2.0% (6)
State:
5.9% (117,356)
Number of families with income $40k - 50k:
Birch Run:
9.8% (29)
Michigan:
6.4% (127,491)
Number of families with income $50k - 60k:
Birch Run:
7.0% (21)
State:
6.8% (135,883)
Number of families with income $60k - 75k:
Birch Run:
17.7% (52)
State:
10.5% (209,130)
Number of families with income $75k - 100k:
Birch Run:
31.6% (94)
Michigan:
15.5% (309,815)
Number of families with income $100k - 125k:
Birch Run:
11.1% (33)
State:
12.4% (248,235)
Number of families with income $125k - 150k:
Birch Run:
9.6% (28)
Michigan:
9.2% (182,895)
Number of families with income $150k - 200k:
Birch Run:
6.6% (19)
State:
11.0% (218,573)
Number of families with income > $200k:
Birch Run:
1.2% (4)
State:
12.0% (239,713)
Median non-family income in Birch Run in 2022:
Birch Run:
$42,191
State:
$42,438
Change in median non-family income between 2000 and 2022:
Birch Run, Michigan:
+56.2%
State:
+56.8%
Median per capita income in Birch Run in 2022:
Birch Run:
$43,025
State:
$41,514
Change in median per capita income between 2000 and 2022:
Birch Run, Michigan:
+106.0%
Michigan:
+75.2%
Income statistics for Black or African American residents
Number of households with income < $10k:
Birch Run:
0.0% (0)
State:
12.7% (66,307)
Number of households with income $10k - 20k:
Birch Run:
0.0% (0)
State:
14.2% (73,877)
Number of households with income $20k - 30k:
Birch Run:
0.0% (0)
Michigan:
10.2% (52,930)
Number of households with income $30k - 40k:
Birch Run:
0.0% (0)
Michigan:
10.3% (53,542)
Number of households with income $40k - 50k:
Birch Run:
100.0% (27)
State:
9.1% (47,110)
Number of households with income $50k - 60k:
Birch Run:
0.0% (0)
State:
8.1% (41,969)
Number of households with income $60k - 75k:
Birch Run:
0.0% (0)
State:
9.0% (46,784)
Number of households with income $75k - 100k:
Birch Run:
0.0% (0)
State:
9.7% (50,718)
Number of households with income $100k - 125k:
Birch Run:
0.0% (0)
State:
6.7% (34,802)
Number of households with income $125k - 150k:
Birch Run:
0.0% (0)
State:
4.1% (21,083)
Number of households with income $150k - 200k:
Birch Run:
0.0% (0)
Michigan:
3.4% (17,885)
Number of households with income > $200k:
Birch Run:
0.0% (0)
State:
2.6% (13,430)
Aggregate household income in Birch Run in 2022: $1,311,954
Median per capita income in Birch Run in 2022:
Birch Run:
$37,504
State:
$25,207
Change in median per capita income between 2000 and 2022:
Birch Run, Michigan:
+28.2%
State:
+60.4%
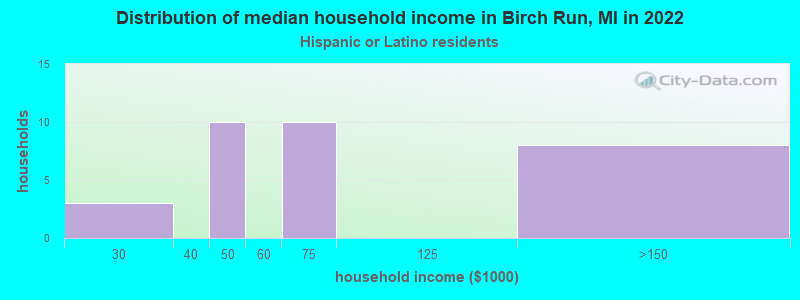
Income statistics for Hispanic or Latino residents
Number of households with income < $10k:
Birch Run:
0.0% (0)
State:
6.0% (10,028)
Number of households with income $10k - 20k:
Birch Run:
0.0% (0)
State:
6.5% (10,959)
Number of households with income $20k - 30k:
Birch Run:
9.7% (3)
Michigan:
9.1% (15,369)
Number of households with income $30k - 40k:
Birch Run:
0.0% (0)
State:
7.9% (13,373)
Number of households with income $40k - 50k:
Birch Run:
32.3% (10)
State:
9.1% (15,369)
Number of households with income $50k - 60k:
Birch Run:
0.0% (0)
Michigan:
8.9% (14,990)
Number of households with income $60k - 75k:
Birch Run:
32.3% (10)
State:
11.5% (19,325)
Number of households with income $75k - 100k:
Birch Run:
0.0% (0)
State:
14.9% (25,158)
Number of households with income $100k - 125k:
Birch Run:
0.0% (0)
State:
8.8% (14,758)
Number of households with income $125k - 150k:
Birch Run:
25.8% (8)
Michigan:
5.3% (8,915)
Number of households with income $150k - 200k:
Birch Run:
0.0% (0)
State:
6.7% (11,249)
Number of households with income > $200k:
Birch Run:
0.0% (0)
Michigan:
5.3% (8,978)
Aggregate household income in Birch Run in 2022: $1,555,205
Median per capita income in Birch Run in 2022:
Birch Run:
$20,283
Michigan:
$25,462
Change in median per capita income between 2000 and 2022:
Birch Run, Michigan:
+0.9%
State:
+83.3%
Income statistics for American Indian and Alaska Native residents
Aggregate household income in Birch Run in 2022: $70,109
Median per capita income in Birch Run in 2022:
Birch Run:
$18,479
Michigan:
$27,661
Change in median per capita income between 2000 and 2022:
Birch Run, Michigan:
+36.9%
State:
+75.7%
Income statistics for Multirace residents
Aggregate household income in Birch Run in 2022: $1,459,243
Median per capita income in Birch Run in 2022:
Birch Run:
$10,217
State:
$26,098
Change in median per capita income between 2000 and 2022:
Birch Run, Michigan:
+14.4%
State:
+106.5%
Income statistics for other residents
Aggregate household income in Birch Run in 2022: $355,510
Median per capita income in Birch Run in 2022:
Birch Run:
$61,005
Michigan:
$27,114
Change in median per capita income between 2000 and 2022:
Birch Run, Michigan:
+118.1%
Michigan:
+104.6%
Discuss Birch Run, Michigan (MI) on our hugely popular Michigan forum.