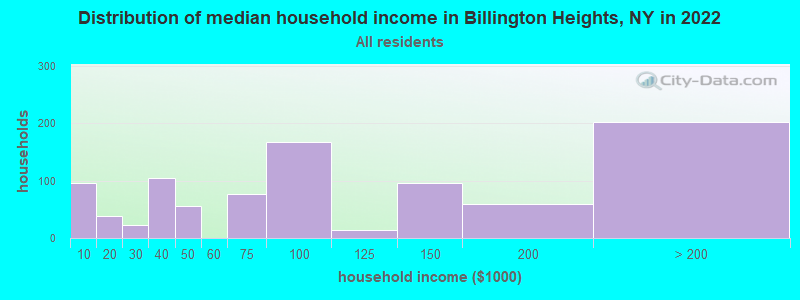
The median household income in Billington Heights, NY in 2022 was $79,040, which was about the same as the median annual income of $79,557 across the entire state of New York. Compared to the median income of $56,154 in 2000 this represents an increase of 29.0%. The per capita income in 2022 was $56,854, which means an increase of 43.1% compared to 2000 when it was $32,337.
Whole page based on the data from 2000 / 2022 when the population of Billington Heights, New York was 1,691 / 1,963
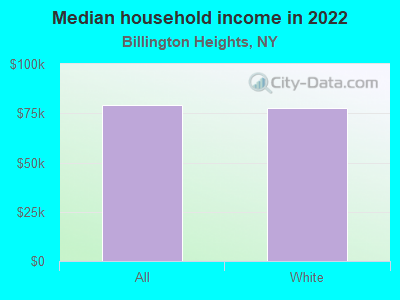
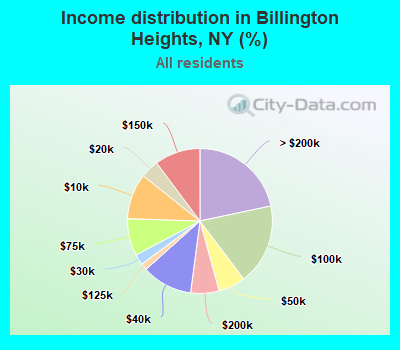
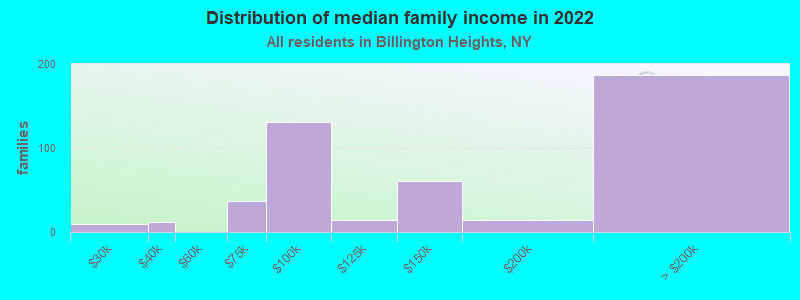
Income statistics for all residents
Median household income in Billington Heights, NY in 2022:
Billington Heights:
$79,041
State:
$79,557
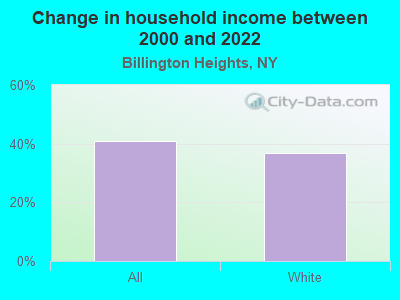
Change in median household income between 2000 and 2022:
Billington Heights, New York:
+40.8%
State:
+83.3%
Number of households with income < $10k:
Billington Heights:
10.2% (95)
New York:
6.8% (527,598)
Number of households with income $10k - 20k:
Billington Heights:
4.1% (38)
State:
7.4% (574,940)
Number of households with income $20k - 30k:
Billington Heights:
2.4% (22)
State:
6.7% (517,718)
Number of households with income $30k - 40k:
Billington Heights:
11.3% (105)
State:
6.5% (506,674)
Number of households with income $40k - 50k:
Billington Heights:
6.0% (56)
State:
6.1% (470,439)
Number of households with income $50k - 60k:
Billington Heights:
0.0% (0)
State:
5.8% (454,042)
Number of households with income $60k - 75k:
Billington Heights:
8.3% (77)
State:
8.5% (657,508)
Number of households with income $75k - 100k:
Billington Heights:
18.0% (168)
State:
11.6% (899,824)
Number of households with income $100k - 125k:
Billington Heights:
1.5% (14)
State:
9.3% (723,825)
Number of households with income $125k - 150k:
Billington Heights:
10.2% (95)
State:
7.1% (552,420)
Number of households with income $150k - 200k:
Billington Heights:
6.3% (59)
New York:
9.4% (727,051)
Number of households with income > $200k:
Billington Heights:
21.7% (202)
State:
15.0% (1,162,269)
Aggregate household income in Billington Heights in 2022: $112,256,237
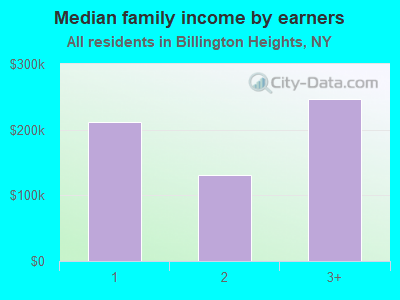
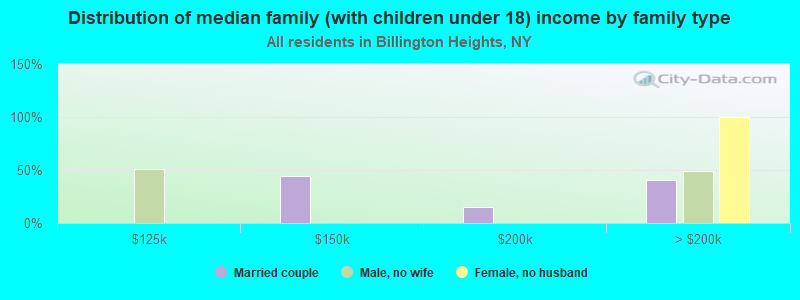
Median family income in Billington Heights in 2022:
Billington Heights:
$140,723
State:
$99,066
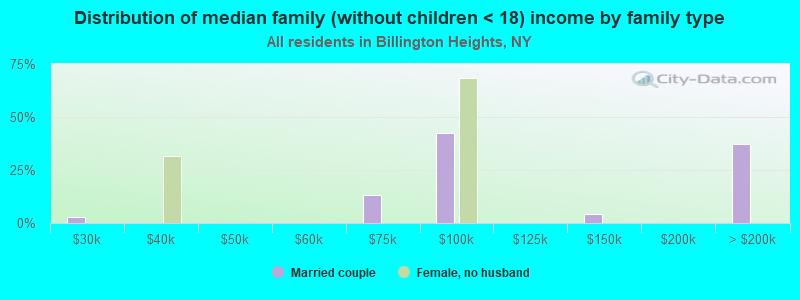
Number of families with income $20k - 30k:
Billington Heights:
2.0% (9)
State:
5.1% (241,229)
Number of families with income $30k - 40k:
Billington Heights:
2.5% (12)
New York:
5.5% (259,233)
Number of families with income $60k - 75k:
Billington Heights:
8.0% (37)
State:
8.2% (388,624)
Number of families with income $75k - 100k:
Billington Heights:
28.3% (131)
State:
12.3% (583,110)
Number of families with income $100k - 125k:
Billington Heights:
3.0% (14)
State:
10.6% (500,579)
Number of families with income $125k - 150k:
Billington Heights:
13.0% (61)
New York:
8.5% (400,594)
Number of families with income $150k - 200k:
Billington Heights:
3.0% (14)
State:
11.6% (551,650)
Number of families with income > $200k:
Billington Heights:
40.2% (187)
New York:
18.9% (895,998)
Median income for 5 person families:
Billington Heights:
$283,783
State:
$123,753
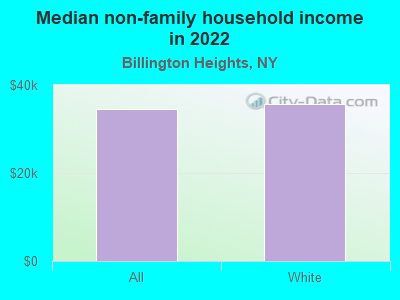
Median non-family income in Billington Heights in 2022:
Billington Heights:
$34,446
State:
$50,181
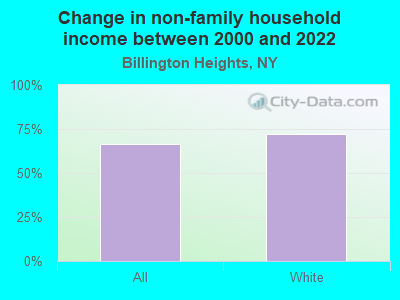
Change in median non-family income between 2000 and 2022:
Billington Heights, New York:
+66.6%
State:
+85.4%
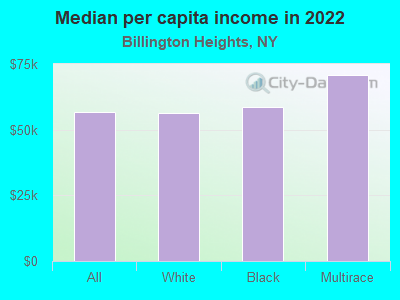
Median per capita income in Billington Heights in 2022:
Billington Heights:
$56,854
New York:
$47,421
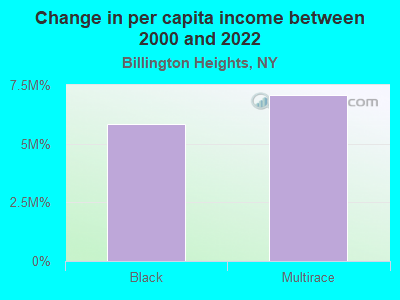
Change in median per capita income between 2000 and 2022:
Billington Heights, New York:
+75.8%
New York:
+102.7%
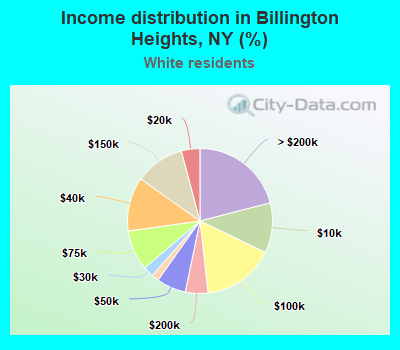
Income statistics for White residents
Median household income in Billington Heights, NY in 2022:
Billington Heights:
$77,533
New York:
$89,408
Change in median household income between 2000 and 2022:
Billington Heights, New York:
+36.9%
State:
+85.5%
Number of households with income < $10k:
Billington Heights:
11.1% (97)
State:
4.8% (225,550)
Number of households with income $10k - 20k:
Billington Heights:
4.1% (36)
New York:
6.1% (289,425)
Number of households with income $20k - 30k:
Billington Heights:
2.4% (21)
State:
5.9% (280,254)
Number of households with income $30k - 40k:
Billington Heights:
12.1% (105)
New York:
6.1% (288,263)
Number of households with income $40k - 50k:
Billington Heights:
6.5% (57)
State:
5.9% (278,079)
Number of households with income $50k - 60k:
Billington Heights:
0.0% (0)
New York:
5.7% (267,554)
Number of households with income $60k - 75k:
Billington Heights:
9.0% (78)
State:
8.4% (398,344)
Number of households with income $75k - 100k:
Billington Heights:
16.1% (140)
State:
11.8% (554,841)
Number of households with income $100k - 125k:
Billington Heights:
1.6% (14)
State:
10.0% (469,794)
Number of households with income $125k - 150k:
Billington Heights:
11.0% (96)
State:
7.6% (360,467)
Number of households with income $150k - 200k:
Billington Heights:
5.1% (44)
State:
10.1% (477,078)
Number of households with income > $200k:
Billington Heights:
21.0% (183)
State:
17.6% (829,233)
Aggregate household income in Billington Heights in 2022: $101,924,786
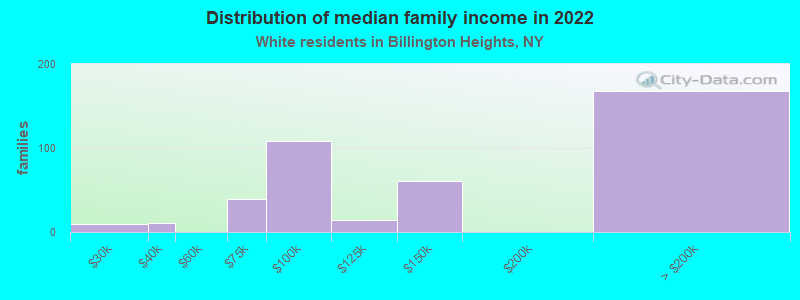
Median family income in Billington Heights in 2022:
Billington Heights:
$134,610
State:
$115,170
Number of families with income $20k - 30k:
Billington Heights:
2.1% (9)
New York:
3.5% (97,578)
Number of families with income $30k - 40k:
Billington Heights:
2.6% (11)
State:
4.1% (114,108)
Number of families with income $60k - 75k:
Billington Heights:
9.4% (39)
State:
7.8% (216,254)
Number of families with income $75k - 100k:
Billington Heights:
26.3% (108)
State:
12.4% (342,382)
Number of families with income $100k - 125k:
Billington Heights:
3.4% (14)
State:
11.4% (314,917)
Number of families with income $125k - 150k:
Billington Heights:
14.9% (61)
State:
9.4% (260,489)
Number of families with income > $200k:
Billington Heights:
41.2% (168)
State:
23.2% (642,319)
Median non-family income in Billington Heights in 2022:
Billington Heights:
$35,629
State:
$54,783
Change in median non-family income between 2000 and 2022:
Billington Heights, New York:
+72.3%
State:
+87.9%
Median per capita income in Billington Heights in 2022:
Billington Heights:
$56,378
State:
$57,640
Change in median per capita income between 2000 and 2022:
Billington Heights, New York:
+71.8%
State:
+111.6%
Income statistics for Black or African American residents
Number of households with income < $10k:
Billington Heights:
0.0% (0)
State:
12.0% (128,500)
Number of households with income $10k - 20k:
Billington Heights:
0.0% (0)
State:
10.0% (107,541)
Number of households with income $20k - 30k:
Billington Heights:
0.0% (0)
New York:
8.4% (90,192)
Number of households with income $30k - 40k:
Billington Heights:
0.0% (0)
New York:
7.4% (79,579)
Number of households with income $40k - 50k:
Billington Heights:
0.0% (0)
State:
6.8% (72,491)
Number of households with income $50k - 60k:
Billington Heights:
0.0% (0)
New York:
6.7% (71,309)
Number of households with income $60k - 75k:
Billington Heights:
0.0% (0)
State:
8.9% (95,050)
Number of households with income $75k - 100k:
Billington Heights:
0.0% (0)
New York:
11.5% (123,569)
Number of households with income $100k - 125k:
Billington Heights:
0.0% (0)
State:
8.1% (86,632)
Number of households with income $125k - 150k:
Billington Heights:
0.0% (0)
State:
6.0% (64,788)
Number of households with income $150k - 200k:
Billington Heights:
100.0% (13)
State:
7.2% (76,644)
Number of households with income > $200k:
Billington Heights:
0.0% (0)
State:
7.0% (75,062)
Median per capita income in Billington Heights in 2022:
Billington Heights:
$58,540
State:
$31,947
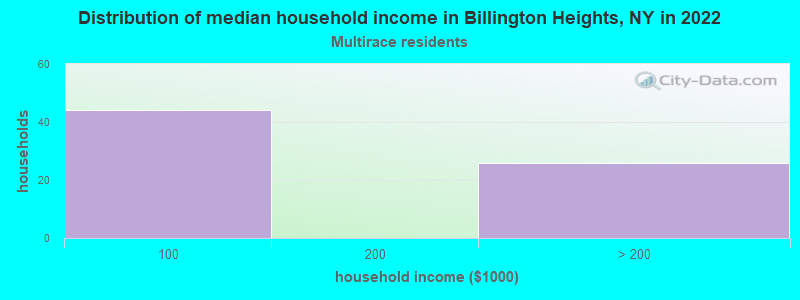
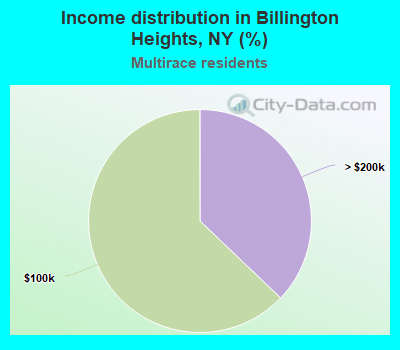
Income statistics for Multirace residents
Number of households with income < $10k:
Billington Heights:
0.0% (0)
State:
8.9% (57,924)
Number of households with income $10k - 20k:
Billington Heights:
0.0% (0)
State:
8.7% (56,590)
Number of households with income $20k - 30k:
Billington Heights:
0.0% (0)
New York:
7.1% (46,287)
Number of households with income $30k - 40k:
Billington Heights:
0.0% (0)
State:
6.9% (45,132)
Number of households with income $40k - 50k:
Billington Heights:
0.0% (0)
State:
5.8% (37,946)
Number of households with income $50k - 60k:
Billington Heights:
0.0% (0)
State:
5.6% (36,410)
Number of households with income $60k - 75k:
Billington Heights:
0.0% (0)
State:
7.8% (50,819)
Number of households with income $75k - 100k:
Billington Heights:
62.9% (44)
State:
11.7% (76,024)
Number of households with income $100k - 125k:
Billington Heights:
0.0% (0)
State:
9.3% (60,635)
Number of households with income $125k - 150k:
Billington Heights:
0.0% (0)
New York:
6.2% (40,533)
Number of households with income $150k - 200k:
Billington Heights:
0.0% (0)
New York:
8.6% (56,409)
Number of households with income > $200k:
Billington Heights:
37.1% (26)
State:
13.4% (87,442)
Median per capita income in Billington Heights in 2022:
Billington Heights:
$70,844
State:
$36,931
Discuss Billington Heights, New York (NY) on our hugely popular New York forum.