Azure, Montana (MT) income map, earnings map, and wages data

Data:
The per capita income in 2022 was $14,843, which means an increase of 63.6% compared to 2000 when it was $5,407.
Whole page based on the data from 2000 / 2022 when the population of Azure, Montana was 253 / 397
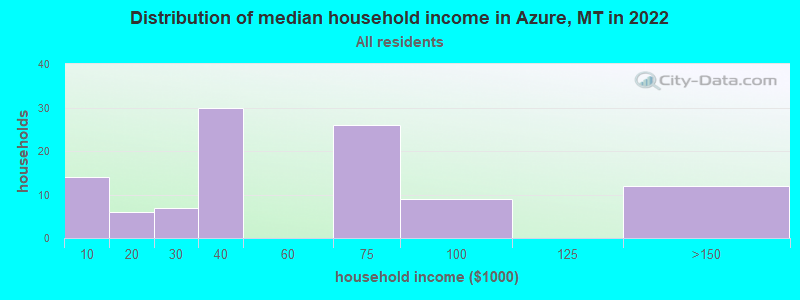
Income statistics for all residents
Number of households with income < $10k:| Azure: | 13.5% (14) |
| State: | 5.0% (23,231) |
Number of households with income $10k - 20k:| Azure: | 5.8% (6) |
| State: | 8.1% (37,478) |
Number of households with income $20k - 30k:| Azure: | 6.7% (7) |
| State: | 7.3% (33,880) |
Number of households with income $30k - 40k:| Azure: | 28.8% (30) |
| State: | 8.4% (38,912) |
Number of households with income $40k - 50k:| Azure: | 0.0% (0) |
| State: | 8.3% (38,441) |
Number of households with income $50k - 60k:| Azure: | 0.0% (0) |
| State: | 7.4% (34,172) |
Number of households with income $60k - 75k:| Azure: | 25.0% (26) |
| Montana: | 10.5% (48,783) |
Number of households with income $75k - 100k:| Azure: | 8.7% (9) |
| Montana: | 15.0% (69,571) |
Number of households with income $100k - 125k:| Azure: | 0.0% (0) |
| State: | 9.9% (45,889) |
Number of households with income $125k - 150k:| Azure: | 11.5% (12) |
| State: | 6.1% (28,538) |
Number of households with income $150k - 200k:| Azure: | 0.0% (0) |
| State: | 6.6% (30,552) |
Number of households with income > $200k:| Azure: | 0.0% (0) |
| State: | 7.5% (34,625) |
Aggregate household income in Azure in 2022: $5,954,632
Median family income in Azure in 2022:| Azure: | $70,042 |
| State: | $83,580 |
Number of families with income < $10k:| Azure: | 5.8% (5) |
| Montana: | 2.6% (7,229) |
Number of families with income $20k - 30k:| Azure: | 7.7% (7) |
| State: | 4.8% (13,650) |
Number of families with income $30k - 40k:| Azure: | 33.6% (31) |
| State: | 6.5% (18,237) |
Number of families with income $60k - 75k:| Azure: | 29.7% (27) |
| State: | 11.6% (32,619) |
Number of families with income $75k - 100k:| Azure: | 9.9% (9) |
| State: | 17.1% (48,328) |
Number of families with income $125k - 150k:| Azure: | 13.1% (12) |
| Montana: | 8.3% (23,444) |
Median per capita income in Azure in 2022:| Azure: | $14,844 |
| Montana: | $38,329 |
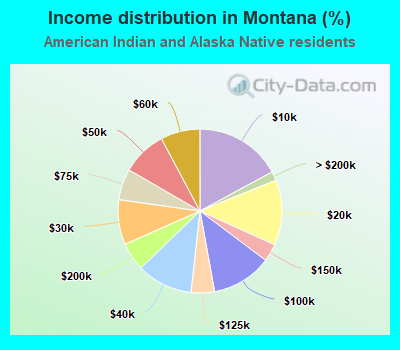
Income statistics for American Indian and Alaska Native residents
Number of households with income < $10k:| Azure: | 14.6% (15) |
| Montana: | 17.1% (3,122) |
Number of households with income $10k - 20k:| Azure: | 5.8% (6) |
| Montana: | 12.9% (2,355) |
Number of households with income $20k - 30k:| Azure: | 7.8% (8) |
| State: | 8.9% (1,620) |
Number of households with income $30k - 40k:| Azure: | 33.0% (34) |
| Montana: | 11.0% (2,013) |
Number of households with income $40k - 50k:| Azure: | 0.0% (0) |
| State: | 8.8% (1,615) |
Number of households with income $50k - 60k:| Azure: | 0.0% (0) |
| State: | 7.8% (1,423) |
Number of households with income $60k - 75k:| Azure: | 18.4% (19) |
| Montana: | 6.1% (1,117) |
Number of households with income $75k - 100k:| Azure: | 8.7% (9) |
| State: | 11.9% (2,169) |
Number of households with income $100k - 125k:| Azure: | 0.0% (0) |
| State: | 4.6% (845) |
Number of households with income $125k - 150k:| Azure: | 11.7% (12) |
| State: | 3.5% (637) |
Number of households with income $150k - 200k:| Azure: | 0.0% (0) |
| State: | 5.6% (1,015) |
Number of households with income > $200k:| Azure: | 0.0% (0) |
| Montana: | 1.8% (324) |
Aggregate household income in Azure in 2022: $6,194,027
Median family income in Azure in 2022:| Azure: | $63,538 |
| State: | $41,048 |
Number of families with income < $10k:| Azure: | 5.2% (5) |
| Montana: | 10.3% (1,176) |
Number of families with income $20k - 30k:| Azure: | 9.0% (8) |
| Montana: | 8.1% (932) |
Number of families with income $30k - 40k:| Azure: | 42.2% (39) |
| State: | 17.4% (1,998) |
Number of families with income $60k - 75k:| Azure: | 25.2% (23) |
| State: | 8.2% (936) |
Number of families with income $75k - 100k:| Azure: | 7.2% (7) |
| State: | 10.0% (1,145) |
Number of families with income $125k - 150k:| Azure: | 11.1% (10) |
| State: | 3.6% (415) |
Median per capita income in Azure in 2022:| Azure: | $16,284 |
| Montana: | $19,038 |