Yulee, FL (Florida) Houses and Residents
| Yulee: | $314,882 |
| Florida: | $354,100 |
Mean price in 2022:
Detached houses: $296,889
Here: $296,889 State: $500,941 Townhouses or other attached units: $166,981
Here: $166,981 State: $370,869 Mobile homes: $178,961
Here: $178,961 State: $113,202
Total population: 11,491 (Urban population: 5,549 (all inside urban clusters), Rural population: 2,747 (53 farm, 2,694 nonfarm))
Houses: 6,124 (5,730 occupied: 4,869 owner occupied, 1,203 renter occupied)
| % of renters here: | 20% |
| State: | 33% |
Housing density: 266 houses/condos per square mile
Median price asked for vacant for-sale houses and condos in 2022: $685,683.
Median contract rent in 2022: $1,822 (lower quartile is $766, upper quartile is $1,839)
Median rent asked for vacant for-rent units in 2022: $5,291
Median gross rent in Yulee, FL in 2022: $1,771
Housing units in Yulee with a mortgage: 3,718 (192 second mortgage, 0 home equity loan, 134 both second mortgage and home equity loan)
Houses without a mortgage: 17
Median household income for houses/condos with a mortgage: $91,545
Median household income for apartments without a mortgage: $63,823
Median monthly housing costs: $1,300
Compare current foreclosures in Yulee, FL:
| Photo | Address | Area | Beds / Baths | Price | Details |
|---|---|---|---|---|---|

|
#1
Meadowwood Dr
Yulee, FL 32097
|
2,594 sq. feet
|
3 baths 4 beds |
show details | |

|
#2
Stoney Glen Ct
Yulee, FL 32097
|
1,659 sq. feet
|
2 baths 4 beds |
show details | |

|
#3
Cartesian Pointe Dr
Yulee, FL 32097
|
1,884 sq. feet
|
2 baths 3 beds |
show details | |

|
#4
Cartesian Pointe Dr
Yulee, FL 32097
|
1,884 sq. feet
|
2 baths 3 beds |
show details | |

|
#5
Fortune Dr
Yulee, FL 32097
|
1,830 sq. feet
|
2 baths 4 beds |
show details | |

|
#6
Cartesian Pointe Dr
Yulee, FL 32097
|
2,307 sq. feet
|
2 baths 4 beds |
show details | |

|
#7
Tidal Bay Ct
Yulee, FL 32097
|
1,668 sq. feet
|
2 baths 3 beds |
show details | |

|
#8
Tidal Bay Ct
Yulee, FL 32097
|
1,327 sq. feet
|
2 baths 3 beds |
show details | |

|
#9
Kipling Dr
Yulee, FL 32097
|
1,870 sq. feet
|
2 baths 3 beds |
show details | |

|
#10
Lana Rd
Yulee, FL 32097
|
1,152 sq. feet
|
2 baths 3 beds |
show details |
| Photo | Address | Area | Beds / Baths | Price | Details |
|---|---|---|---|---|---|

|
#11
Fieldstone Dr
Yulee, FL 32097
|
2,333 sq. feet
|
2 baths 3 beds |
show details | |

|
#12
Derrick Rd
Yulee, FL 32097
|
- sq. feet
|
- baths - beds |
show details | |

|
#13
State Road 200
Yulee, FL 32097
|
- sq. feet
|
- baths - beds |
show details | |

|
#14
Sweetgum St
Yulee, FL 32097
|
- sq. feet
|
- baths - beds |
show details | |

|
#15
Spoonbill Ln
Yulee, FL 32097
|
- sq. feet
|
- baths - beds |
show details | |

|
#16
Nassau Station Way
Yulee, FL 32097
|
- sq. feet
|
- baths - beds |
show details | |

|
#17
Fern Creek Dr
Yulee, FL 32097
|
- sq. feet
|
- baths - beds |
show details | |

|
#18
Plummers Creek Dr
Yulee, FL 32097
|
- sq. feet
|
- baths - beds |
show details | |

|
#19
Commodore Point Dr
Yulee, FL 32097
|
- sq. feet
|
- baths - beds |
show details | |

|
#20
Commodore Point Dr
Yulee, FL 32097
|
- sq. feet
|
- baths - beds |
show details |
| Photo | Address | Area | Beds / Baths | Price | Details |
|---|---|---|---|---|---|

|
#21
Crested Heron Ct
Yulee, FL 32097
|
- sq. feet
|
- baths - beds |
show details | |

|
#22
Spartina Ln
Yulee, FL 32097
|
- sq. feet
|
- baths - beds |
show details | |

|
#23
Pinewood Dr
Yulee, FL 32097
|
- sq. feet
|
- baths - beds |
show details | |

|
#24
Lumber Creek Blvd
Yulee, FL 32097
|
- sq. feet
|
- baths - beds |
show details | |

|
#25
Saddle Rock Rd
Yulee, FL 32097
|
- sq. feet
|
- baths - beds |
show details | |

|
#26
Lumber Creek Blvd
Yulee, FL 32097
|
- sq. feet
|
- baths - beds |
show details | |

|
#27
Blackmon Rd
Yulee, FL 32097
|
- sq. feet
|
- baths - beds |
show details | |

|
#28
Shallowtail Ln
Yulee, FL 32097
|
- sq. feet
|
- baths - beds |
show details | |

|
#29
Daydream Ave, Apt 8302
Yulee, FL 32097
|
- sq. feet
|
- baths - beds |
show details | |

|
#30
Yulee Hills Rd
Yulee, FL 32097
|
- sq. feet
|
- baths - beds |
show details |
| Photo | Address | Area | Beds / Baths | Price | Details |
|---|---|---|---|---|---|

|
Check over 1 million property listings on Foreclosure.com!
|
browse all offers | |||
| Photo | Address | Area | Beds / Baths | Price | Details |
|---|

Latest news about housing in Yulee, FL collected exclusively by city-data.com from local newspapers, TV, and radio stations

 | Nextgen/Multi gen homes (10 replies) |
| Amelia Island/fernandina, foreclosures and boarded up homes?? (48 replies) |
| Need Inspectors for home purchase Yulee (1 reply) |
| real estate right now (15 replies) |
| Another Yulee/St. John's post (5 replies) |
| Yulee? (7 replies) |

Median year apartment built: 2003
Household type by relationship:
Households: 14,733- Male householders: 3,100 (650 living alone), Female householders: 2,607 (478 living alone)
2,772 spouses (2,744 opposite-sex spouses), 595 unmarried partners, (591 opposite-sex unmarried partners), 3,950 children (3,182 natural, 358 adopted, 409 stepchildren), 768 grandchildren, 49 brothers or sisters, 177 parents, 0 foster children, 385 other relatives, 303 non-relatives
- In group quarters: 22
Size of family households: 2,273 2-persons, 943 3-persons, 960 4-persons, 165 5-persons, 36 6-persons, 92 7-or-more-persons.
Size of nonfamily households: 1,130 1-person, 542 2-persons, 24 4-persons.
1,781 married couples with children.
1,146 single-parent households (345 men, 801 women).
95.1% of residents of Yulee speak English at home.
2.7% of residents speak Spanish at home (41% speak English very well, 51% speak English well, 6% speak English not well, 2% don't speak English at all).
1.1% of residents speak other Indo-European language at home (91% speak English very well, 9% speak English well).
0.2% of residents speak Asian or Pacific Island language at home (100% speak English very well).
0.4% of residents speak other language at home (100% speak English very well).
Foreign born population: 339 (2.3%)
(84.7% of them are naturalized citizens)
| Here: | 5.8 |
| State: | 5.9 |
| Here: | 4.8 |
| State: | 4.2 |

- Bedrooms in owner-occupied houses and condos in Yulee, Florida
- 0no bedroom
- 201 bedroom
- 4312 bedrooms
- 3,1443 bedrooms
- 1,1904 bedrooms
- 835+ bedrooms

- Bedrooms in renter-occupied apartments in Yulee, Florida
- 16no bedroom
- 771 bedroom
- 2992 bedrooms
- 7393 bedrooms
- 734 bedrooms
- 05+ bedrooms

- Cars and other vehicles available in Yulee in owner-occupied houses/condos
- 46no vehicle
- 1,5431 vehicle
- 2,0992 vehicles
- 8273 vehicles
- 2664 vehicles
- 885+ vehicles

- Cars and other vehicles available in Yulee in renter-occupied apartments
- 104no vehicle
- 4931 vehicle
- 4062 vehicles
- 1853 vehicles
- 164 vehicles
- 05+ vehicles

- Rooms in owner-occupied houses in Yulee, Florida
- 01 room
- 02 rooms
- 313 rooms
- 3624 rooms
- 1,7405 rooms
- 8676 rooms
- 1,0467 rooms
- 2988 rooms
- 5269+ rooms

- Rooms in renter-occupied apartments in Yulee, Florida
- 161 room
- 172 rooms
- 613 rooms
- 3114 rooms
- 2715 rooms
- 3386 rooms
- 827 rooms
- 568 rooms
- 529+ rooms


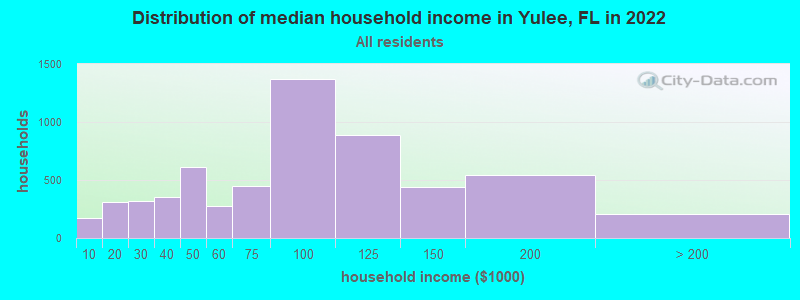
Yulee, FL household income distribution

- 170Less than $10,000
- 311$10,000 to $19,999
- 318$20,000 to $29,999
- 355$30,000 to $39,999
- 608$40,000 to $49,999
- 274$50,000 to $59,999
- 448$60,000 to $74,999
- 1,367$75,000 to $99,999
- 892$100,000 to $124,999
- 439$125,000 to $149,999
- 543$150,000 to $199,999
- 211$200,000 or more
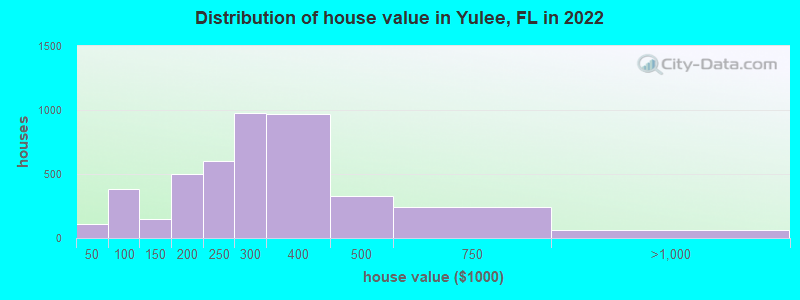
Home value of owner - occupied houses in 2022 in Yulee, FL
-
- 50Less than $10,000
- 29$15,000 to $19,999
- 27$30,000 to $34,999
- 59$50,000 to $59,999
- 64$60,000 to $69,999
- 49$70,000 to $79,999
- 58$80,000 to $89,999
- 147$90,000 to $99,999
- 100$100,000 to $124,999
- 49$125,000 to $149,999
- 168$150,000 to $174,999
- 330$175,000 to $199,999
- 599$200,000 to $249,999
- 978$250,000 to $299,999
- 971$300,000 to $399,999
- 328$400,000 to $499,999
- 242$500,000 to $749,999
- 50$750,000 to $999,999
- 15$1,000,000 to $1,499,999
Rent paid by renters in 2022 in Yulee, FL
-
- 16$100 to $149
- 38$200 to $249
- 49$300 to $349
- 24$500 to $549
- 19$600 to $649
- 35$700 to $749
- 44$750 to $799
- 101$800 to $899
- 12$900 to $999
- 135$1,000 to $1,249
- 260$1,250 to $1,499
- 206$1,500 to $1,999
- 40$2,000 to $2,499
- 95No cash rent


Percentage of workers working in this county: 55.3%
Number of people working at home: 869 (12.8% of all workers)
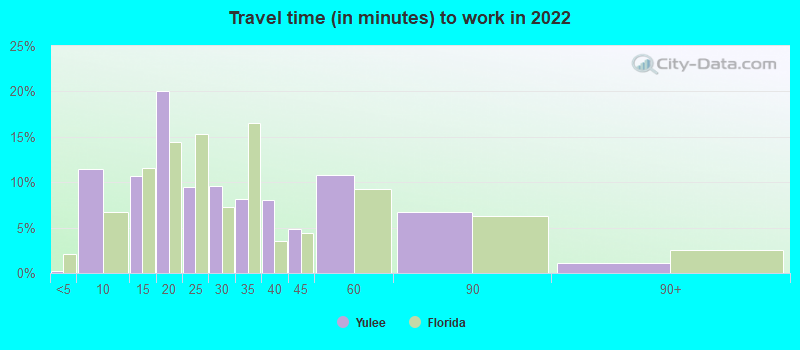
Travel time to work (commute)
- Less than 5 minutes: 32
- 5 to 9 minutes: 502
- 10 to 14 minutes: 486
- 15 to 19 minutes: 918
- 20 to 24 minutes: 782
- 25 to 29 minutes: 780
- 30 to 34 minutes: 1,089
- 35 to 39 minutes: 472
- 40 to 44 minutes: 129
- 45 to 59 minutes: 1,021
- 60 to 89 minutes: 208
- 90 or more minutes: 0
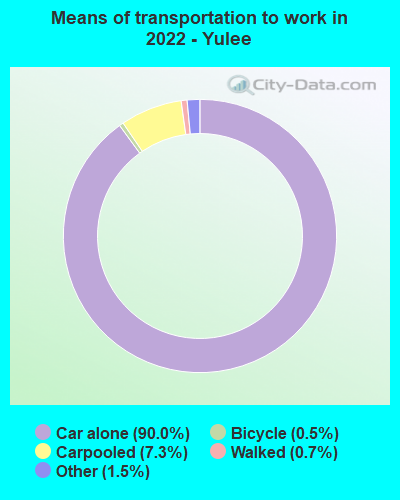
Means of transportation to work:
- Drove a car alone: 4,072 (74.7%)
- Carpooled: 352 (6.5%)
- Taxi: 78 (1.4%)
- Bicycle: 21 (0.4%)
- Walked: 32 (0.6%)
- Worked at home: 869 (16.0%)

- Unemployment by race in 2022
- Unemployment rate for White non-Hispanic residents
- 1.1%Males
- Unemployment rate for Black residents
- 11.6%Males

- Year of entry for the foreign-born population in Yulee, Florida
- 1382010 or later
- 472000 to 2009
- 851990 to 1999
- 481980 to 1989
- 311970 to 1979
- 40Before 1970

First ancestries reported:
- American: 2,843 (35.6%)
- English: 1,094 (13.7%)
- Irish: 459 (5.7%)
- Italian: 417 (5.2%)
- German: 401 (5.0%)
- European: 339 (4.2%)
- French: 134 (1.7%)
- Scandinavian: 112 (1.4%)
- Scottish: 83 (1.0%)
- British: 78 (1.0%)
- Scotch-Irish: 64 (0.8%)
- Polish: 59 (0.7%)
- African: 49 (0.6%)
- French Canadian: 41 (0.5%)
- Lebanese: 34 (0.4%)
- Syrian: 31 (0.4%)
- Turkish: 28 (0.4%)
- Dutch: 22 (0.3%)
- Finnish: 19 (0.2%)
- Norwegian: 18 (0.2%)
- Swiss: 16 (0.2%)
- Czechoslovakian: 11 (0.1%)
- Swedish: 11 (0.1%)
Most common places of birth for foreign-born residents (%):
| Yulee: | 19.4% (83) |
| Florida: | 5.6% (257,152) |
| Yulee: | 18.7% (80) |
| Florida: | 2.7% (122,906) |
| Yulee: | 15.9% (68) |
| Florida: | 2.4% (109,132) |
| Yulee: | 9.1% (39) |
| Florida: | 0.1% (4,585) |
| Yulee: | 5.6% (24) |
| Florida: | 0.1% (3,283) |
| Yulee: | 5.6% (24) |
| Florida: | 0.4% (17,749) |
| Yulee: | 4.2% (18) |
| Florida: | 2.3% (105,066) |
| Yulee: | 2.8% (12) |
| Florida: | 0.1% (4,700) |
| Yulee: | 2.8% (12) |
| Florida: | 0.0% (738) |
| Yulee: | 2.8% (12) |
| Florida: | 2.1% (97,632) |
| Yulee: | 2.3% (10) |
| Florida: | 0.8% (37,723) |
| Yulee: | 2.3% (10) |
| Florida: | 0.2% (9,493) |
| Yulee: | 1.9% (8) |
| Florida: | 1.8% (84,403) |
Place of birth for U.S.-born residents:
- This state: 7,086
- Other state: 7,013
- Northeast: 1,942
- Midwest: 872
- South: 3,802
- West: 479
84.8% of Yulee residents lived in the same house 1 years ago.
Out of people who lived in different houses, 23.6% lived in this county.
Out of people who lived in different counties, 34.5% lived in Florida.
| Yulee: | 84.8% |
| State average: | 86.3% |
Education attainment for males 25 years and older:
- No schooling: 79
- Nursery to 4th grade: 0
- 5th and 6th grade: 42
- 7th and 8th grade: 56
- 9th grade: 138
- 10th grade: 41
- 11th grade: 0
- 12th grade, no diploma: 63
- High school graduate (or equivalency): 1,797
- Less than 1 year of college: 328
- Some college more than 1 year, no degree: 857
- Associate degree: 613
- Bachelor's degree: 798
- Master's degree: 271
- Professional school degree: 17
- Doctorate degree: 28

Education attainment for females 25 years and older:
- No schooling: 128
- Nursery to 4th grade: 0
- 5th and 6th grade: 0
- 7th and 8th grade: 39
- 9th grade: 66
- 10th grade: 23
- 11th grade: 70
- 12th grade, no diploma: 82
- High school graduate (or equivalency): 1,280
- Less than 1 year of college: 873
- Some college more than 1 year, no degree: 614
- Associate degree: 668
- Bachelor's degree: 764
- Master's degree: 334
- Professional school degree: 21
- Doctorate degree: 38


Housing units in structures:
- One, detached: 4,183
- One, attached: 68
- 3 or 4: 24
- 5 to 9: 34
- 10 to 19: 45
- 20 to 49: 97
- 50 or more: 48
- Mobile homes: 1,622
Median worth of mobile homes: $186,419
Housing units lacking complete kitchen facilities in 2022: 0.5%
House/condo owner moved in on average 5 years ago
Renter moved in on average -1 years ago

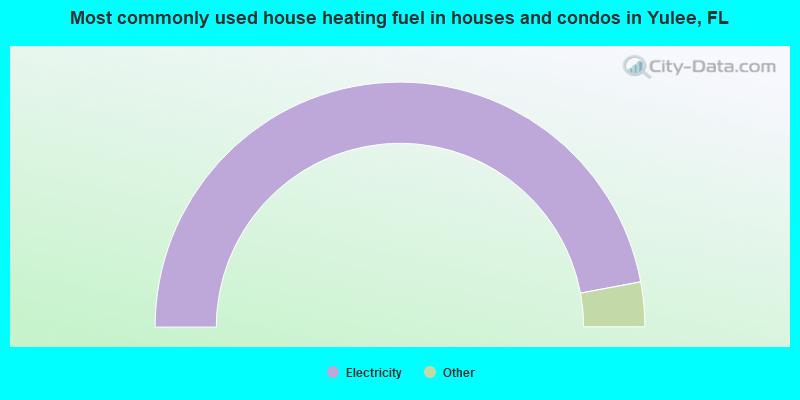
- 94.1%Electricity
- 2.9%Bottled, tank, or LP gas
- 2.7%No fuel used
- 0.3%Utility gas
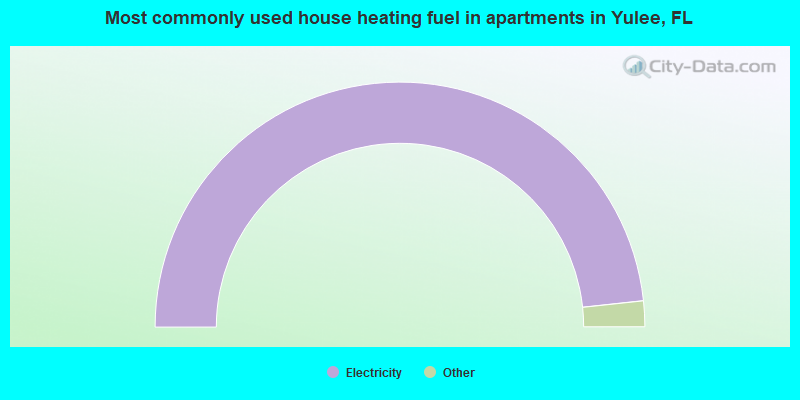
- 96.7%Electricity
- 1.7%Utility gas
- 1.6%No fuel used
Private vs. public school enrollment:
| Here: | 36.0% |
| Florida: | 15.8% |
| Here: | 8.8% |
| Florida: | 12.9% |
| Here: | 19.6% |
| Florida: | 23.6% |


