Yreka, CA (California) Houses and Residents
| Yreka: | $227,051 |
| California: | $715,900 |
Total population: 7,564 (Urban population: 6,929 (all inside urban clusters), Rural population: 513 (all nonfarm))
Houses: 3,539 (3,275 occupied: 2,010 owner occupied, 1,276 renter occupied)
| % of renters here: | 39% |
| State: | 44% |
Housing density: 355 houses/condos per square mile
Median price asked for vacant for-sale houses and condos in 2022: $646,369.
Median contract rent in 2022: $809 (lower quartile is $659, upper quartile is $946)
Median rent asked for vacant for-rent units in 2022: $1,097
Median gross rent in Yreka, CA in 2022: $956
Housing units in Yreka with a mortgage: 1,021 (52 second mortgage, 0 home equity loan, 47 both second mortgage and home equity loan)
Houses without a mortgage: 10
Median household income for houses/condos with a mortgage: $91,999
Median household income for apartments without a mortgage: $47,587
Median monthly housing costs: $895
Compare current foreclosures near Yreka, CA:
| Photo | Address | Area | Beds / Baths | Price | Details |
|---|---|---|---|---|---|

|
#1
French St
Yreka, CA 96097
|
2,828 sq. feet
|
2 baths 4 beds |
$332,000
|
show details |

|
#2
State Highway 96
Yreka, CA 96097
|
572 sq. feet
|
1 baths 1 beds |
show details | |

|
#3
Swallow Cir
Yreka, CA 96097
|
912 sq. feet
|
1 baths 2 beds |
show details | |

|
#4
French St
Yreka, CA 96097
|
1,536 sq. feet
|
1 baths 3 beds |
show details | |

|
#5
E Blake St
Yreka, CA 96097
|
1,229 sq. feet
|
1 baths 3 beds |
show details | |

|
#6
French St
Yreka, CA 96097
|
1,536 sq. feet
|
1 baths 3 beds |
show details | |

|
#7
Northridge Dr
Yreka, CA 96097
|
- sq. feet
|
- baths - beds |
show details | |

|
#8
Greenhorn Rd
Yreka, CA 96097
|
- sq. feet
|
- baths - beds |
show details | |

|
#9
A-12
Grenada, CA 96038
|
1,814 sq. feet
|
2 baths 3 beds |
$199,000
|
show details |

|
#10
Donna Dr
Yreka, CA 96097
|
- sq. feet
|
- baths - beds |
show details |
| Photo | Address | Area | Beds / Baths | Price | Details |
|---|---|---|---|---|---|

|
#11
Scott River Rd
Fort Jones, CA 96032
|
1,780 sq. feet
|
2 baths 3 beds |
show details | |

|
#12
Quartz Ave
Montague, CA 96064
|
- sq. feet
|
- baths - beds |
show details | |

|
#13
Cougar St
Hornbrook, CA 96044
|
- sq. feet
|
- baths - beds |
show details | |

|
#14
142 Creekside Rd
Hornbrook, CA 96044
|
- sq. feet
|
- baths - beds |
show details | |

|
#15
Whitefish Pl
Hornbrook, CA 96044
|
- sq. feet
|
- baths - beds |
show details | |

|
#16
661 Clark
Hornbrook, CA 96044
|
- sq. feet
|
- baths - beds |
show details | |

|
Check over 1 million property listings on Foreclosure.com!
|
browse all offers | |||

Latest news about housing in Yreka, CA collected exclusively by city-data.com from local newspapers, TV, and radio stations

 | What in the h*ll happened to Yreka? (39 replies) |
| info about Yreka Ca (6 replies) |
| Is Northern California receiving a big influx of remote workers? (29 replies) |
| Cities in the mountains near the lake tahoe region (22 replies) |
| Relocating to Yreka, Real Estate Question (2 replies) |
| Are there any places in California with rents $700/mo or less? (44 replies) |

Median year apartment built: 1978
Household type by relationship:
Households: 7,767- Male householders: 1,433 (548 living alone), Female householders: 1,769 (812 living alone)
1,077 spouses (1,072 opposite-sex spouses), 358 unmarried partners, (358 opposite-sex unmarried partners), 2,335 children (2,085 natural, 7 adopted, 241 stepchildren), 103 grandchildren, 226 brothers or sisters, 40 parents, 0 foster children, 29 other relatives, 299 non-relatives
- In group quarters: 93
Size of family households: 680 2-persons, 343 3-persons, 253 4-persons, 209 5-persons, 66 6-persons, 58 7-or-more-persons.
Size of nonfamily households: 1,423 1-person, 239 2-persons, 35 3-persons.
829 married couples with children.
985 single-parent households (91 men, 894 women).
92.4% of residents of Yreka speak English at home.
6.2% of residents speak Spanish at home (99% speak English very well, 1% speak English well).
0.7% of residents speak other Indo-European language at home (84% speak English very well, 16% speak English well).
0.1% of residents speak Asian or Pacific Island language at home (75% speak English very well, 25% speak English well).
0.4% of residents speak other language at home (100% speak English very well).
Foreign born population: 115 (1.5%)
(57.4% of them are naturalized citizens)
| Here: | 5.4 |
| State: | 6.0 |
| Here: | 4.5 |
| State: | 3.9 |

- Bedrooms in owner-occupied houses and condos in Yreka, California
- 99no bedroom
- 311 bedroom
- 4442 bedrooms
- 1,0503 bedrooms
- 3454 bedrooms
- 435+ bedrooms

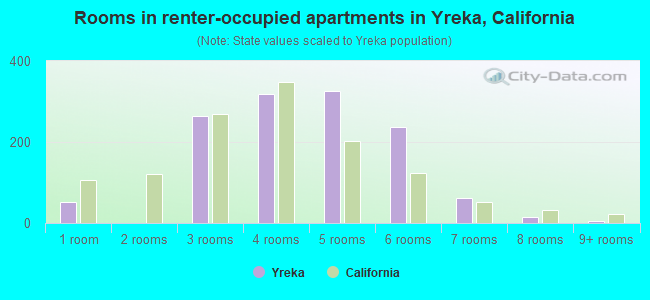
- Bedrooms in renter-occupied apartments in Yreka, California
- 53no bedroom
- 1751 bedroom
- 5632 bedrooms
- 3833 bedrooms
- 974 bedrooms
- 65+ bedrooms

- Cars and other vehicles available in Yreka in owner-occupied houses/condos
- 59no vehicle
- 7421 vehicle
- 7012 vehicles
- 3533 vehicles
- 944 vehicles
- 625+ vehicles

- Cars and other vehicles available in Yreka in renter-occupied apartments
- 122no vehicle
- 6571 vehicle
- 3512 vehicles
- 1013 vehicles
- 44 vehicles
- 415+ vehicles

- Rooms in owner-occupied houses in Yreka, California
- 991 room
- 132 rooms
- 2223 rooms
- 1874 rooms
- 5475 rooms
- 5416 rooms
- 1147 rooms
- 1578 rooms
- 1309+ rooms
- Rooms in renter-occupied apartments in Yreka, California
- 531 room
- 02 rooms
- 2633 rooms
- 3184 rooms
- 3255 rooms
- 2376 rooms
- 617 rooms
- 168 rooms
- 49+ rooms


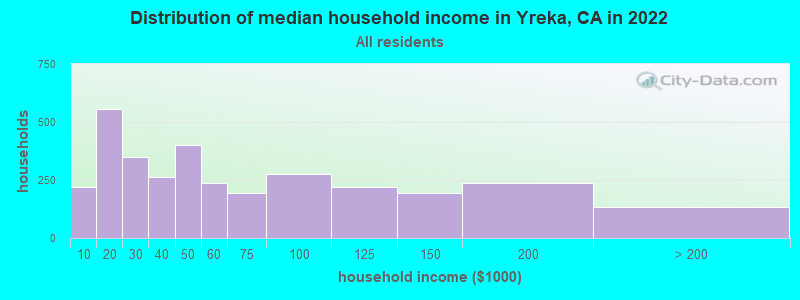
Yreka, CA household income distribution

- 219Less than $10,000
- 557$10,000 to $19,999
- 349$20,000 to $29,999
- 265$30,000 to $39,999
- 403$40,000 to $49,999
- 239$50,000 to $59,999
- 192$60,000 to $74,999
- 275$75,000 to $99,999
- 219$100,000 to $124,999
- 193$125,000 to $149,999
- 239$150,000 to $199,999
- 134$200,000 or more
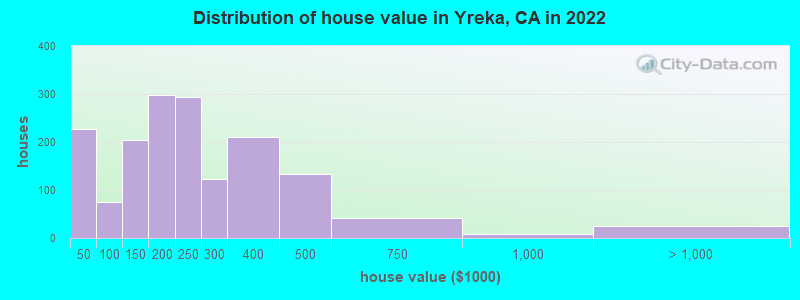
Home value of owner - occupied houses in 2022 in Yreka, CA
-
- 121Less than $10,000
- 14$10,000 to $14,999
- 46$15,000 to $19,999
- 10$20,000 to $24,999
- 13$25,000 to $29,999
- 19$30,000 to $34,999
- 15$50,000 to $59,999
- 25$60,000 to $69,999
- 9$70,000 to $79,999
- 10$80,000 to $89,999
- 12$90,000 to $99,999
- 155$100,000 to $124,999
- 49$125,000 to $149,999
- 130$150,000 to $174,999
- 166$175,000 to $199,999
- 294$200,000 to $249,999
- 123$250,000 to $299,999
- 210$300,000 to $399,999
- 134$400,000 to $499,999
- 41$500,000 to $749,999
- 9$750,000 to $999,999
- 25$1,500,000 to $1,999,999
Rent paid by renters in 2022 in Yreka, CA
-
- 21Less than $100
- 1$100 to $149
- 41$150 to $199
- 57$200 to $249
- 5$250 to $299
- 7$300 to $349
- 16$350 to $399
- 14$400 to $449
- 3$450 to $499
- 25$500 to $549
- 26$550 to $599
- 109$600 to $649
- 71$650 to $699
- 196$700 to $749
- 49$750 to $799
- 225$800 to $899
- 232$900 to $999
- 149$1,000 to $1,249
- 2$1,500 to $1,999
- 23No cash rent


Percentage of workers working in this county: 99.2%
Number of people working at home: 235 (7.7% of all workers)
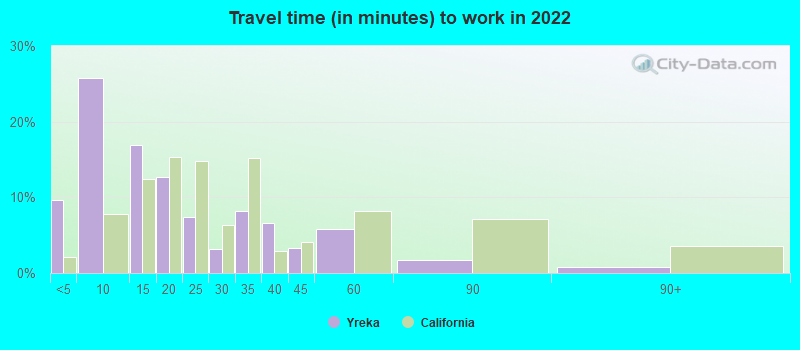
Travel time to work (commute)
- Less than 5 minutes: 367
- 5 to 9 minutes: 1,272
- 10 to 14 minutes: 406
- 15 to 19 minutes: 159
- 20 to 24 minutes: 44
- 25 to 29 minutes: 46
- 30 to 34 minutes: 157
- 35 to 39 minutes: 57
- 40 to 44 minutes: 45
- 45 to 59 minutes: 187
- 60 to 89 minutes: 27
- 90 or more minutes: 55
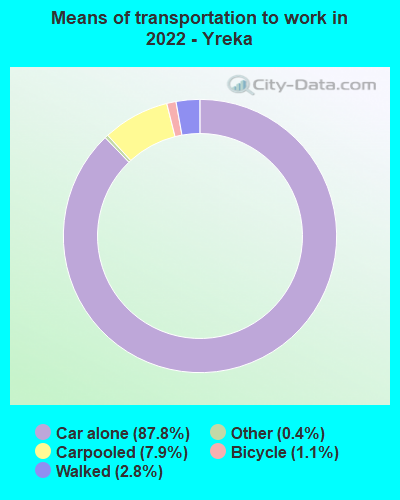
Means of transportation to work:
- Drove a car alone: 4,297 (81.0%)
- Carpooled: 413 (7.8%)
- Taxi: 21 (0.4%)
- Bicycle: 56 (1.1%)
- Walked: 146 (2.8%)
- Worked at home: 235 (4.4%)

- Unemployment by race in 2022
- Unemployment rate for White non-Hispanic residents
- 3.5%Males
- 4.3%Females
- Unemployment rate for American Indian and Alaska Native residents
- 4.5%Males
- 2.6%Females
- Unemployment rate for other race residents
- 16.0%Males
- Unemployment rate for two or more race residents
- 0.8%Males
- 2.1%Females
- Unemployment rate for Hispanic or Latino residents
- 2.4%Males
- 0.7%Females

- Year of entry for the foreign-born population in Yreka, California
- 402010 or later
- 12000 to 2009
- 661990 to 1999
- 1491980 to 1989
- 221970 to 1979
- 122Before 1970
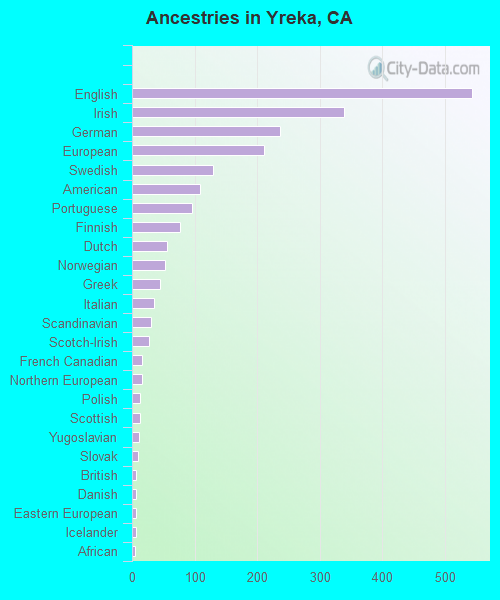
First ancestries reported:
- English: 543 (17.8%)
- Irish: 338 (11.1%)
- German: 237 (7.8%)
- European: 211 (6.9%)
- Swedish: 130 (4.3%)
- American: 109 (3.6%)
- Portuguese: 96 (3.2%)
- Finnish: 77 (2.5%)
- Dutch: 56 (1.8%)
- Norwegian: 52 (1.7%)
- Greek: 44 (1.4%)
- Italian: 35 (1.1%)
- Scandinavian: 30 (1.0%)
- Scotch-Irish: 27 (0.9%)
- French Canadian: 16 (0.5%)
- Northern European: 16 (0.5%)
- Polish: 12 (0.4%)
- Scottish: 12 (0.4%)
- Yugoslavian: 11 (0.4%)
- Slovak: 9 (0.3%)
- British: 7 (0.2%)
- Danish: 6 (0.2%)
- Eastern European: 6 (0.2%)
- Icelander: 6 (0.2%)
- African: 5 (0.2%)
- Czech: 2 (0.07%)
- Maltese: 2 (0.07%)
Most common places of birth for foreign-born residents (%):
| Yreka: | 79.1% (91) |
| California: | 37.2% (3,881,193) |
| Yreka: | 5.2% (6) |
| California: | 0.1% (9,159) |
| Yreka: | 5.2% (6) |
| California: | 0.0% (4,342) |
| Yreka: | 4.3% (5) |
| California: | 1.2% (127,477) |
Place of birth for U.S.-born residents:
- This state: 5,905
- Other state: 1,677
- Northeast: 264
- Midwest: 225
- South: 238
- West: 945
80.6% of Yreka residents lived in the same house 1 years ago.
Out of people who lived in different houses, 37.9% lived in this county.
Out of people who lived in different counties, 69.1% lived in California.
| Yreka: | 80.6% |
| State average: | 88.9% |
Education attainment for males 25 years and older:
- No schooling: 49
- Nursery to 4th grade: 0
- 5th and 6th grade: 0
- 7th and 8th grade: 80
- 9th grade: 48
- 10th grade: 77
- 11th grade: 12
- 12th grade, no diploma: 42
- High school graduate (or equivalency): 711
- Less than 1 year of college: 230
- Some college more than 1 year, no degree: 376
- Associate degree: 244
- Bachelor's degree: 296
- Master's degree: 62
- Professional school degree: 14
- Doctorate degree: 61

Education attainment for females 25 years and older:
- No schooling: 12
- Nursery to 4th grade: 0
- 5th and 6th grade: 0
- 7th and 8th grade: 31
- 9th grade: 50
- 10th grade: 107
- 11th grade: 49
- 12th grade, no diploma: 28
- High school graduate (or equivalency): 558
- Less than 1 year of college: 334
- Some college more than 1 year, no degree: 436
- Associate degree: 497
- Bachelor's degree: 427
- Master's degree: 127
- Professional school degree: 45
- Doctorate degree: 11


Housing units in structures:
- One, detached: 2,249
- One, attached: 99
- Two: 85
- 3 or 4: 248
- 5 to 9: 208
- 10 to 19: 76
- 20 to 49: 145
- 50 or more: 107
- Mobile homes: 319
Median worth of mobile homes: $18,471
House/condo owner moved in on average 9 years ago
Renter moved in on average 1 years ago

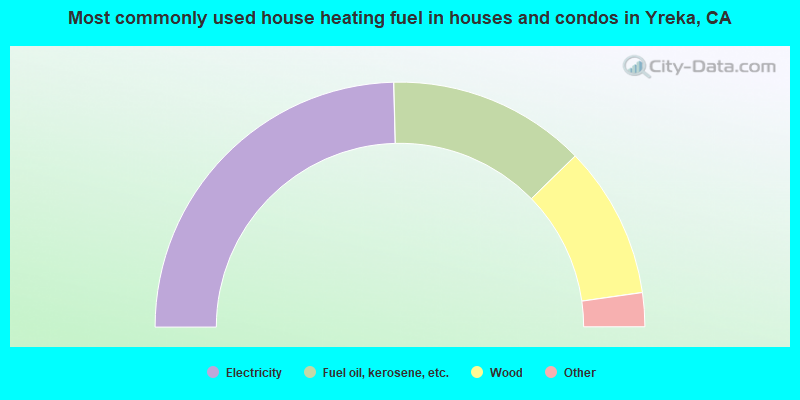
- 49.2%Electricity
- 26.2%Fuel oil, kerosene, etc.
- 20.1%Wood
- 2.0%Utility gas
- 2.0%Bottled, tank, or LP gas
- 0.4%Other fuel
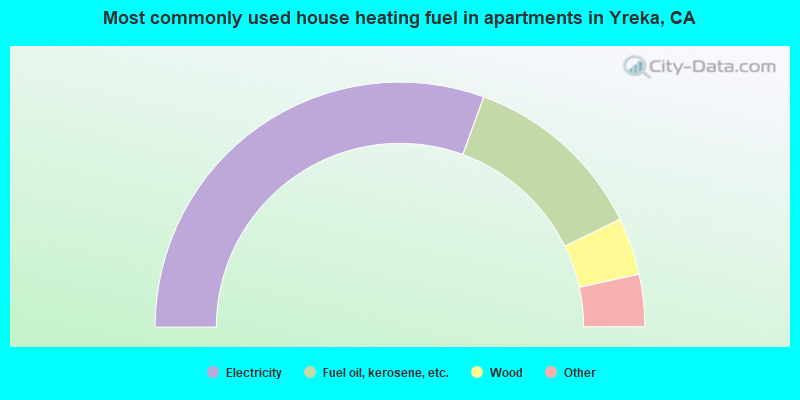
- 61.2%Electricity
- 24.4%Fuel oil, kerosene, etc.
- 7.6%Wood
- 2.7%Utility gas
- 2.6%Bottled, tank, or LP gas
- 1.4%No fuel used
Private vs. public school enrollment:
| Here: | 16.4% |
| California: | 10.5% |
| Here: | 7.6% |
| California: | 8.5% |
| Here: | 5.5% |
| California: | 15.9% |


