Jump to a detailed profile or search site with Google Custom Search

Yountville, CA (California) Houses and Residents

Estimated median house or condo value in 2022: $704,162 (it was $209,300 in 2000)
Yountville:

$704,162
California:

$715,900
Lower value quartile - upper value quartile: $267,900 - $1,158,335

Mean price in 2022:

Detached houses: $1,300,360
Here:

$1,300,360
State:

$988,808

Townhouses or other attached units: $1,722,471
Here:

$1,722,471
State:

$838,546

Mobile homes: $206,066
Here:

$206,066
State:

$184,506

Total population: 3,014 (Urban population: 2,916 (all inside urban clusters), Rural population: 0)

Houses: 1,853 (1,540 occupied: 1,038 owner occupied, 532 renter occupied)

% of renters here:

34%
State:

44%

Housing density: 1,138 houses/condos per square mile

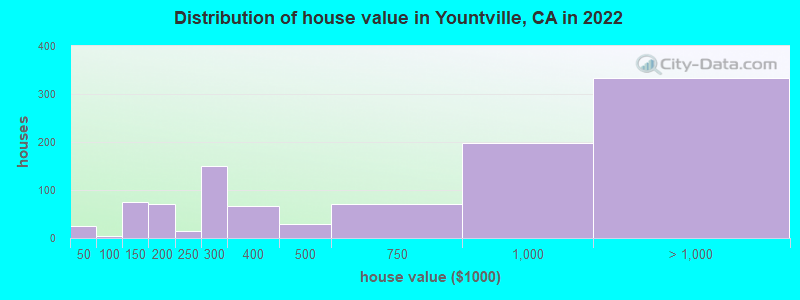
Median price asked for vacant for-sale houses and condos in 2022 in this county: $1,177,232.

Median contract rent in 2022: $1,801 (lower quartile is $1,345, upper quartile is over $2,000)


Median rent asked for vacant for-rent units in 2022: $2,851


Median gross rent in Yountville, CA in 2022: over $2,000

Housing units in Yountville with a mortgage: 400 (38 second mortgage, 0 home equity loan, 41 both second mortgage and home equity loan)
Houses without a mortgage: 0

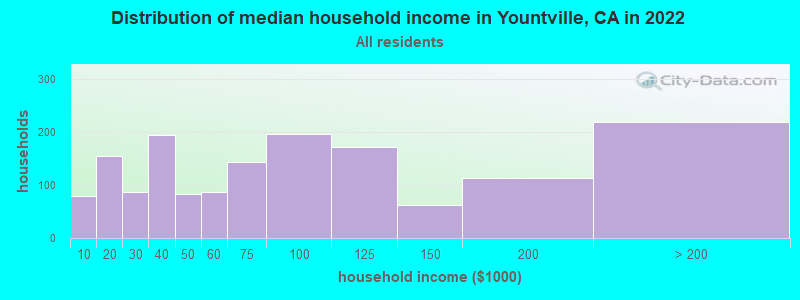
Median household income for houses/condos with a mortgage: $112,244

Median household income for apartments without a mortgage: $47,469

Median monthly housing costs: $1,591

Compare current foreclosures near Yountville, CA:

Check out more offers near Yountville, CA.
Powered by Foreclosure.com

Settings
X
Data:
Loading data...
Based on 2000-2022 data
Loading data...

123
Hide US histogram

Latest news about housing in Yountville, CA collected exclusively by city-data.com from local newspapers, TV, and radio stations

Yountville, California Age and Sex of Residents
Median year house/condo built: 1993

Median year apartment built: 1975

Household type by relationship:

Households: 3,320
  • Male householders: 566 (252 living alone), Female householders: 915 (532 living alone)
  • 572 spouses (566 opposite-sex spouses), 100 unmarried partners, (100 opposite-sex unmarried partners), 269 children (258 natural, 0 adopted, 11 stepchildren), 30 grandchildren, 13 brothers or sisters, 14 parents, 0 foster children, 53 other relatives, 54 non-relatives
  • In group quarters: 728

Size of family households: 390 2-persons, 110 3-persons, 51 4-persons, 15 5-persons.

Size of nonfamily households: 921 1-person, 144 2-persons.

143 married couples with children.
0 single-parent households (0 men, 0 women).

81.2% of residents of Yountville speak English at home.
12.6% of residents speak Spanish at home (49% speak English very well, 8% speak English well, 31% speak English not well, 12% don't speak English at all).
3.5% of residents speak other Indo-European language at home (88% speak English very well, 8% speak English well, 4% speak English not well).
4.3% of residents speak Asian or Pacific Island language at home (60% speak English very well, 16% speak English well, 19% speak English not well, 5% don't speak English at all).

Foreign born population: 478 (14.4%)
(84.7% of them are naturalized citizens)

Median number of rooms in houses and condos:
Here:

5.7
State:

6.0

Median number of rooms in apartments
Here:

3.3
State:

3.9

Owner-occupied Renter-occupied
Bedrooms in owner-occupied houses and condos in Yountville, California
  • Bedrooms in owner-occupied houses and condos in Yountville, California
  • 6no bedroom
  • 131 bedroom
  • 2912 bedrooms
  • 6973 bedrooms
  • 234 bedrooms
  • 85+ bedrooms
Bedrooms in renter-occupied apartments in Yountville, California
  • Bedrooms in renter-occupied apartments in Yountville, California
  • 113no bedroom
  • 1281 bedroom
  • 2292 bedrooms
  • 553 bedrooms
  • 04 bedrooms
  • 85+ bedrooms
Owner-occupied Renter-occupied
Cars and other vehicles available in Yountville in owner-occupied houses/condos
  • Cars and other vehicles available in Yountville in owner-occupied houses/condos
  • 114no vehicle
  • 4691 vehicle
  • 3742 vehicles
  • 653 vehicles
  • 74 vehicles
  • 95+ vehicles
Cars and other vehicles available in Yountville in renter-occupied apartments
  • Cars and other vehicles available in Yountville in renter-occupied apartments
  • 104no vehicle
  • 3111 vehicle
  • 632 vehicles
  • 553 vehicles
  • 04 vehicles
  • 05+ vehicles
Owner-occupied Renter-occupied
Rooms in owner-occupied houses in Yountville, California
  • Rooms in owner-occupied houses in Yountville, California
  • 01 room
  • 62 rooms
  • 123 rooms
  • 2394 rooms
  • 2385 rooms
  • 3596 rooms
  • 1617 rooms
  • 18 rooms
  • 229+ rooms
Rooms in renter-occupied apartments in Yountville, California
  • Rooms in renter-occupied apartments in Yountville, California
  • 1131 room
  • 772 rooms
  • 963 rooms
  • 1184 rooms
  • 765 rooms
  • 326 rooms
  • 127 rooms
  • 08 rooms
  • 89+ rooms
Year house built
Median 2022 house/condo value by year built
Median house/condo value by year householder moved into unit
Breakdown of mean house values by ages of householders
Owners and renters by unit type in Yountville, CA
  • Yountville, CA household income distribution

  • Distribution of median household income in Yountville, CA in 2022
  • 80Less than $10,000
  • 154$10,000 to $19,999
  • 86$20,000 to $29,999
  • 195$30,000 to $39,999
  • 83$40,000 to $49,999
  • 86$50,000 to $59,999
  • 144$60,000 to $74,999
  • 196$75,000 to $99,999
  • 171$100,000 to $124,999
  • 63$125,000 to $149,999
  • 114$150,000 to $199,999
  • 219$200,000 or more
  • Home value of owner - occupied houses in 2022 in Yountville, CA

  • Distribution of house value in Yountville, CA in 2022
  • 14Less than $10,000
  • 7$20,000 to $24,999
  • 5$35,000 to $39,999
  • 3$80,000 to $89,999
  • 61$100,000 to $124,999
  • 13$125,000 to $149,999
  • 56$150,000 to $174,999
  • 14$175,000 to $199,999
  • 15$200,000 to $249,999
  • 150$250,000 to $299,999
  • 67$300,000 to $399,999
  • 28$400,000 to $499,999
  • 69$500,000 to $749,999
  • 197$750,000 to $999,999
  • 106$1,000,000 to $1,499,999
  • 118$1,500,000 to $1,999,999
  • 109$2,000,000 or more
  • Rent paid by renters in 2022 in Yountville, CA

  • Distribution of rent paid by renters in Yountville, CA in 2022
  • 19$200 to $249
  • 23$650 to $699
  • 13$800 to $899
  • 42$1,000 to $1,249
  • 66$1,250 to $1,499
  • 150$1,500 to $1,999
  • 94$2,000 to $2,499
  • 58$2,500 to $2,999
  • 17$3,000 to $3,499
  • 33$3,500 or more
  • 14No cash rent
Time Leaving Home To Go To Work in 2022

Percentage of workers working in this county: 91.5%
Number of people working at home: 258 (21.0% of all workers)

Travel time (in minutes) to work in 2022

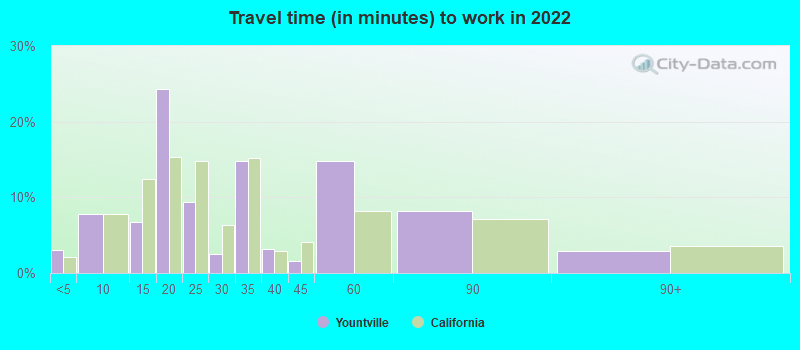
Travel time to work (commute)

  • Less than 5 minutes: 92
  • 5 to 9 minutes: 246
  • 10 to 14 minutes: 25
  • 15 to 19 minutes: 148
  • 20 to 24 minutes: 79
  • 25 to 29 minutes: 27
  • 30 to 34 minutes: 157
  • 35 to 39 minutes: 45
  • 40 to 44 minutes: 40
  • 45 to 59 minutes: 32
  • 60 to 89 minutes: 65
  • 90 or more minutes: 5
Means of transportation to work in 2022 - Yountville

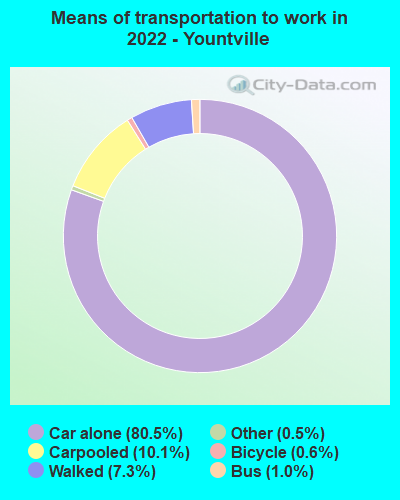
Means of transportation to work:

  • Drove a car alone: 2,404 (72.1%)
  • Carpooled: 359 (10.8%)
  • Bus: 19 (0.6%)
  • Taxi: 20 (0.6%)
  • Bicycle: 24 (0.7%)
  • Walked: 222 (6.7%)
  • Worked at home: 258 (7.7%)
Class of Workers in 2022
  • Unemployment by race in 2022
  • Unemployment rate for White non-Hispanic residents
  • 7.2%Males
  • 14.1%Females
  • Unemployment rate for other race residents
  • 24.5%Males
  • Unemployment rate for two or more race residents
  • 19.9%Males
  • Unemployment rate for Hispanic or Latino residents
  • 2.4%Males
Year of entry for the foreign-born population in Yountville, California
  • Year of entry for the foreign-born population in Yountville, California
  • 112010 or later
  • 362000 to 2009
  • 261990 to 1999
  • 501980 to 1989
  • 411970 to 1979
  • 109Before 1970
Ancestries in Yountville, CA

First ancestries reported:

  • English: 174 (10.2%)
  • German: 171 (10.0%)
  • American: 120 (7.0%)
  • Italian: 92 (5.4%)
  • European: 89 (5.2%)
  • Russian: 47 (2.7%)
  • Irish: 31 (1.8%)
  • Polish: 29 (1.7%)
  • French: 28 (1.6%)
  • Jamaican: 23 (1.3%)
  • Swiss: 18 (1.1%)
  • Ukrainian: 17 (1.0%)
  • Eastern European: 16 (0.9%)
  • Serbian: 14 (0.8%)
  • Danish: 12 (0.7%)
  • British: 10 (0.6%)
  • Celtic: 9 (0.5%)
  • Scottish: 7 (0.4%)
  • Norwegian: 6 (0.4%)
  • Iranian: 5 (0.3%)
  • African: 5 (0.3%)
  • Scandinavian: 4 (0.2%)
  • Hungarian: 3 (0.2%)
  • Slovene: 2 (0.1%)

Most common places of birth for foreign-born residents (%):

Mexico
Yountville:

41.5% (196)
California:

37.2% (3,881,193)

Philippines
Yountville:

13.1% (62)
California:

7.8% (818,297)

England
Yountville:

4.7% (22)
California:

0.6% (57,953)

Germany
Yountville:

4.4% (21)
California:

0.7% (73,304)

Jamaica
Yountville:

4.4% (21)
California:

0.2% (15,939)

Poland
Yountville:

2.8% (13)
California:

0.2% (20,997)

India
Yountville:

2.8% (13)
California:

5.2% (539,184)

Canada
Yountville:

2.8% (13)
California:

1.2% (127,477)

Iran
Yountville:

2.5% (12)
California:

2.0% (206,004)

Australia
Yountville:

2.5% (12)
California:

0.2% (23,338)

United Kingdom, excluding England and Scotland
Yountville:

2.3% (11)
California:

0.6% (60,582)

Korea
Yountville:

1.9% (9)
California:

3.0% (315,248)

France
Yountville:

1.9% (9)
California:

0.4% (40,224)

Place of birth for U.S.-born residents:

  • This state: 2,012
  • Other state: 751
  • Northeast: 293
  • Midwest: 208
  • South: 209
  • West: 72

90.4% of Yountville residents lived in the same house 1 years ago.
   Out of people who lived in different houses, 38.6% lived in this county.
   Out of people who lived in different counties, 100.0% lived in California.


Yountville:

90.4%
State average:

88.9%

Education attainment for males 25 years and older:

  • No schooling: 127
  • Nursery to 4th grade: 0
  • 5th and 6th grade: 16
  • 7th and 8th grade: 52
  • 9th grade: 0
  • 10th grade: 0
  • 11th grade: 13
  • 12th grade, no diploma: 7
  • High school graduate (or equivalency): 422
  • Less than 1 year of college: 46
  • Some college more than 1 year, no degree: 122
  • Associate degree: 54
  • Bachelor's degree: 322
  • Master's degree: 173
  • Professional school degree: 88
  • Doctorate degree: 12
Educational Attainment for Males

Education attainment for females 25 years and older:

  • No schooling: 71
  • Nursery to 4th grade: 0
  • 5th and 6th grade: 17
  • 7th and 8th grade: 31
  • 9th grade: 0
  • 10th grade: 3
  • 11th grade: 67
  • 12th grade, no diploma: 27
  • High school graduate (or equivalency): 263
  • Less than 1 year of college: 256
  • Some college more than 1 year, no degree: 257
  • Associate degree: 144
  • Bachelor's degree: 414
  • Master's degree: 51
  • Professional school degree: 32
  • Doctorate degree: 9
Educational Attainment for Females
Yountville marital status for males
Yountville marital status for females

Housing units in structures:

  • One, detached: 778
  • One, attached: 163
  • Two: 77
  • 3 or 4: 143
  • 5 to 9: 32
  • 10 to 19: 42
  • 20 to 49: 50
  • 50 or more: 120
  • Mobile homes: 438
  • Boats, RVs, vans, etc.: 6

Median worth of mobile homes: $261,663

Housing units lacking complete plumbing facilities in 2022: 0.3%

Housing units lacking complete kitchen facilities in 2022: 7.5%

House/condo owner moved in on average 15 years ago

Renter moved in on average 0 years ago

Year householders moved into residence in Yountville
Houses and condos Apartments
Most commonly used house heating fuel in houses and condos in Yountville, CA
  • 80.2%Utility gas
  • 19.2%Electricity
  • 0.6%Other fuel
Most commonly used house heating fuel in apartments in Yountville, CA
  • 69.6%Electricity
  • 29.4%Utility gas
  • 1.0%No fuel used

Private vs. public school enrollment:

Students in private schools in grades 1 to 8 (elementary and middle school): 8
Here:

9.6%
California:

10.5%

Students in private schools in grades 9 to 12 (high school): 0
Here:

0.0%
California:

8.5%

Students in private undergraduate colleges: 37
Here:

72.5%
California:

15.9%
School Enrollment by Level of School for Male Students
School Enrollment by Level of School for Female Students
Age and Sex of Sensory-Disabled Noninstitutionalized Residents
Age and Sex of Physically-Disabled Noninstitutionalized Residents
Age and Sex of Mentally-Disabled Noninstitutionalized Residents
Age and Sex of Self-Care Disabled Noninstitutionalized Residents
Age and Sex of Go-Outside-Home Disabled Noninstitutionalized Residents
Age and Sex of Noninstitutionalized Residents with Employment Disability