Youngtown, AZ (Arizona) Houses and Residents
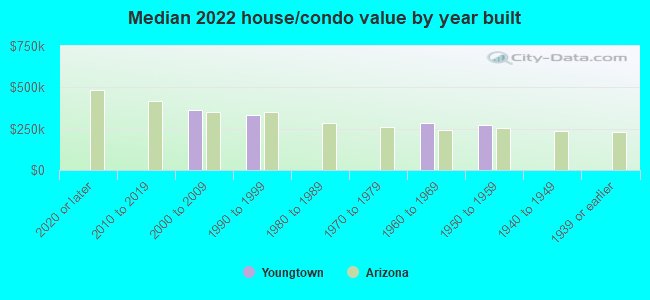
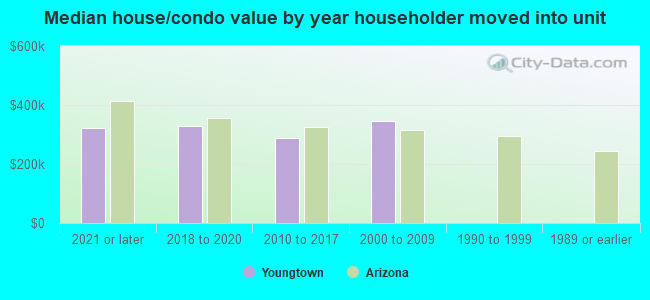
| Youngtown: | $329,857 |
| Arizona: | $402,800 |
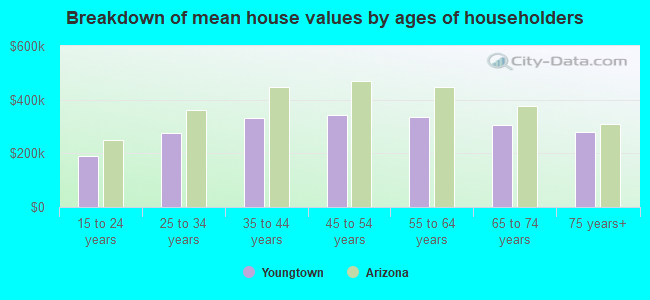
Mean price in 2022:
Detached houses: $314,268
Here: $314,268 State: $521,408 In 5-or-more-unit structures: $99,665
Here: $99,665 State: $371,286
Total population: 6,542 (Urban population: 3,007, Rural population: 0)
Houses: 2,749 (2,575 occupied: 1,390 owner occupied, 1,200 renter occupied)
| % of renters here: | 46% |
| State: | 33% |
Housing density: 2,097 houses/condos per square mile
Median price asked for vacant for-sale houses and condos in 2022: $130,385.
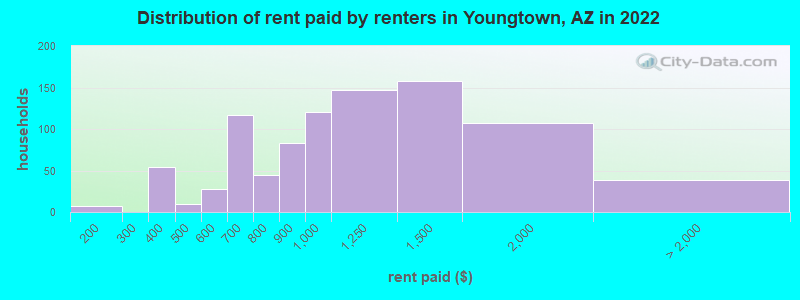
Median contract rent in 2022: $1,089 (lower quartile is $795, upper quartile is $1,370)
Median rent asked for vacant for-rent units in 2022: $1,311
Median gross rent in Youngtown, AZ in 2022: $1,282
Housing units in Youngtown with a mortgage: 1,077 (34 second mortgage, 0 home equity loan, 30 both second mortgage and home equity loan)
Houses without a mortgage: 0
Median household income for houses/condos with a mortgage: $75,978
Median household income for apartments without a mortgage: $53,056
Median monthly housing costs: $1,168
Compare current foreclosures near Youngtown, AZ:
| Photo | Address | Area | Beds / Baths | Price | Details |
|---|---|---|---|---|---|

|
#1
W Duluth Ave
Youngtown, AZ 85363
|
1,190 sq. feet
|
2 baths 3 beds |
show details | |

|
#2
N 111th Ave
Youngtown, AZ 85363
|
1,598 sq. feet
|
1 baths 3 beds |
show details | |

|
#3
W Green Dr
Youngtown, AZ 85363
|
2,246 sq. feet
|
- baths - beds |
show details | |

|
#4
N 111th Ave
Youngtown, AZ 85363
|
- sq. feet
|
- baths - beds |
show details | |

|
#5
W Duran Ave
Youngtown, AZ 85363
|
- sq. feet
|
- baths - beds |
show details | |

|
#6
W Nebraska Ave
Youngtown, AZ 85363
|
1,309 sq. feet
|
- baths - beds |
show details | |

|
#7
W Mountain View Rd
Youngtown, AZ 85363
|
2,002 sq. feet
|
- baths - beds |
show details | |

|
#8
W Duluth Ave
Youngtown, AZ 85363
|
800 sq. feet
|
- baths - beds |
show details | |

|
#9
W Retheford Rd
Youngtown, AZ 85363
|
- sq. feet
|
- baths - beds |
show details | |

|
#10
N 112th Dr
Youngtown, AZ 85363
|
- sq. feet
|
- baths - beds |
show details |
| Photo | Address | Area | Beds / Baths | Price | Details |
|---|---|---|---|---|---|

|
#11
W Cinnabar Ave
Youngtown, AZ 85363
|
1,603 sq. feet
|
- baths - beds |
show details | |

|
#12
W Abbott Ave
Sun City, AZ 85351
|
1,266 sq. feet
|
2 baths 2 beds |
$225,000
|
show details |

|
#13
W Retherford Rd
Youngtown, AZ 85363
|
- sq. feet
|
- baths - beds |
show details | |

|
#14
W Retherford Rd
Youngtown, AZ 85363
|
- sq. feet
|
- baths - beds |
show details | |

|
#15
E Devonshire Ave Unit 4014
Phoenix, AZ 85014
|
1,248 sq. feet
|
2 baths 2 beds |
show details | |

|
#16
N 43rd Ave
Glendale, AZ 85301
|
1,408 sq. feet
|
2 baths 3 beds |
show details | |

|
#17
W Mountain View Blvd Unit 12102
Surprise, AZ 85374
|
840 sq. feet
|
1 baths 1 beds |
show details | |

|
#18
N 19th Ave Unit 1055
Phoenix, AZ 85023
|
927 sq. feet
|
2 baths 2 beds |
show details | |

|
#19
E Tracy Ln # 7
Phoenix, AZ 85032
|
960 sq. feet
|
1 baths 2 beds |
show details | |

|
#20
W Michelle Dr
Phoenix, AZ 85023
|
1,036 sq. feet
|
2 baths 3 beds |
show details |
| Photo | Address | Area | Beds / Baths | Price | Details |
|---|---|---|---|---|---|

|
#21
W Dana Ln
Avondale, AZ 85392
|
2,305 sq. feet
|
3 baths 3 beds |
show details | |

|
#22
W Berridge Ln
Phoenix, AZ 85015
|
1,302 sq. feet
|
2 baths 3 beds |
show details | |

|
#23
W Palo Verde Ave
Peoria, AZ 85345
|
2,945 sq. feet
|
3 baths 4 beds |
show details | |

|
#24
N 85th Dr
Peoria, AZ 85345
|
1,680 sq. feet
|
2 baths 3 beds |
show details | |

|
#25
N 21st St
Phoenix, AZ 85016
|
2,009 sq. feet
|
2 baths 3 beds |
show details | |

|
#26
W Gibson Ln
Goodyear, AZ 85338
|
1,570 sq. feet
|
2 baths 4 beds |
show details | |

|
#27
W Glenrosa Ave
Phoenix, AZ 85015
|
2,154 sq. feet
|
3 baths 4 beds |
show details | |

|
#28
N 19th Dr
Phoenix, AZ 85015
|
1,135 sq. feet
|
2 baths 3 beds |
show details | |

|
#29
W Trumbull Rd
Tolleson, AZ 85353
|
1,850 sq. feet
|
2 baths 4 beds |
show details | |

|
#30
N 126th Ave
Litchfield Park, AZ 85340
|
1,524 sq. feet
|
2 baths 3 beds |
show details |
| Photo | Address | Area | Beds / Baths | Price | Details |
|---|---|---|---|---|---|

|
#31
W Pierson St
Phoenix, AZ 85037
|
- sq. feet
|
2 baths 2 beds |
show details | |

|
#32
W Yucca St
Glendale, AZ 85304
|
1,805 sq. feet
|
2 baths 3 beds |
show details | |

|
#33
N 89th Ave
Phoenix, AZ 85037
|
1,205 sq. feet
|
2 baths 3 beds |
show details | |

|
#34
W Llano Dr
Litchfield Park, AZ 85340
|
4,457 sq. feet
|
3 baths 5 beds |
show details | |

|
#35
W Maui Ln
Surprise, AZ 85379
|
1,756 sq. feet
|
2 baths 3 beds |
show details | |

|
#36
N 36th Ave
Glendale, AZ 85310
|
1,518 sq. feet
|
2 baths 3 beds |
show details | |

|
#37
W Peck Dr
Glendale, AZ 85303
|
1,507 sq. feet
|
2 baths 4 beds |
show details | |

|
#38
W Coolidge St
Phoenix, AZ 85037
|
- sq. feet
|
1 baths 3 beds |
show details | |

|
#39
W Glenn Dr
Glendale, AZ 85307
|
- sq. feet
|
2 baths 4 beds |
show details | |

|
#40
W Gardenia Ave
Glendale, AZ 85303
|
1,190 sq. feet
|
2 baths 3 beds |
show details |
| Photo | Address | Area | Beds / Baths | Price | Details |
|---|---|---|---|---|---|

|
#41
N 157th Ave
Litchfield Park, AZ 85340
|
1,700 sq. feet
|
2 baths 3 beds |
show details | |

|
#42
N 21st Ave
Phoenix, AZ 85015
|
1,608 sq. feet
|
2 baths 3 beds |
show details | |

|
#43
N 24th Dr
Phoenix, AZ 85015
|
936 sq. feet
|
1 baths 2 beds |
show details | |

|
#44
W Yucatan St
Surprise, AZ 85379
|
5,167 sq. feet
|
4 baths 5 beds |
show details | |

|
#45
N 10th Ave
Phoenix, AZ 85021
|
1,953 sq. feet
|
2 baths 2 beds |
show details | |

|
#46
W State Ave
Glendale, AZ 85303
|
1,117 sq. feet
|
2 baths 2 beds |
show details | |

|
#47
W Winslow Ave
Phoenix, AZ 85043
|
1,783 sq. feet
|
3 baths 4 beds |
show details | |

|
#48
W Poinsettia Dr
Avondale, AZ 85392
|
1,062 sq. feet
|
2 baths 3 beds |
show details | |

|
#49
W Jones Ave
Tolleson, AZ 85353
|
1,905 sq. feet
|
2 baths 3 beds |
show details | |

|
Check over 1 million property listings on Foreclosure.com!
|
browse all offers | |||

Latest news about housing in Youngtown, AZ collected exclusively by city-data.com from local newspapers, TV, and radio stations

 | Sun City Unbiased Opinions (31 replies) |
| Sun City in 30 years (11 replies) |
| Sun city,az (11 replies) |
| crime rate in sun city,az (16 replies) |
| Need some leads on a rental (5 replies) |
| Sun City, Sun City West, El Mirage, Peoria, Avondale or Goodyear (84 replies) |

Median year apartment built: 1980
Household type by relationship:
Households: 7,170- Male householders: 1,361 (431 living alone), Female householders: 1,205 (533 living alone)
873 spouses (873 opposite-sex spouses), 313 unmarried partners, (294 opposite-sex unmarried partners), 2,281 children (2,108 natural, 81 adopted, 91 stepchildren), 230 grandchildren, 12 brothers or sisters, 137 parents, 11 foster children, 88 other relatives, 346 non-relatives
- In group quarters: 309
Size of family households: 358 2-persons, 324 3-persons, 314 4-persons, 309 5-persons, 65 6-persons, 56 7-or-more-persons.
Size of nonfamily households: 968 1-person, 129 2-persons, 18 3-persons, 15 4-persons, 10 6-persons, 9 7-or-more-persons.
1,026 married couples with children.
473 single-parent households (241 men, 232 women).
69.4% of residents of Youngtown speak English at home.
24.5% of residents speak Spanish at home (67% speak English very well, 23% speak English well, 4% speak English not well, 6% don't speak English at all).
1.9% of residents speak other Indo-European language at home (76% speak English very well, 12% speak English well, 12% don't speak English at all).
1.0% of residents speak Asian or Pacific Island language at home (70% speak English very well, 18% speak English well, 12% speak English not well).
3.1% of residents speak other language at home (97% speak English very well, 3% speak English well).
Foreign born population: 1,021 (14.2%)
(49.8% of them are naturalized citizens)
| Here: | 5.7 |
| State: | 6.0 |
| Here: | 4.2 |
| State: | 4.1 |
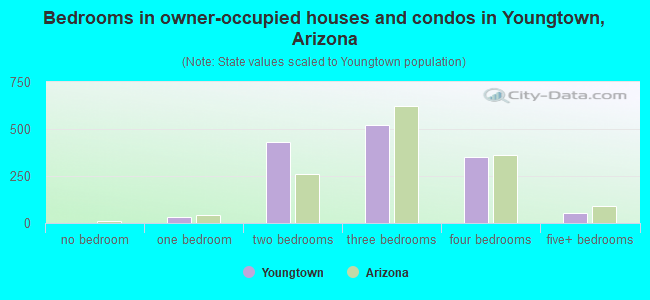
- Bedrooms in owner-occupied houses and condos in Youngtown, Arizona
- 0no bedroom
- 301 bedroom
- 4312 bedrooms
- 5233 bedrooms
- 3534 bedrooms
- 525+ bedrooms
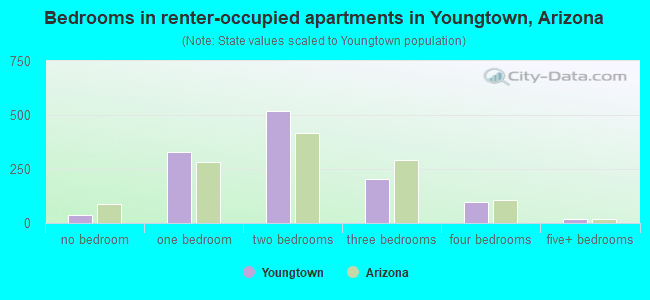
- Bedrooms in renter-occupied apartments in Youngtown, Arizona
- 37no bedroom
- 3271 bedroom
- 5192 bedrooms
- 2023 bedrooms
- 974 bedrooms
- 185+ bedrooms
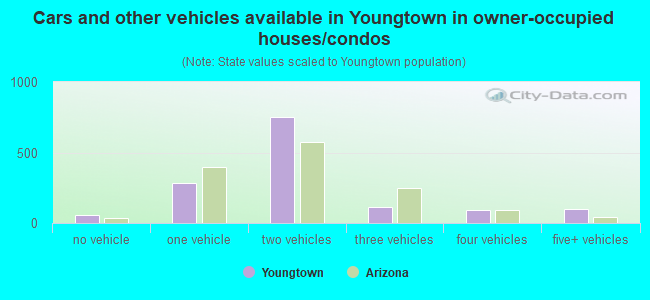
- Cars and other vehicles available in Youngtown in owner-occupied houses/condos
- 54no vehicle
- 2821 vehicle
- 7512 vehicles
- 1103 vehicles
- 954 vehicles
- 985+ vehicles
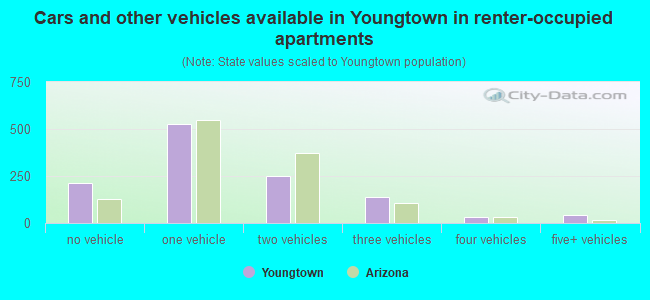
- Cars and other vehicles available in Youngtown in renter-occupied apartments
- 215no vehicle
- 5271 vehicle
- 2492 vehicles
- 1363 vehicles
- 334 vehicles
- 415+ vehicles
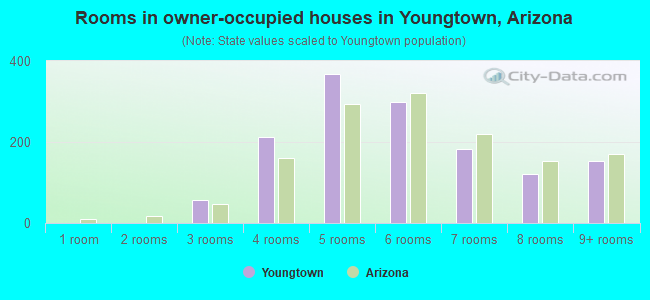
- Rooms in owner-occupied houses in Youngtown, Arizona
- 01 room
- 02 rooms
- 563 rooms
- 2134 rooms
- 3685 rooms
- 2986 rooms
- 1827 rooms
- 1218 rooms
- 1529+ rooms
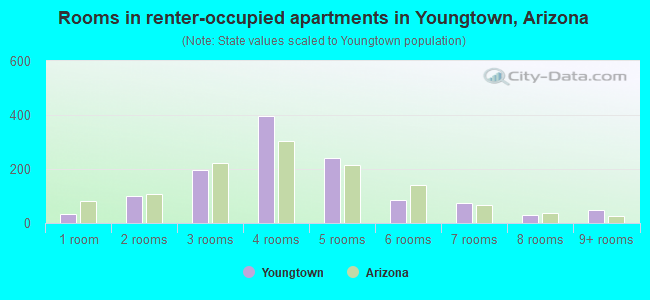
- Rooms in renter-occupied apartments in Youngtown, Arizona
- 321 room
- 1002 rooms
- 1963 rooms
- 3984 rooms
- 2405 rooms
- 846 rooms
- 757 rooms
- 298 rooms
- 479+ rooms
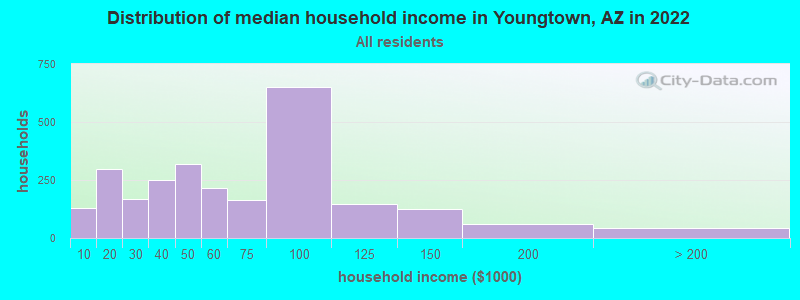
Youngtown, AZ household income distribution

- 129Less than $10,000
- 298$10,000 to $19,999
- 166$20,000 to $29,999
- 248$30,000 to $39,999
- 318$40,000 to $49,999
- 216$50,000 to $59,999
- 162$60,000 to $74,999
- 651$75,000 to $99,999
- 147$100,000 to $124,999
- 127$125,000 to $149,999
- 60$150,000 to $199,999
- 42$200,000 or more
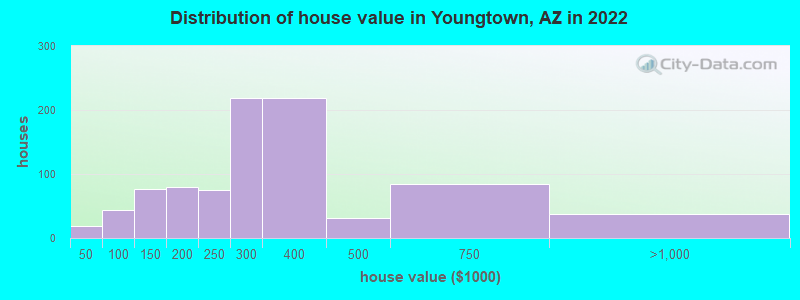
Home value of owner - occupied houses in 2022 in Youngtown, AZ
-
- 17$15,000 to $19,999
- 0$25,000 to $29,999
- 33$70,000 to $79,999
- 10$80,000 to $89,999
- 29$100,000 to $124,999
- 47$125,000 to $149,999
- 33$150,000 to $174,999
- 46$175,000 to $199,999
- 74$200,000 to $249,999
- 217$250,000 to $299,999
- 219$300,000 to $399,999
- 32$400,000 to $499,999
- 83$500,000 to $749,999
- 37$750,000 to $999,999
Rent paid by renters in 2022 in Youngtown, AZ
-
- 6$100 to $149
- 53$350 to $399
- 10$450 to $499
- 14$500 to $549
- 13$550 to $599
- 65$600 to $649
- 51$650 to $699
- 10$700 to $749
- 33$750 to $799
- 83$800 to $899
- 120$900 to $999
- 146$1,000 to $1,249
- 157$1,250 to $1,499
- 107$1,500 to $1,999
- 18$2,000 to $2,499
- 21No cash rent
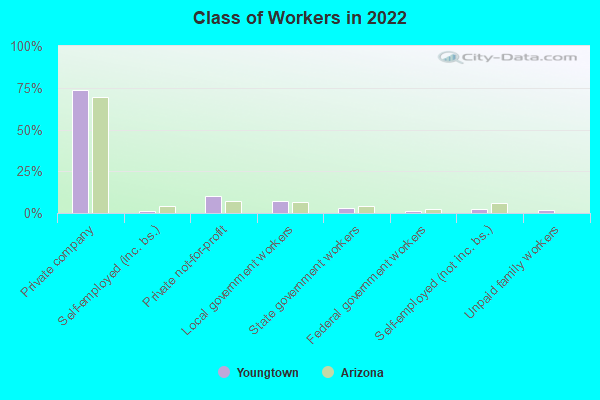
Percentage of workers working in this county: 95.4%
Number of people working at home: 370 (11.7% of all workers)
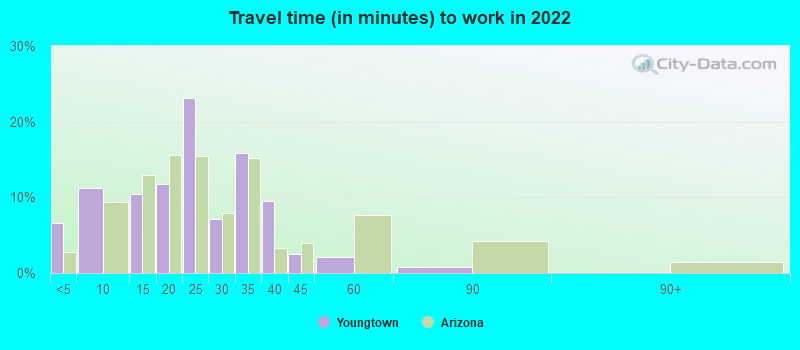
Travel time to work (commute)
- Less than 5 minutes: 139
- 5 to 9 minutes: 120
- 10 to 14 minutes: 229
- 15 to 19 minutes: 382
- 20 to 24 minutes: 529
- 25 to 29 minutes: 136
- 30 to 34 minutes: 645
- 35 to 39 minutes: 87
- 40 to 44 minutes: 136
- 45 to 59 minutes: 186
- 60 to 89 minutes: 43
- 90 or more minutes: 65
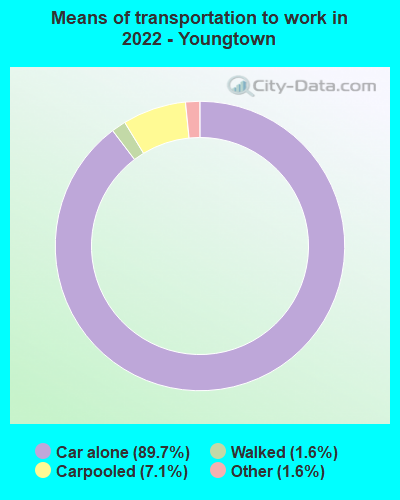
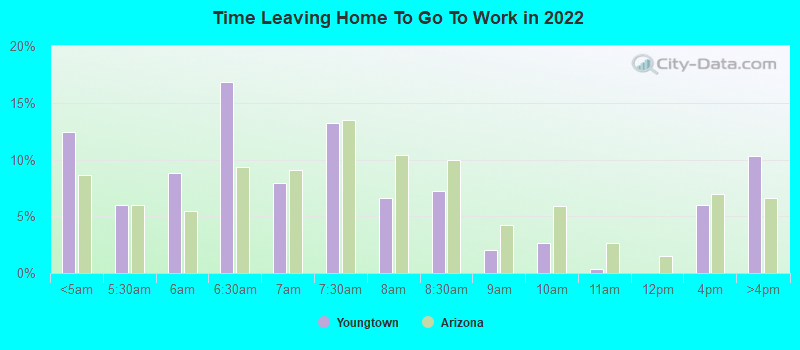
Means of transportation to work:
- Drove a car alone: 907 (66.3%)
- Carpooled: 76 (5.6%)
- Taxi: 20 (1.5%)
- Walked: 17 (1.2%)
- Worked at home: 370 (27.0%)
- Unemployment by race in 2022
- Unemployment rate for White non-Hispanic residents
- 1.5%Males
- 3.4%Females
- Unemployment rate for Black residents
- 67.3%Females
- Unemployment rate for American Indian and Alaska Native residents
- 100.0%Females
- Unemployment rate for two or more race residents
- 9.8%Males
- Unemployment rate for Hispanic or Latino residents
- 3.2%Males
- 2.7%Females
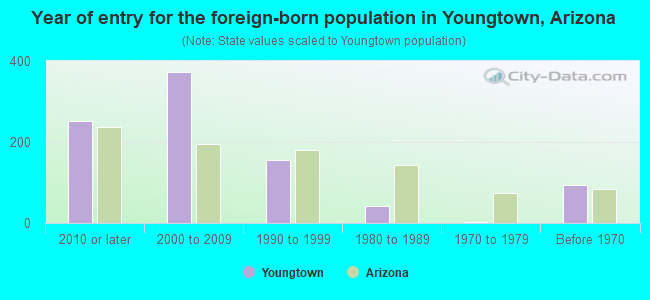
- Year of entry for the foreign-born population in Youngtown, Arizona
- 2512010 or later
- 3722000 to 2009
- 1561990 to 1999
- 411980 to 1989
- 31970 to 1979
- 93Before 1970
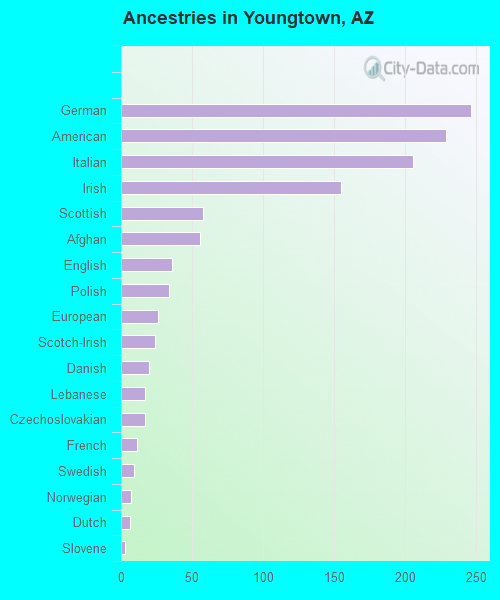
First ancestries reported:
- German: 247 (7.0%)
- American: 229 (6.5%)
- Italian: 206 (5.8%)
- Irish: 155 (4.4%)
- Scottish: 58 (1.6%)
- Afghan: 56 (1.6%)
- English: 36 (1.0%)
- Polish: 34 (1.0%)
- European: 26 (0.7%)
- Scotch-Irish: 24 (0.7%)
- Danish: 20 (0.6%)
- Lebanese: 17 (0.5%)
- Czechoslovakian: 17 (0.5%)
- French: 11 (0.3%)
- Swedish: 9 (0.3%)
- Norwegian: 7 (0.2%)
- Dutch: 6 (0.2%)
- Slovene: 3 (0.09%)
Most common places of birth for foreign-born residents (%):
| Youngtown: | 57.2% (584) |
| Arizona: | 53.4% (500,086) |
| Youngtown: | 23.9% (244) |
| Arizona: | 1.0% (9,335) |
| Youngtown: | 11.7% (119) |
| Arizona: | 0.3% (2,420) |
| Youngtown: | 4.1% (42) |
| Arizona: | 0.2% (1,996) |
| Youngtown: | 2.7% (28) |
| Arizona: | 1.5% (14,058) |
| Youngtown: | 1.8% (18) |
| Arizona: | 0.2% (1,831) |
| Youngtown: | 1.7% (17) |
| Arizona: | 0.2% (1,454) |
Place of birth for U.S.-born residents:
- This state: 3,358
- Other state: 2,663
- Northeast: 445
- Midwest: 913
- South: 412
- West: 882
85.9% of Youngtown residents lived in the same house 1 years ago.
Out of people who lived in different houses, 42.2% lived in this county.
Out of people who lived in different counties, 22.6% lived in Arizona.
| Youngtown: | 85.9% |
| State average: | 86.0% |
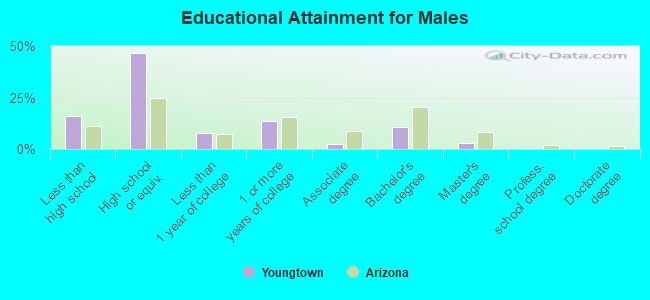
Education attainment for males 25 years and older:
- No schooling: 84
- Nursery to 4th grade: 0
- 5th and 6th grade: 28
- 7th and 8th grade: 54
- 9th grade: 27
- 10th grade: 56
- 11th grade: 36
- 12th grade, no diploma: 103
- High school graduate (or equivalency): 1,133
- Less than 1 year of college: 185
- Some college more than 1 year, no degree: 331
- Associate degree: 64
- Bachelor's degree: 259
- Master's degree: 67
- Professional school degree: 4
- Doctorate degree: 0
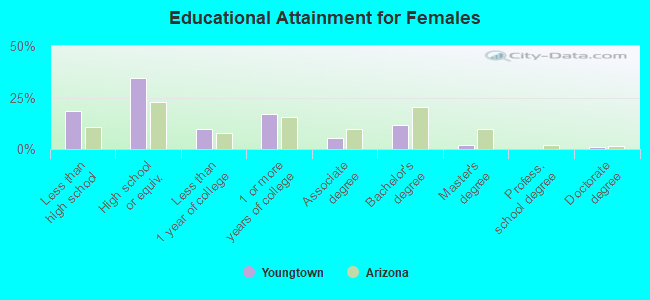
Education attainment for females 25 years and older:
- No schooling: 32
- Nursery to 4th grade: 8
- 5th and 6th grade: 28
- 7th and 8th grade: 83
- 9th grade: 28
- 10th grade: 155
- 11th grade: 5
- 12th grade, no diploma: 104
- High school graduate (or equivalency): 825
- Less than 1 year of college: 232
- Some college more than 1 year, no degree: 404
- Associate degree: 127
- Bachelor's degree: 282
- Master's degree: 41
- Professional school degree: 0
- Doctorate degree: 26


Housing units in structures:
- One, detached: 1,947
- One, attached: 104
- Two: 84
- 3 or 4: 86
- 5 to 9: 164
- 10 to 19: 83
- 20 to 49: 19
- 50 or more: 258
Housing units lacking complete kitchen facilities in 2022: 0.6%
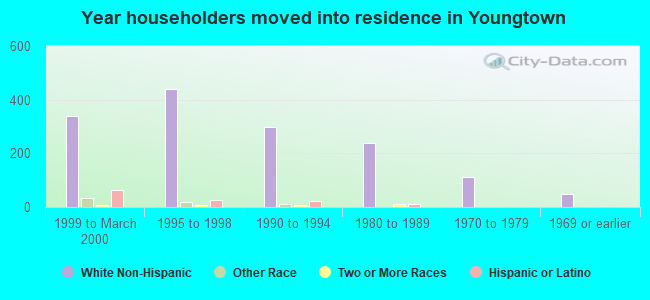
House/condo owner moved in on average 7 years ago
Renter moved in on average 5 years ago
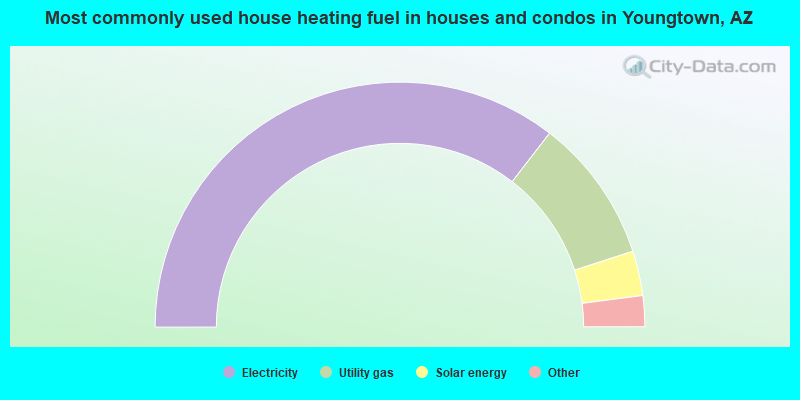
- 71.0%Electricity
- 19.1%Utility gas
- 5.9%Solar energy
- 2.2%Bottled, tank, or LP gas
- 1.9%No fuel used
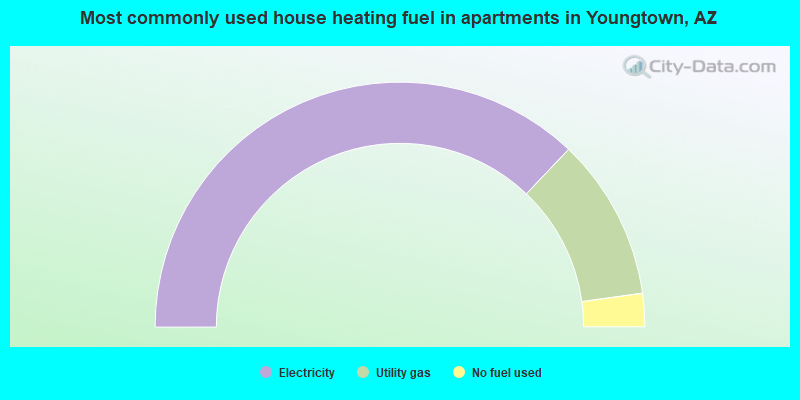
- 74.2%Electricity
- 21.4%Utility gas
- 4.4%No fuel used
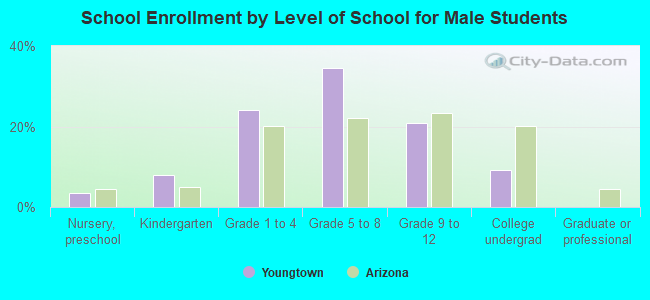
Private vs. public school enrollment:
| Here: | 19.9% |
| Arizona: | 10.4% |
| Here: | 16.5% |
| Arizona: | 8.8% |
| Here: | 17.6% |
| Arizona: | 13.1% |