Yarmouth Port, MA (Massachusetts) Houses and Residents
| Yarmouth Port: | $591,008 |
| Massachusetts: | $534,700 |
Mean price in 2022:
Detached houses: $621,731
Here: $621,731 State: $651,570 Townhouses or other attached units: $534,033
Here: $534,033 State: $617,749 In 2-unit structures: $455,828
Here: $455,828 State: $594,808 In 3-to-4-unit structures: $531,712
Here: $531,712 State: $601,912 In 5-or-more-unit structures: $287,130
Here: $287,130 State: $555,768
Total population: 5,320 (Urban population: 5,212, Rural population: 0)
Houses: 3,525 (2,768 occupied: 2,740 owner occupied, 209 renter occupied)
| % of renters here: | 7% |
| State: | 38% |
Housing density: 583 houses/condos per square mile
Median price asked for vacant for-sale houses and condos in 2022 in this county: $590,409.
Median contract rent in 2022: $1,458 (lower quartile is $1,008, upper quartile is $1,734)
Median rent asked for vacant for-rent units in 2022: $3,726
Median gross rent in Yarmouth Port, MA in 2022: $1,711
Housing units in Yarmouth Port with a mortgage: 1,307 (223 second mortgage, 9 home equity loan, 182 both second mortgage and home equity loan)
Houses without a mortgage: 62
Median household income for houses/condos with a mortgage: $119,213
Median household income for apartments without a mortgage: $99,444
Median monthly housing costs: $1,391
Compare current foreclosures near Yarmouth Port, MA:
| Photo | Address | Area | Beds / Baths | Price | Details |
|---|---|---|---|---|---|

|
#1
Tall Pines Dr
Yarmouth Port, MA 02675
|
1,560 sq. feet
|
1 baths 3 beds |
show details | |

|
#2
Spy Glass Hill Rd
Yarmouth Port, MA 02675
|
3,647 sq. feet
|
3 baths 3 beds |
show details | |

|
#3
Brush Hill Rd
Yarmouth Port, MA 02675
|
1,575 sq. feet
|
2 baths 3 beds |
show details | |

|
#4
Wharf Ln
Yarmouth Port, MA 02675
|
2,276 sq. feet
|
2 baths 4 beds |
show details | |

|
#5
Cobb Ave
Yarmouth Port, MA 02675
|
1,144 sq. feet
|
1 baths 3 beds |
show details | |

|
#6
Oakmont Rd
Yarmouth Port, MA 02675
|
2,141 sq. feet
|
2 baths 3 beds |
show details | |

|
#7
Manamok Cir
Sandwich, MA 02563
|
1,232 sq. feet
|
2 baths 3 beds |
show details | |

|
#8
Main St
Brewster, MA 02631
|
1,881 sq. feet
|
2 baths 5 beds |
show details | |

|
#9
Quaker Run Rd
Mashpee, MA 02649
|
3,010 sq. feet
|
3 baths 4 beds |
show details | |

|
#10
Gosnold St
Hyannis, MA 02601
|
2,184 sq. feet
|
3 baths 4 beds |
show details |
| Photo | Address | Area | Beds / Baths | Price | Details |
|---|---|---|---|---|---|

|
#11
Donegal Cir
Centerville, MA 02632
|
1,306 sq. feet
|
1 baths 2 beds |
show details | |

|
#12
Skunknet Rd
Centerville, MA 02632
|
1,464 sq. feet
|
2 baths 4 beds |
show details | |

|
#13
Chatham Rd
Harwich, MA 02645
|
1,230 sq. feet
|
2 baths 4 beds |
show details | |

|
#14
Yankee Dr # 1
Brewster, MA 02631
|
1,025 sq. feet
|
1 baths 2 beds |
show details | |

|
#15
N Precinct Rd
Centerville, MA 02632
|
1,128 sq. feet
|
2 baths 3 beds |
show details | |

|
#16
S Main St
Centerville, MA 02632
|
2,511 sq. feet
|
2 baths 5 beds |
show details | |

|
#17
Muskeget Ln
Centerville, MA 02632
|
2,052 sq. feet
|
1 baths 4 beds |
show details | |

|
#18
Nauset Ln
Centerville, MA 02632
|
1,232 sq. feet
|
2 baths 3 beds |
show details | |

|
#19
N Precinct Rd
Centerville, MA 02632
|
968 sq. feet
|
1 baths 2 beds |
show details | |

|
#20
Buckskin Path
Centerville, MA 02632
|
1,235 sq. feet
|
2 baths 3 beds |
show details |
| Photo | Address | Area | Beds / Baths | Price | Details |
|---|---|---|---|---|---|

|
#21
Hazel Ln
Brewster, MA 02631
|
1,372 sq. feet
|
1 baths 3 beds |
show details | |

|
#22
Pinecrest Rd
Centerville, MA 02632
|
925 sq. feet
|
1 baths 3 beds |
show details | |

|
#23
Long Pond Dr
Harwich, MA 02645
|
1,856 sq. feet
|
3 baths 5 beds |
show details | |

|
#24
Gleneagle Dr
Centerville, MA 02632
|
1,400 sq. feet
|
2 baths 3 beds |
show details | |

|
#25
Sachem Dr
Centerville, MA 02632
|
2,064 sq. feet
|
3 baths 4 beds |
show details | |

|
#26
Knowlton Ln
Marstons Mills, MA 02648
|
1,888 sq. feet
|
2 baths 3 beds |
show details | |

|
#27
Pond St
Centerville, MA 02632
|
980 sq. feet
|
1 baths 2 beds |
show details | |

|
#28
Rudder Rd
Hyannis, MA 02601
|
1,436 sq. feet
|
1 baths 3 beds |
show details | |

|
#29
Great Western Rd
Harwich, MA 02645
|
1,008 sq. feet
|
1 baths 3 beds |
show details | |

|
#30
Sunset Ter
Hyannis, MA 02601
|
1,783 sq. feet
|
1 baths 3 beds |
show details |
| Photo | Address | Area | Beds / Baths | Price | Details |
|---|---|---|---|---|---|

|
#31
W Hyannisport Cir
Hyannis, MA 02601
|
2,386 sq. feet
|
2 baths 4 beds |
show details | |

|
#32
Conners Rd
Centerville, MA 02632
|
2,240 sq. feet
|
3 baths 4 beds |
show details | |

|
#33
Arrowhead Dr
Hyannis, MA 02601
|
832 sq. feet
|
1 baths 2 beds |
show details | |

|
#34
Southgate Dr
Hyannis, MA 02601
|
1,152 sq. feet
|
3 baths 4 beds |
show details | |

|
#35
Ebenezar Ln
Brewster, MA 02631
|
768 sq. feet
|
1 baths 2 beds |
show details | |

|
#36
Desires Ln
West Barnstable, MA 02668
|
2,622 sq. feet
|
2 baths 3 beds |
show details | |

|
#37
Jonathans Way
Brewster, MA 02631
|
1,020 sq. feet
|
1 baths 2 beds |
show details | |

|
#38
Main St
Mashpee, MA 02649
|
1,430 sq. feet
|
2 baths 3 beds |
show details | |

|
#39
Cappawack Rd
Mashpee, MA 02649
|
1,428 sq. feet
|
1 baths 3 beds |
show details | |

|
#40
Sea Gull Ln
Eastham, MA 02642
|
1,507 sq. feet
|
2 baths 3 beds |
show details |
| Photo | Address | Area | Beds / Baths | Price | Details |
|---|---|---|---|---|---|

|
#41
Tupper Rd
Sandwich, MA 02563
|
2,872 sq. feet
|
4 baths 5 beds |
show details | |

|
#42
Dillingham Ave
Sandwich, MA 02563
|
1,008 sq. feet
|
1 baths 2 beds |
show details | |

|
#43
Main St
Mashpee, MA 02649
|
2,086 sq. feet
|
2 baths 3 beds |
show details | |

|
#44
Tupper Ave
Sandwich, MA 02563
|
1,344 sq. feet
|
2 baths 3 beds |
show details | |

|
#45
Bain Rd
Eastham, MA 02642
|
1,196 sq. feet
|
2 baths 3 beds |
show details | |

|
#46
Ashumet Rd Unit 17b
Mashpee, MA 02649
|
864 sq. feet
|
1 baths 2 beds |
show details | |

|
#47
Yardarm Dr
Mashpee, MA 02649
|
2,010 sq. feet
|
2 baths 3 beds |
show details | |

|
#48
Quinaquisset Ave
Mashpee, MA 02649
|
1,660 sq. feet
|
2 baths 2 beds |
show details | |

|
#49
Sandy Fox Dr
Mashpee, MA 02649
|
1,404 sq. feet
|
2 baths 3 beds |
show details | |

|
Check over 1 million property listings on Foreclosure.com!
|
browse all offers | |||


 | 2024 Real Estate Observations (899 replies) |
| 2023 Real Estate Observations (5278 replies) |
| Hyannis (13 replies) |
| What is West Yarmouth Like? (10 replies) |
| relocating to Cape Cod (8 replies) |
| Where to stay overnight in Cape Cod in April? (1 reply) |

Median year apartment built: 1984
Household type by relationship:
Households: 6,049- Male householders: 1,237 (186 living alone), Female householders: 1,550 (701 living alone)
1,568 spouses (1,545 opposite-sex spouses), 84 unmarried partners, (73 opposite-sex unmarried partners), 1,261 children (1,205 natural, 0 adopted, 55 stepchildren), 71 grandchildren, 155 brothers or sisters, 73 parents, 0 foster children, 23 other relatives, 22 non-relatives
- In group quarters: 2
Size of family households: 1,304 2-persons, 197 3-persons, 295 4-persons, 23 5-persons, 98 6-persons, 9 7-or-more-persons.
Size of nonfamily households: 950 1-person, 75 2-persons, 6 3-persons.
491 married couples with children.
106 single-parent households (51 men, 55 women).
95.0% of residents of Yarmouth Port speak English at home.
1.9% of residents speak Spanish at home (100% speak English very well).
4.2% of residents speak other Indo-European language at home (100% speak English very well).
Foreign born population: 217 (3.6%)
(90.3% of them are naturalized citizens)
| Here: | 6.4 |
| State: | 6.5 |
| Here: | 5.1 |
| State: | 4.0 |

- Bedrooms in owner-occupied houses and condos in Yarmouth Port, Massachusetts
- 10no bedroom
- 881 bedroom
- 6802 bedrooms
- 1,4823 bedrooms
- 4444 bedrooms
- 385+ bedrooms

- Bedrooms in renter-occupied apartments in Yarmouth Port, Massachusetts
- 49no bedroom
- 151 bedroom
- 472 bedrooms
- 503 bedrooms
- 474 bedrooms
- 05+ bedrooms

- Cars and other vehicles available in Yarmouth Port in owner-occupied houses/condos
- 133no vehicle
- 8961 vehicle
- 1,1432 vehicles
- 4263 vehicles
- 104 vehicles
- 1335+ vehicles

- Cars and other vehicles available in Yarmouth Port in renter-occupied apartments
- 10no vehicle
- 1341 vehicle
- 572 vehicles
- 93 vehicles
- 04 vehicles
- 05+ vehicles

- Rooms in owner-occupied houses in Yarmouth Port, Massachusetts
- 101 room
- 02 rooms
- 863 rooms
- 2134 rooms
- 5595 rooms
- 5656 rooms
- 5507 rooms
- 4128 rooms
- 3469+ rooms

- Rooms in renter-occupied apartments in Yarmouth Port, Massachusetts
- 491 room
- 02 rooms
- 83 rooms
- 264 rooms
- 395 rooms
- 266 rooms
- 157 rooms
- 388 rooms
- 109+ rooms


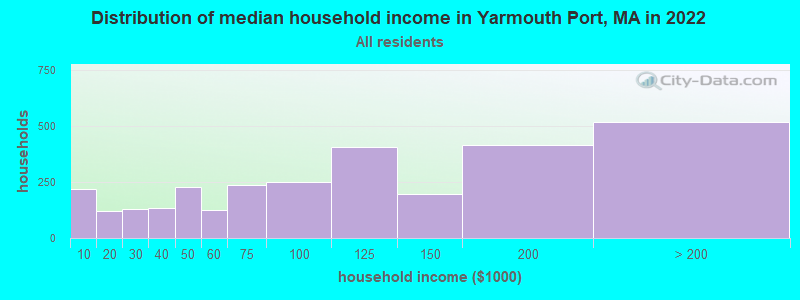
Yarmouth Port, MA household income distribution

- 217Less than $10,000
- 121$10,000 to $19,999
- 130$20,000 to $29,999
- 136$30,000 to $39,999
- 227$40,000 to $49,999
- 125$50,000 to $59,999
- 235$60,000 to $74,999
- 252$75,000 to $99,999
- 406$100,000 to $124,999
- 199$125,000 to $149,999
- 416$150,000 to $199,999
- 519$200,000 or more
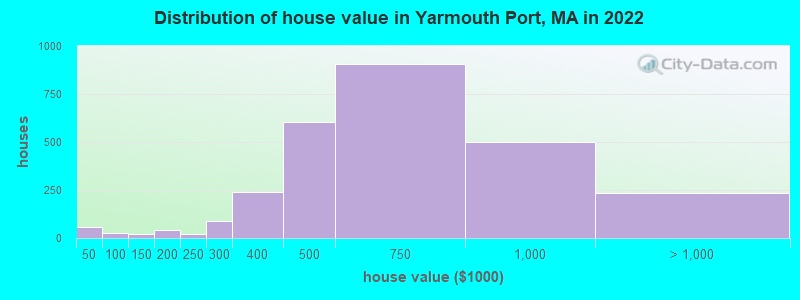
Home value of owner - occupied houses in 2022 in Yarmouth Port, MA
-
- 29$30,000 to $34,999
- 27$40,000 to $49,999
- 7$100,000 to $124,999
- 14$125,000 to $149,999
- 24$150,000 to $174,999
- 15$175,000 to $199,999
- 20$200,000 to $249,999
- 86$250,000 to $299,999
- 238$300,000 to $399,999
- 602$400,000 to $499,999
- 908$500,000 to $749,999
- 497$750,000 to $999,999
- 98$1,000,000 to $1,499,999
- 119$1,500,000 to $1,999,999
- 14$2,000,000 or more
Rent paid by renters in 2022 in Yarmouth Port, MA
-
- 26$700 to $749
- 34$1,000 to $1,249
- 30$1,250 to $1,499
- 60$1,500 to $1,999
- 12$2,000 to $2,499
- 14No cash rent


Percentage of workers working in this county: 86.6%
Number of people working at home: 506 (18.5% of all workers)
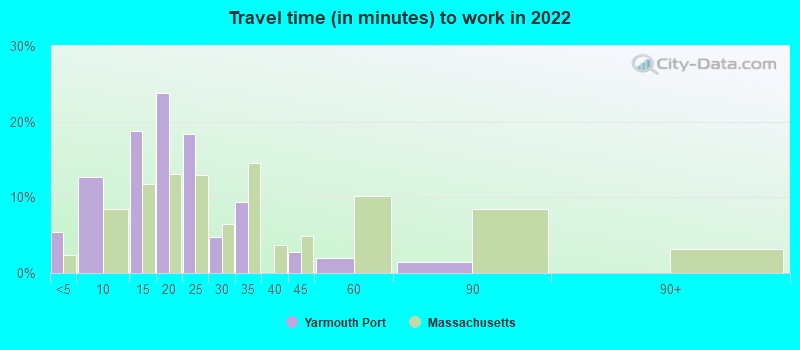
Travel time to work (commute)
- Less than 5 minutes: 73
- 5 to 9 minutes: 82
- 10 to 14 minutes: 304
- 15 to 19 minutes: 672
- 20 to 24 minutes: 416
- 25 to 29 minutes: 118
- 30 to 34 minutes: 270
- 35 to 39 minutes: 17
- 40 to 44 minutes: 58
- 45 to 59 minutes: 152
- 60 to 89 minutes: 84
- 90 or more minutes: 29
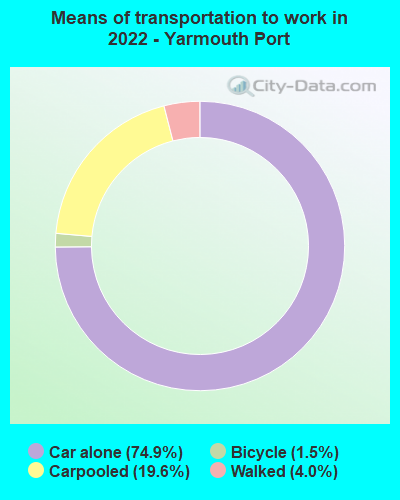
Means of transportation to work:
- Drove a car alone: 699 (48.9%)
- Carpooled: 180 (12.6%)
- Bicycle: 15 (1.1%)
- Walked: 26 (1.8%)
- Worked at home: 506 (35.4%)

- Unemployment by race in 2022
- Unemployment rate for White non-Hispanic residents
- 3.0%Males
- 0.6%Females

- Year of entry for the foreign-born population in Yarmouth Port, Massachusetts
- 352010 or later
- 122000 to 2009
- 341990 to 1999
- 81980 to 1989
- 161970 to 1979
- 109Before 1970

First ancestries reported:
- Irish: 762 (31.0%)
- English: 397 (16.2%)
- Italian: 209 (8.5%)
- German: 122 (5.0%)
- French: 105 (4.3%)
- French Canadian: 92 (3.7%)
- Hungarian: 90 (3.7%)
- Scottish: 56 (2.3%)
- Swedish: 53 (2.2%)
- American: 40 (1.6%)
- European: 36 (1.5%)
- Polish: 32 (1.3%)
- Brazilian: 30 (1.2%)
- Portuguese: 26 (1.1%)
- Russian: 25 (1.0%)
- British: 24 (1.0%)
- Ukrainian: 24 (1.0%)
- Armenian: 22 (0.9%)
- Scotch-Irish: 15 (0.6%)
- Lithuanian: 7 (0.3%)
- Belgian: 6 (0.2%)
- Czech: 6 (0.2%)
- Dutch: 5 (0.2%)
- Welsh: 5 (0.2%)
- Slovak: 4 (0.2%)
Most common places of birth for foreign-born residents (%):
| Yarmouth Port: | 25.8% (59) |
| Massachusetts: | 0.2% (2,809) |
| Yarmouth Port: | 13.1% (30) |
| Massachusetts: | 7.6% (92,959) |
| Yarmouth Port: | 10.0% (23) |
| Massachusetts: | 2.3% (28,158) |
| Yarmouth Port: | 8.3% (19) |
| Massachusetts: | 0.2% (2,737) |
| Yarmouth Port: | 7.0% (16) |
| Massachusetts: | 6.8% (82,934) |
| Yarmouth Port: | 6.6% (15) |
| Massachusetts: | 0.9% (10,698) |
| Yarmouth Port: | 4.8% (11) |
| Massachusetts: | 1.5% (18,278) |
| Yarmouth Port: | 4.8% (11) |
| Massachusetts: | 2.3% (27,810) |
| Yarmouth Port: | 3.9% (9) |
| Massachusetts: | 1.4% (16,886) |
| Yarmouth Port: | 3.5% (8) |
| Massachusetts: | 1.0% (12,529) |
| Yarmouth Port: | 3.5% (8) |
| Massachusetts: | 0.9% (10,915) |
| Yarmouth Port: | 3.1% (7) |
| Massachusetts: | 0.2% (1,923) |
| Yarmouth Port: | 3.1% (7) |
| Massachusetts: | 0.1% (1,245) |
| Yarmouth Port: | 2.6% (6) |
| Massachusetts: | 1.1% (13,446) |
| Yarmouth Port: | 2.6% (6) |
| Massachusetts: | 2.7% (32,733) |
Place of birth for U.S.-born residents:
- This state: 3,585
- Other state: 2,161
- Northeast: 1,290
- Midwest: 276
- South: 255
- West: 314
92.1% of Yarmouth Port residents lived in the same house 1 years ago.
Out of people who lived in different houses, 16.8% lived in this county.
Out of people who lived in different counties, 32.8% lived in Massachusetts.
| Yarmouth Port: | 92.1% |
| State average: | 87.7% |
Education attainment for males 25 years and older:
- No schooling: 33
- Nursery to 4th grade: 11
- 5th and 6th grade: 0
- 7th and 8th grade: 0
- 9th grade: 0
- 10th grade: 0
- 11th grade: 15
- 12th grade, no diploma: 63
- High school graduate (or equivalency): 324
- Less than 1 year of college: 150
- Some college more than 1 year, no degree: 261
- Associate degree: 95
- Bachelor's degree: 854
- Master's degree: 460
- Professional school degree: 121
- Doctorate degree: 36

Education attainment for females 25 years and older:
- No schooling: 13
- Nursery to 4th grade: 0
- 5th and 6th grade: 0
- 7th and 8th grade: 0
- 9th grade: 0
- 10th grade: 0
- 11th grade: 0
- 12th grade, no diploma: 9
- High school graduate (or equivalency): 348
- Less than 1 year of college: 144
- Some college more than 1 year, no degree: 415
- Associate degree: 293
- Bachelor's degree: 960
- Master's degree: 546
- Professional school degree: 85
- Doctorate degree: 17


Housing units in structures:
- One, detached: 2,891
- One, attached: 426
- Two: 24
- 3 or 4: 17
- 5 to 9: 36
- 10 to 19: 19
- 20 to 49: 20
- 50 or more: 90
Housing units lacking complete kitchen facilities in 2022: 1.0%
House/condo owner moved in on average 11 years ago
Renter moved in on average 3 years ago

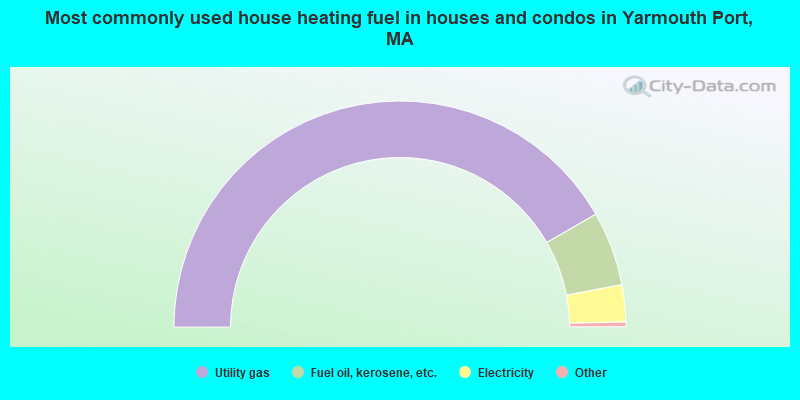
- 83.4%Utility gas
- 10.6%Fuel oil, kerosene, etc.
- 5.3%Electricity
- 0.4%No fuel used
- 0.3%Other fuel
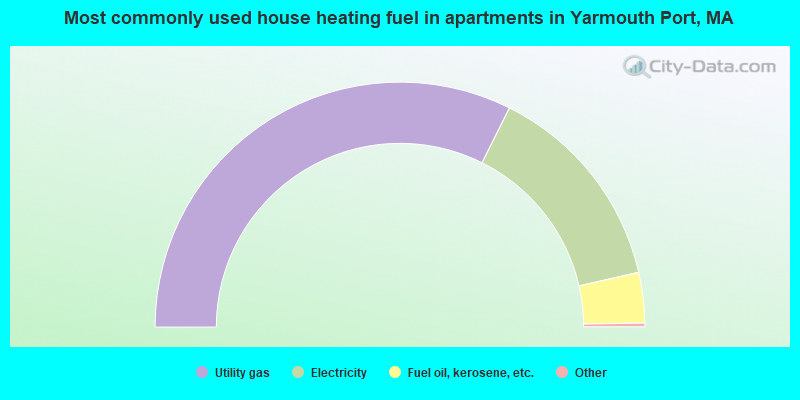
- 65.1%Utility gas
- 28.2%Electricity
- 6.7%Fuel oil, kerosene, etc.
Private vs. public school enrollment:
| Here: | 26.2% |
| Massachusetts: | 10.3% |
| Here: | 4.0% |
| Massachusetts: | 12.3% |
| Here: | 19.5% |
| Massachusetts: | 51.2% |


