Wyanet, IL (Illinois) Houses and Residents
| Wyanet: | $98,493 |
| Illinois: | $251,600 |
Mean price in 2022:
Detached houses: $103,820
Here: $103,820 State: $310,164
Total population: 963 (Urban population: 0, Rural population: 1,040 (1 farm, 1,039 nonfarm))
Houses: 469 (424 occupied: 339 owner occupied, 90 renter occupied)
| % of renters here: | 21% |
| State: | 33% |
Housing density: 469 houses/condos per square mile
Median price asked for vacant for-sale houses and condos in 2022: $785,489.
Median contract rent in 2022: $595 (lower quartile is $516, upper quartile is $637)
Median rent asked for vacant for-rent units in 2022: $409
Median gross rent in Wyanet, IL in 2022: $801
Housing units in Wyanet with a mortgage: 212 (11 second mortgage, 0 home equity loan, 12 both second mortgage and home equity loan)
Houses without a mortgage: 9
Median household income for houses/condos with a mortgage: $54,492
Median household income for apartments without a mortgage: $74,396
Median monthly housing costs: $835
Compare current foreclosures near Wyanet, IL:
| Photo | Address | Area | Beds / Baths | Price | Details |
|---|---|---|---|---|---|

|
#1
E Main St
Wyanet, IL 61379
|
- sq. feet
|
- baths - beds |
show details | |

|
#2
S King St
Wyanet, IL 61379
|
- sq. feet
|
- baths - beds |
show details | |

|
#3
S King St
Wyanet, IL 61379
|
- sq. feet
|
- baths - beds |
show details | |

|
#4
E Marion St
Princeton, IL 61356
|
1,268 sq. feet
|
1 baths 2 beds |
show details | |

|
#5
2150 East St
Tiskilwa, IL 61368
|
1,630 sq. feet
|
2 baths 3 beds |
show details | |

|
#6
Lincoln St
Seatonville, IL 61359
|
2,308 sq. feet
|
3 baths 4 beds |
show details | |

|
#7
N 6th St
Neponset, IL 61345
|
1,240 sq. feet
|
1 baths 3 beds |
show details | |

|
#8
W Clark St
Princeton, IL 61356
|
- sq. feet
|
- baths - beds |
show details | |

|
#9
N Park Ave
Dover, IL 61323
|
- sq. feet
|
- baths - beds |
show details | |

|
#10
E 4th St
Depue, IL 61322
|
- sq. feet
|
- baths - beds |
show details |
| Photo | Address | Area | Beds / Baths | Price | Details |
|---|---|---|---|---|---|

|
#11
E 4th St
Depue, IL 61322
|
- sq. feet
|
- baths - beds |
show details | |

|
#12
2900 North Ave
Walnut, IL 61376
|
- sq. feet
|
- baths - beds |
show details | |

|
#13
E High St
Hennepin, IL 61327
|
- sq. feet
|
- baths - beds |
show details | |

|
#14
N 4th St
Neponset, IL 61345
|
- sq. feet
|
- baths - beds |
show details | |

|
#15
N Mercer St
Princeton, IL 61356
|
- sq. feet
|
- baths - beds |
show details | |

|
#16
300 East St
Sheffield, IL 61361
|
- sq. feet
|
- baths - beds |
show details | |

|
#17
1/2 W Marquette St
Princeton, IL 61356
|
- sq. feet
|
- baths - beds |
show details | |

|
#18
N Chestnut St
Princeton, IL 61356
|
- sq. feet
|
- baths - beds |
show details | |

|
#19
N Main St
Manlius, IL 61338
|
- sq. feet
|
- baths - beds |
show details | |

|
#20
1500 North Ave
Princeton, IL 61356
|
- sq. feet
|
- baths - beds |
show details |
| Photo | Address | Area | Beds / Baths | Price | Details |
|---|---|---|---|---|---|

|
#21
Wyanet Walnut Rd
Princeton, IL 61356
|
- sq. feet
|
- baths - beds |
show details | |

|
#22
S Mason St
Sheffield, IL 61361
|
- sq. feet
|
- baths - beds |
show details | |

|
#23
W Central Ave
Princeton, IL 61356
|
- sq. feet
|
- baths - beds |
show details | |

|
#24
Pombrook Dr
Princeton, IL 61356
|
- sq. feet
|
- baths - beds |
show details | |

|
#25
Malibu Dr
Putnam, IL 61560
|
- sq. feet
|
- baths - beds |
show details | |

|
#26
Depot St
Walnut, IL 61376
|
- sq. feet
|
- baths - beds |
show details | |

|
#27
N Chestnut St
Princeton, IL 61356
|
- sq. feet
|
- baths - beds |
show details | |

|
#28
E Mulberry St
Hennepin, IL 61327
|
- sq. feet
|
- baths - beds |
show details | |

|
#29
E Mulberry St
Hennepin, IL 61327
|
- sq. feet
|
- baths - beds |
show details | |

|
#30
S Church St
Princeton, IL 61356
|
- sq. feet
|
- baths - beds |
show details |
| Photo | Address | Area | Beds / Baths | Price | Details |
|---|---|---|---|---|---|

|
#31
E High St
Hennepin, IL 61327
|
- sq. feet
|
- baths - beds |
show details | |

|
Check over 1 million property listings on Foreclosure.com!
|
browse all offers | |||

Latest news about housing in Wyanet, IL collected exclusively by city-data.com from local newspapers, TV, and radio stations


Median year apartment built: 1967
Household type by relationship:
Households: 1,020- Male householders: 196 (38 living alone), Female householders: 220 (87 living alone)
158 spouses (158 opposite-sex spouses), 94 unmarried partners, (94 opposite-sex unmarried partners), 281 children (269 natural, 0 adopted, 11 stepchildren), 12 grandchildren, 7 brothers or sisters, 7 parents, 0 foster children, 2 other relatives, 37 non-relatives
Size of family households: 96 2-persons, 46 3-persons, 48 4-persons, 27 5-persons, 5 6-persons, 11 7-or-more-persons.
Size of nonfamily households: 132 1-person, 53 2-persons, 8 3-persons, 3 5-persons.
131 married couples with children.
98 single-parent households (46 men, 52 women).
97.3% of residents of Wyanet speak English at home.
0.5% of residents speak Spanish at home (100% speak English very well).
0.6% of residents speak other Indo-European language at home (83% speak English very well, 17% speak English not well).
0.4% of residents speak Asian or Pacific Island language at home (100% speak English very well).
0.1% of residents speak other language at home (100% speak English well).
Foreign born population: 4 (0.4%)
(0.0% of them are naturalized citizens)
| Here: | 6.6 |
| State: | 6.4 |
| Here: | 5.0 |
| State: | 4.1 |

- Bedrooms in owner-occupied houses and condos in Wyanet, Illinois
- 2no bedroom
- 111 bedroom
- 892 bedrooms
- 1793 bedrooms
- 384 bedrooms
- 215+ bedrooms

- Bedrooms in renter-occupied apartments in Wyanet, Illinois
- 0no bedroom
- 311 bedroom
- 172 bedrooms
- 313 bedrooms
- 124 bedrooms
- 05+ bedrooms

- Cars and other vehicles available in Wyanet in owner-occupied houses/condos
- 47no vehicle
- 911 vehicle
- 1412 vehicles
- 423 vehicles
- 174 vehicles
- 25+ vehicles

- Cars and other vehicles available in Wyanet in renter-occupied apartments
- 21no vehicle
- 261 vehicle
- 402 vehicles
- 03 vehicles
- 04 vehicles
- 35+ vehicles

- Rooms in owner-occupied houses in Wyanet, Illinois
- 21 room
- 02 rooms
- 23 rooms
- 384 rooms
- 665 rooms
- 546 rooms
- 987 rooms
- 258 rooms
- 559+ rooms

- Rooms in renter-occupied apartments in Wyanet, Illinois
- 01 room
- 62 rooms
- 223 rooms
- 114 rooms
- 95 rooms
- 236 rooms
- 127 rooms
- 08 rooms
- 69+ rooms


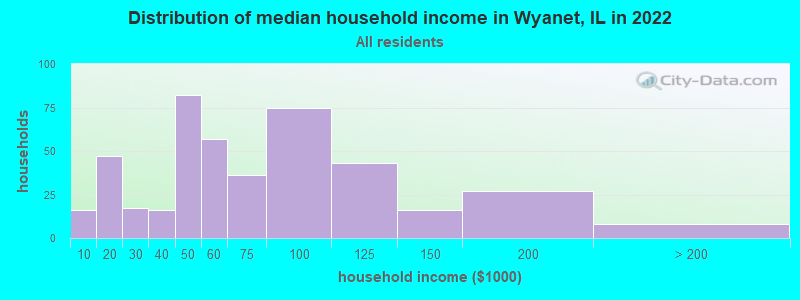
Wyanet, IL household income distribution

- 16Less than $10,000
- 47$10,000 to $19,999
- 17$20,000 to $29,999
- 16$30,000 to $39,999
- 82$40,000 to $49,999
- 57$50,000 to $59,999
- 36$60,000 to $74,999
- 75$75,000 to $99,999
- 43$100,000 to $124,999
- 16$125,000 to $149,999
- 27$150,000 to $199,999
- 8$200,000 or more
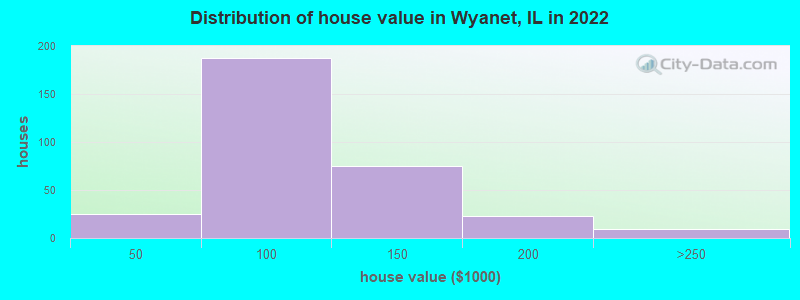
Home value of owner - occupied houses in 2022 in Wyanet, IL
-
- 2Less than $10,000
- 3$10,000 to $14,999
- 7$20,000 to $24,999
- 1$30,000 to $34,999
- 3$35,000 to $39,999
- 6$40,000 to $49,999
- 9$50,000 to $59,999
- 21$60,000 to $69,999
- 9$70,000 to $79,999
- 75$80,000 to $89,999
- 64$90,000 to $99,999
- 45$100,000 to $124,999
- 29$125,000 to $149,999
- 13$150,000 to $174,999
- 8$175,000 to $199,999
- 5$200,000 to $249,999
- 3$500,000 to $749,999
Rent paid by renters in 2022 in Wyanet, IL
-
- 7$200 to $249
- 3$450 to $499
- 33$500 to $549
- 4$550 to $599
- 35$600 to $649
- 3$650 to $699
- 5$700 to $749
- 3$800 to $899
- 2$900 to $999


Percentage of workers working in this county: 80.1%
Number of people working at home: 20 (3.8% of all workers)
Travel time to work (commute)
- Less than 5 minutes: 18
- 5 to 9 minutes: 49
- 10 to 14 minutes: 70
- 15 to 19 minutes: 140
- 20 to 24 minutes: 31
- 25 to 29 minutes: 64
- 30 to 34 minutes: 45
- 35 to 39 minutes: 27
- 40 to 44 minutes: 6
- 45 to 59 minutes: 16
- 60 to 89 minutes: 12
- 90 or more minutes: 10
Means of transportation to work:
- Drove a car alone: 446 (85.3%)
- Carpooled: 49 (9.4%)
- Walked: 7 (1.3%)
- Other means: 7 (1.3%)
- Worked at home: 14 (2.7%)

- Unemployment by race in 2022
- Unemployment rate for White non-Hispanic residents
- 5.8%Males
- 4.9%Females

- Year of entry for the foreign-born population in Wyanet, Illinois
- 02010 or later
- 42000 to 2009
- 01990 to 1999
- 41980 to 1989
- 01970 to 1979
- 0Before 1970

First ancestries reported:
- German: 112 (33.0%)
- English: 55 (16.2%)
- American: 45 (13.3%)
- Irish: 20 (5.9%)
- European: 13 (3.8%)
- Swedish: 8 (2.4%)
- Polish: 6 (1.8%)
- Belgian: 4 (1.2%)
- Italian: 3 (0.9%)
- Eastern European: 2 (0.6%)
- Greek: 2 (0.6%)
- French: 1 (0.3%)
- Norwegian: 1 (0.3%)
Most common places of birth for foreign-born residents (%):
| Wyanet: | 75.0% (3) |
| Illinois: | 5.2% (93,003) |
Place of birth for U.S.-born residents:
- This state: 899
- Other state: 112
- Northeast: 49
- Midwest: 39
- South: 20
- West: 4
90.0% of Wyanet residents lived in the same house 1 years ago.
Out of people who lived in different houses, 39.4% lived in this county.
Out of people who lived in different counties, 77.4% lived in Illinois.
| Wyanet: | 90.0% |
| State average: | 88.3% |
Education attainment for males 25 years and older:
- No schooling: 0
- Nursery to 4th grade: 0
- 5th and 6th grade: 0
- 7th and 8th grade: 12
- 9th grade: 1
- 10th grade: 2
- 11th grade: 1
- 12th grade, no diploma: 23
- High school graduate (or equivalency): 157
- Less than 1 year of college: 46
- Some college more than 1 year, no degree: 36
- Associate degree: 23
- Bachelor's degree: 29
- Master's degree: 2
- Professional school degree: 0
- Doctorate degree: 0

Education attainment for females 25 years and older:
- No schooling: 0
- Nursery to 4th grade: 0
- 5th and 6th grade: 0
- 7th and 8th grade: 1
- 9th grade: 9
- 10th grade: 1
- 11th grade: 5
- 12th grade, no diploma: 1
- High school graduate (or equivalency): 167
- Less than 1 year of college: 57
- Some college more than 1 year, no degree: 43
- Associate degree: 42
- Bachelor's degree: 25
- Master's degree: 8
- Professional school degree: 0
- Doctorate degree: 0


Housing units in structures:
- One, detached: 426
- One, attached: 6
- 5 to 9: 30
- Mobile homes: 6
House/condo owner moved in on average 14 years ago
Renter moved in on average 5 years ago

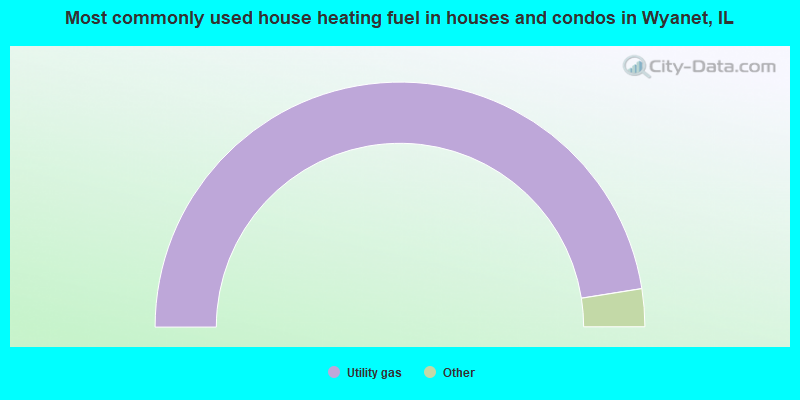
- 95.2%Utility gas
- 3.9%Electricity
- 0.9%Bottled, tank, or LP gas
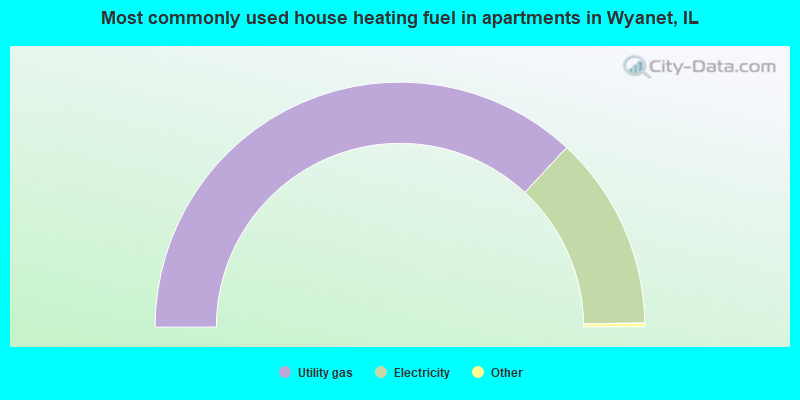
- 74.2%Utility gas
- 25.8%Electricity
Private vs. public school enrollment:
| Here: | 0.6% |
| Illinois: | 13.3% |
| Here: | 0.0% |
| Illinois: | 9.9% |
| Here: | 26.7% |
| Illinois: | 27.4% |


