Woodstock, CT (Connecticut) Houses and Residents
| Woodstock: | $309,799 |
| Connecticut: | $347,200 |
Total population: 7,964 (Urban population: 481, Rural population: 6,740 (64 farm, 6,676 nonfarm))
Houses: 3,044 (2,754 occupied: 2,292 owner occupied, 462 renter occupied)
| % of renters here: | 17% |
| State: | 34% |
Housing density: 50 houses/condos per square mile
Median price asked for vacant for-sale houses and condos in 2022 in this county: $282,397.
Median contract rent in 2022: $1,083 (lower quartile is $957, upper quartile is $1,364)
Median rent asked for vacant for-rent units in 2022: $1,000
Median gross rent in Woodstock, CT in 2022: $1,294
Housing units in Woodstock with a mortgage: 1,325 (106 second mortgage, 109 home equity loan, 0 both second mortgage and home equity loan)
Houses without a mortgage: 480
Compare current foreclosures near Woodstock, CT:
| Photo | Address | Area | Beds / Baths | Price | Details |
|---|---|---|---|---|---|

|
#1
Paine District Rd
Woodstock, CT 06281
|
1,092 sq. feet
|
1 baths 2 beds |
show details | |

|
#2
Rocky Hill Rd
Woodstock, CT 06281
|
1,682 sq. feet
|
1 baths 3 beds |
show details | |

|
#3
Pine Crest Rdg
Woodstock, CT 06281
|
926 sq. feet
|
1 baths 2 beds |
show details | |

|
#4
Route 169 # 169
Woodstock, CT 06281
|
1,280 sq. feet
|
1 baths 4 beds |
show details | |

|
#5
Rawson Rd
Woodstock, CT 06281
|
2,556 sq. feet
|
2 baths 3 beds |
show details | |

|
#6
Clarence Dr
Oxford, MA 01540
|
3,010 sq. feet
|
3 baths 5 beds |
$569,900
|
show details |

|
#7
Round Lake Dr
Pascoag, RI 02859
|
976 sq. feet
|
2 baths 2 beds |
$179,900
|
show details |

|
#8
Tolland Ave
Stafford Springs, CT 06076
|
896 sq. feet
|
1 baths 3 beds |
$100,000
|
show details |

|
#9
Lennys Ln
Hampton, CT 06247
|
- sq. feet
|
2 baths 4 beds |
show details | |

|
#10
Willimantic Rd
Chaplin, CT 06235
|
2,332 sq. feet
|
3 baths 5 beds |
show details |
| Photo | Address | Area | Beds / Baths | Price | Details |
|---|---|---|---|---|---|

|
#11
Roberts Park Rd
Holland, MA 01521
|
660 sq. feet
|
1 baths 3 beds |
show details | |

|
#12
N Main St
Pascoag, RI 02859
|
- sq. feet
|
- baths - beds |
$100,000
|
show details |

|
#13
Wales Rd
Brimfield, MA 01010
|
2,312 sq. feet
|
2 baths 3 beds |
show details | |

|
#14
Dennis Ln
Stafford Springs, CT 06076
|
1,171 sq. feet
|
2 baths 3 beds |
show details | |

|
#15
Brookfield Rd
Brimfield, MA 01010
|
1,482 sq. feet
|
3 baths 3 beds |
show details | |

|
#16
Squaw Rock Rd
Moosup, CT 06354
|
1,732 sq. feet
|
2 baths 3 beds |
show details | |

|
#17
1/2 Putnam Hill Road
Sutton, MA 01590
|
1,415 sq. feet
|
1 baths 3 beds |
show details | |

|
#18
Pine St
Dudley, MA 01571
|
1,414 sq. feet
|
2 baths 4 beds |
show details | |

|
#19
Colleen St
Danielson, CT 06239
|
1,714 sq. feet
|
2 baths 3 beds |
show details | |

|
#20
Old Farms Rd
Willington, CT 06279
|
887 sq. feet
|
1 baths 2 beds |
show details |
| Photo | Address | Area | Beds / Baths | Price | Details |
|---|---|---|---|---|---|

|
#21
Stafford St
Stafford Springs, CT 06076
|
1,351 sq. feet
|
2 baths 3 beds |
show details | |

|
#22
Main St
Oxford, MA 01540
|
1,423 sq. feet
|
1 baths 4 beds |
show details | |

|
#23
Cedar St
Fiskdale, MA 01518
|
3,640 sq. feet
|
2 baths 4 beds |
show details | |

|
#24
Lakeview Dr
Charlton, MA 01507
|
1,235 sq. feet
|
1 baths 2 beds |
show details | |

|
#25
Main St # 1
Oxford, MA 01540
|
1,199 sq. feet
|
2 baths 3 beds |
show details | |

|
#26
Clearview Dr
Stafford Springs, CT 06076
|
1,576 sq. feet
|
2 baths 3 beds |
show details | |

|
#27
Lake Washington Dr
Chepachet, RI 02814
|
960 sq. feet
|
1 baths 3 beds |
show details | |

|
#28
Lincoln Rd
Danielson, CT 06239
|
1,468 sq. feet
|
2 baths 3 beds |
show details | |

|
#29
Park Rd
Charlton, MA 01507
|
640 sq. feet
|
1 baths 2 beds |
show details | |

|
#30
Lovett Rd
Oxford, MA 01540
|
1,696 sq. feet
|
2 baths 3 beds |
show details |
| Photo | Address | Area | Beds / Baths | Price | Details |
|---|---|---|---|---|---|

|
#31
New Boston Rd
Sturbridge, MA 01566
|
1,667 sq. feet
|
2 baths 4 beds |
show details | |

|
#32
Sutton Ave
Oxford, MA 01540
|
2,312 sq. feet
|
2 baths 5 beds |
show details | |

|
#33
Buffum Rd
Charlton, MA 01507
|
2,578 sq. feet
|
3 baths 4 beds |
show details | |

|
#34
Muggett Hill Rd
Charlton, MA 01507
|
2,728 sq. feet
|
2 baths 3 beds |
show details | |

|
#35
May St
Oxford, MA 01540
|
885 sq. feet
|
1 baths 2 beds |
show details | |

|
#36
Seckar Rd
Willington, CT 06279
|
1,992 sq. feet
|
2 baths 4 beds |
show details | |

|
#37
Old Village Rd
Sturbridge, MA 01566
|
3,364 sq. feet
|
4 baths 5 beds |
show details | |

|
#38
Lauren Ln
Fiskdale, MA 01518
|
1,928 sq. feet
|
2 baths 3 beds |
show details | |

|
#39
Southbridge Rd Unit 104
Charlton, MA 01507
|
1,266 sq. feet
|
2 baths 2 beds |
show details | |

|
#40
Old Dudley Rd
Oxford, MA 01540
|
1,739 sq. feet
|
1 baths 2 beds |
show details |
| Photo | Address | Area | Beds / Baths | Price | Details |
|---|---|---|---|---|---|

|
#41
Highland Ln
Fiskdale, MA 01518
|
2,185 sq. feet
|
3 baths 4 beds |
show details | |

|
#42
Costello Rd
Brooklyn, CT 06234
|
2,010 sq. feet
|
2 baths 3 beds |
show details | |

|
#43
Old Village Rd
Sturbridge, MA 01566
|
1,353 sq. feet
|
2 baths 4 beds |
show details | |

|
#44
Francis St
Danielson, CT 06239
|
1,260 sq. feet
|
1 baths 3 beds |
show details | |

|
#45
Main St
Oxford, MA 01540
|
3,244 sq. feet
|
2 baths 7 beds |
show details | |

|
#46
Dudley Rd
Oxford, MA 01540
|
1,050 sq. feet
|
1 baths 2 beds |
show details | |

|
#47
Charlton St
Oxford, MA 01540
|
1,804 sq. feet
|
1 baths 3 beds |
show details | |

|
#48
Calvin Burnham Rd
Hampton, CT 06247
|
1,156 sq. feet
|
2 baths 2 beds |
show details | |

|
#49
New Boston Rd
Sturbridge, MA 01566
|
2,608 sq. feet
|
2 baths 4 beds |
show details | |

|
Check over 1 million property listings on Foreclosure.com!
|
browse all offers | |||
Latest news about housing in Woodstock, CT collected exclusively by city-data.com from local newspapers, TV, and radio stations

 | Current Real estate markets (3987 replies) |
| 2024 Connecticut Town Tournament VI (Celebrating the 10-Year Anniversary & Dazzleman's Memorial) (1007 replies) |
| Motivated and pre-approved buyer looking to buy a home in Windham County! (1 reply) |
| Connecticut TOWN TOURNAMENT V (2022) (831 replies) |
| Desegregate Connecticut---Raised CT Zoning Bill (2519 replies) |
| Lakefront home near Plainfield (17 replies) |

Household type by relationship:
Households: 113,657- In family households: 94,705 (20,200 male householders, 10,143 female householders)
22,420 spouses, 32,772 children (30,142 natural, 792 adopted, 1,838 stepchildren), 1,953 grandchildren, 839 brothers or sisters, 1,026 parents, foster children, 1,121 other relatives, 3,518 non-relatives
- In nonfamily households: 18,952 (7,012 male householders (5,014 living alone)), 7,455 female householders (6,006 living alone)), 4,485 nonrelatives
- In group quarters: 4,771 (1,565 institutionalized population)
18,008 married couples with children.
7,061 single-parent households (1,662 men, 5,399 women).
94.7% of residents of Woodstock speak English at home.
1.3% of residents speak Spanish at home (100% speak English very well).
3.9% of residents speak other Indo-European language at home (71% speak English very well, 17% speak English well, 12% speak English not well).
0.2% of residents speak Asian or Pacific Island language at home (100% speak English very well).
Foreign born population: 340 (3.9%)
(80.6% of them are naturalized citizens)
| Here: | 7.1 |
| State: | 6.5 |
| Here: | 4.7 |
| State: | 4.0 |

- Bedrooms in owner-occupied houses and condos in Woodstock, Connecticut
- 10no bedroom
- 771 bedroom
- 5872 bedrooms
- 1,1003 bedrooms
- 4104 bedrooms
- 1085+ bedrooms

- Bedrooms in renter-occupied apartments in Woodstock, Connecticut
- 0no bedroom
- 631 bedroom
- 2152 bedrooms
- 1593 bedrooms
- 184 bedrooms
- 75+ bedrooms

- Cars and other vehicles available in Woodstock in owner-occupied houses/condos
- 18no vehicle
- 6681 vehicle
- 1,1422 vehicles
- 3063 vehicles
- 1154 vehicles
- 435+ vehicles

- Cars and other vehicles available in Woodstock in renter-occupied apartments
- 44no vehicle
- 1811 vehicle
- 2102 vehicles
- 273 vehicles
- 04 vehicles
- 05+ vehicles

- Rooms in owner-occupied houses in Woodstock, Connecticut
- 01 room
- 102 rooms
- 673 rooms
- 2374 rooms
- 4295 rooms
- 5586 rooms
- 5147 rooms
- 2048 rooms
- 2739+ rooms

- Rooms in renter-occupied apartments in Woodstock, Connecticut
- 01 room
- 232 rooms
- 333 rooms
- 1634 rooms
- 975 rooms
- 756 rooms
- 537 rooms
- 08 rooms
- 189+ rooms


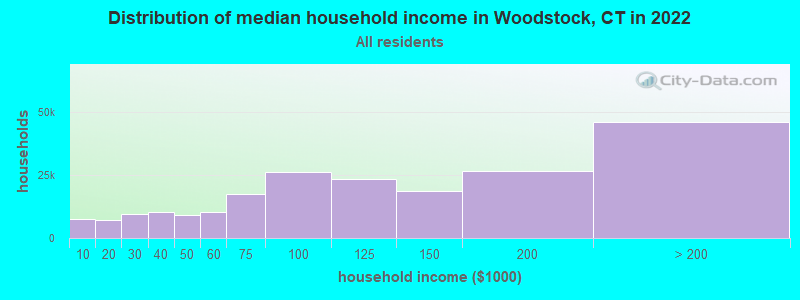
Woodstock, CT household income distribution

- 8,755Less than $10,000
- 8,729$10,000 to $19,999
- 11,150$20,000 to $29,999
- 11,808$30,000 to $39,999
- 10,643$40,000 to $49,999
- 11,544$50,000 to $59,999
- 19,280$60,000 to $74,999
- 28,794$75,000 to $99,999
- 25,264$100,000 to $124,999
- 20,292$125,000 to $149,999
- 28,652$150,000 to $199,999
- 49,010$200,000 or more
Percentage of workers working in this county: 66.6%
Number of people working at home: 814 (18.6% of all workers)
Travel time to work (commute)
- Less than 5 minutes: 172
- 5 to 9 minutes: 309
- 10 to 14 minutes: 315
- 15 to 19 minutes: 536
- 20 to 24 minutes: 485
- 25 to 29 minutes: 259
- 30 to 34 minutes: 451
- 35 to 39 minutes: 79
- 40 to 44 minutes: 124
- 45 to 59 minutes: 445
- 60 to 89 minutes: 301
- 90 or more minutes: 119
Means of transportation to work:
- Drove a car alone: 2,963 (78.9%)
- Carpooled: 514 (13.7%)
- Railroad: 10 (0.3%)
- Walked: 103 (2.7%)
- Other means: 5 (0.1%)
- Worked at home: 161 (4.3%)


- Year of entry for the foreign-born population in Woodstock, Connecticut
- 111995 to March 2000
- 201990 to 1994
- 71985 to 1989
- 01980 to 1984
- 471975 to 1979
- 01970 to 1974
- 181965 to 1969
- 103Before 1965

First ancestries reported:
- French: 1,307 (14.7%)
- Irish: 1,268 (14.2%)
- English: 1,124 (12.6%)
- German: 755 (8.5%)
- Polish: 754 (8.5%)
- French Canadian: 677 (7.6%)
- Other: 617 (6.9%)
- Italian: 614 (6.9%)
- Swedish: 369 (4.1%)
- Scottish: 265 (3.0%)
- United States: 257 (2.9%)
- Scotch-Irish: 116 (1.3%)
- Russian: 96 (1.1%)
- Hungarian: 85 (1.0%)
- Greek: 76 (0.9%)
- Ukrainian: 76 (0.9%)
- Czech: 70 (0.8%)
- Lithuanian: 60 (0.7%)
- Dutch: 56 (0.6%)
- Norwegian: 51 (0.6%)
- Portuguese: 51 (0.6%)
- Slovak: 45 (0.5%)
- Welsh: 42 (0.5%)
- Danish: 37 (0.4%)
- Swiss: 27 (0.3%)
- Subsaharan African: 8 (0.09%)
Most common places of birth for foreign-born residents (%):
| Woodstock: | 18.4% (38) |
| Connecticut: | 2.1% (7,596) |
| Woodstock: | 15.5% (32) |
| Connecticut: | 5.2% (19,083) |
| Woodstock: | 12.1% (25) |
| Connecticut: | 3.1% (11,432) |
| Woodstock: | 9.7% (20) |
| Connecticut: | 0.5% (1,894) |
| Woodstock: | 8.3% (17) |
| Connecticut: | 1.2% (4,622) |
| Woodstock: | 7.8% (16) |
| Connecticut: | 1.5% (5,508) |
| Woodstock: | 6.8% (14) |
| Connecticut: | 0.4% (1,513) |
| Woodstock: | 5.3% (11) |
| Connecticut: | 4.4% (16,395) |
| Woodstock: | 5.3% (11) |
| Connecticut: | 0.1% (291) |
| Woodstock: | 4.4% (9) |
| Connecticut: | 0.6% (2,313) |
| Woodstock: | 3.4% (7) |
| Connecticut: | 0.9% (3,317) |
| Woodstock: | 2.9% (6) |
| Connecticut: | 7.0% (26,023) |
Place of birth for U.S.-born residents:
- This state: 3,698
- Other state: 3,253
- Northeast: 2,740
- Midwest: 155
- South: 252
- West: 106
61% of Woodstock residents lived in the same house 5 years ago.
Out of people who lived in different houses, 55% lived in this county.
Out of people who lived in different counties, 27% lived in Connecticut.
Education attainment for males 25 years and older:
- No schooling: 0
- Nursery to 4th grade: 0
- 5th and 6th grade: 9
- 7th and 8th grade: 52
- 9th grade: 56
- 10th grade: 23
- 11th grade: 43
- 12th grade, no diploma: 10
- High school graduate (or equivalency): 669
- Less than 1 year of college: 196
- Some college more than 1 year, no degree: 337
- Associate degree: 186
- Bachelor's degree: 436
- Master's degree: 228
- Professional school degree: 49
- Doctorate degree: 80

Education attainment for females 25 years and older:
- No schooling: 0
- Nursery to 4th grade: 0
- 5th and 6th grade: 8
- 7th and 8th grade: 67
- 9th grade: 33
- 10th grade: 62
- 11th grade: 23
- 12th grade, no diploma: 22
- High school graduate (or equivalency): 805
- Less than 1 year of college: 172
- Some college more than 1 year, no degree: 325
- Associate degree: 218
- Bachelor's degree: 456
- Master's degree: 265
- Professional school degree: 63
- Doctorate degree: 42


Housing units in structures:
- One, detached: 2,587
- One, attached: 155
- Two: 82
- 3 or 4: 81
- 5 to 9: 85
- 10 to 19: 24
- 20 to 49: 8
- Mobile homes: 22
Median worth of mobile homes: $15,619
Housing units lacking complete kitchen facilities: 0.8%

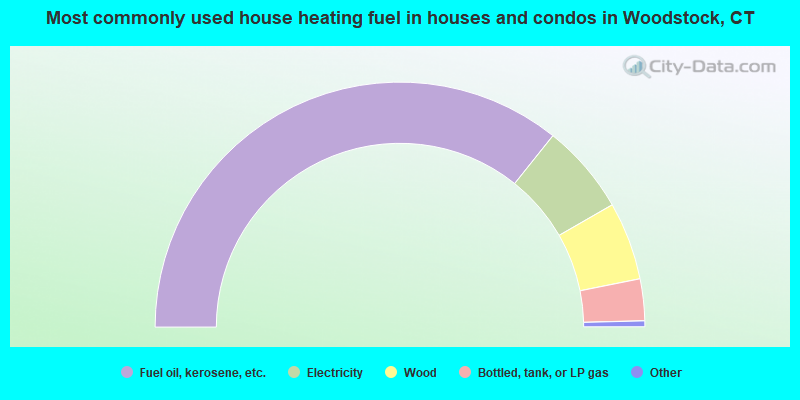
- 71.4%Fuel oil, kerosene, etc.
- 11.9%Electricity
- 10.3%Wood
- 5.5%Bottled, tank, or LP gas
- 0.4%Other fuel
- 0.3%Solar energy
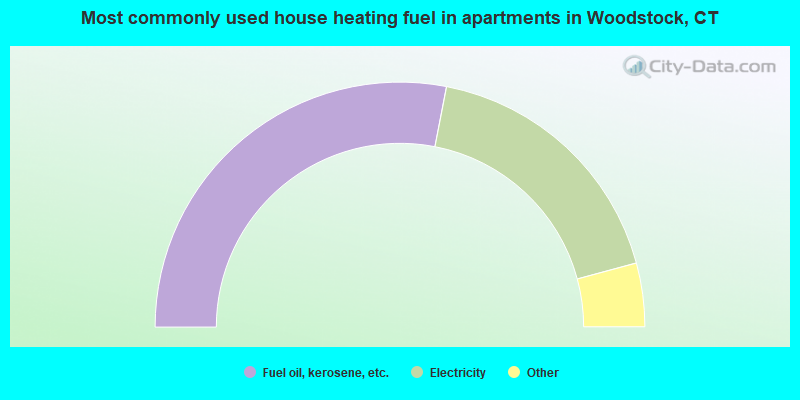
- 56.1%Fuel oil, kerosene, etc.
- 35.5%Electricity
- 3.0%Bottled, tank, or LP gas
- 3.0%Coal or coke
- 1.5%Wood
- 0.9%Other fuel
Private vs. public school enrollment:
| Here: | 9.2% |
| Connecticut: | 9.9% |
| Here: | 17.6% |
| Connecticut: | 11.0% |
| Here: | 29.6% |
| Connecticut: | 33.4% |


