Woodsboro, MD (Maryland) Houses and Residents
| Woodsboro: | $439,661 |
| Maryland: | $398,100 |
Mean price in 2022:
Detached houses: $402,716
Here: $402,716 State: $526,819 Townhouses or other attached units: $220,195
Here: $220,195 State: $328,305 In 5-or-more-unit structures: $174,436
Here: $174,436 State: $350,378
Total population: 1,193 (Urban population: 0, Rural population: 855 (24 farm, 831 nonfarm))
Houses: 432 (432 occupied: 346 owner occupied, 88 renter occupied)
| % of renters here: | 20% |
| State: | 32% |
Housing density: 629 houses/condos per square mile
Median price asked for vacant for-sale houses and condos in 2022 in this county: $402,870.
Median contract rent in 2022: $929 (lower quartile is $767, upper quartile is $1,398)
Median rent asked for vacant for-rent units in 2022: $829
Median gross rent in Woodsboro, MD in 2022: $972
Housing units in Woodsboro with a mortgage: 263 (67 second mortgage, 0 home equity loan, 29 both second mortgage and home equity loan)
Houses without a mortgage: 0
Median household income for houses/condos with a mortgage: $167,673
Median household income for apartments without a mortgage: $94,892
Median monthly housing costs: $1,810
Compare current foreclosures near Woodsboro, MD:
| Photo | Address | Area | Beds / Baths | Price | Details |
|---|---|---|---|---|---|

|
#1
S 3rd St
Woodsboro, MD 21798
|
- sq. feet
|
- baths - beds |
show details | |

|
#2
W Baltimore St
Taneytown, MD 21787
|
2,149 sq. feet
|
2 baths 3 beds |
$364,900
|
show details |

|
#3
Uniontown Rd
Westminster, MD 21158
|
1,404 sq. feet
|
2 baths 4 beds |
$234,900
|
show details |

|
#4
Bruceville Rd
Keymar, MD 21757
|
1,320 sq. feet
|
1 baths 3 beds |
$153,200
|
show details |

|
#5
Sprigg St S
Frederick, MD 21704
|
2,442 sq. feet
|
4 baths 3 beds |
show details | |

|
#6
W Broadway St
Union Bridge, MD 21791
|
- sq. feet
|
2 baths 4 beds |
$239,900
|
show details |

|
#7
Jasons Rdg
Smithsburg, MD 21783
|
1,280 sq. feet
|
1 baths - beds |
show details | |

|
#8
Anthony Ln
Fairfield, PA 17320
|
1,940 sq. feet
|
4 baths 4 beds |
show details | |

|
#9
Carriage Hill Dr
Frederick, MD 21704
|
1,868 sq. feet
|
3 baths 3 beds |
show details | |

|
#10
Harney Rd
Littlestown, PA 17340
|
1,976 sq. feet
|
2 baths 3 beds |
show details |
| Photo | Address | Area | Beds / Baths | Price | Details |
|---|---|---|---|---|---|

|
#11
Mosby Ct
Frederick, MD 21701
|
1,564 sq. feet
|
2 baths 3 beds |
show details | |

|
#12
Courier Ct
Taneytown, MD 21787
|
1,232 sq. feet
|
2 baths 3 beds |
show details | |

|
#13
Polaris Dr
Walkersville, MD 21793
|
2,858 sq. feet
|
4 baths 4 beds |
show details | |

|
#14
Topper Rd
Fairfield, PA 17320
|
1,252 sq. feet
|
2 baths 3 beds |
show details | |

|
#15
Jacobs Trl
Fairfield, PA 17320
|
1,200 sq. feet
|
2 baths 3 beds |
show details | |

|
#16
Connie Trl
Fairfield, PA 17320
|
2,044 sq. feet
|
2 baths 3 beds |
show details | |

|
#17
Wyndswept Way
Westminster, MD 21158
|
3,190 sq. feet
|
2 baths - beds |
show details | |

|
#18
Water St
Fairfield, PA 17320
|
1,404 sq. feet
|
2 baths 3 beds |
show details | |

|
#19
Toms Creek Trl
Fairfield, PA 17320
|
1,400 sq. feet
|
2 baths 3 beds |
show details | |

|
#20
Feeser Rd N
Taneytown, MD 21787
|
2,311 sq. feet
|
1 baths - beds |
show details |
| Photo | Address | Area | Beds / Baths | Price | Details |
|---|---|---|---|---|---|

|
#21
Anthony Ln
Fairfield, PA 17320
|
1,940 sq. feet
|
2 baths 3 beds |
show details | |

|
#22
Blue Gill Trl
Fairfield, PA 17320
|
1,152 sq. feet
|
1 baths 3 beds |
show details | |

|
#23
Primus Ct
Frederick, MD 21703
|
1,316 sq. feet
|
3 baths - beds |
show details | |

|
#24
Cool Crest Dr
Jefferson, MD 21755
|
1,288 sq. feet
|
1 baths - beds |
show details | |

|
#25
Bonnie Trl
Fairfield, PA 17320
|
1,752 sq. feet
|
2 baths 3 beds |
show details | |

|
#26
View Trl
Fairfield, PA 17320
|
1,628 sq. feet
|
2 baths 3 beds |
show details | |

|
#27
Stapleton Ter
Frederick, MD 21703
|
1,716 sq. feet
|
2 baths - beds |
show details | |

|
#28
Brushfield Cir
Frederick, MD 21704
|
3,192 sq. feet
|
2 baths - beds |
show details | |

|
#29
Belgrave Cir
Frederick, MD 21704
|
3,424 sq. feet
|
3 baths - beds |
show details | |

|
#30
Bowling Green Dr
Frederick, MD 21704
|
3,736 sq. feet
|
3 baths - beds |
show details |
| Photo | Address | Area | Beds / Baths | Price | Details |
|---|---|---|---|---|---|

|
#31
Mount Nevis Pass
Frederick, MD 21704
|
4,063 sq. feet
|
4 baths - beds |
show details | |

|
#32
Duncan Pl
Frederick, MD 21703
|
1,870 sq. feet
|
3 baths - beds |
show details | |

|
#33
Wesley Sq
Frederick, MD 21703
|
2,860 sq. feet
|
2 baths - beds |
show details | |

|
#34
Bachtell Cir
Smithsburg, MD 21783
|
2,196 sq. feet
|
2 baths - beds |
show details | |

|
#35
Brethren Church Rd
Myersville, MD 21773
|
2,214 sq. feet
|
3 baths - beds |
show details | |

|
#36
Waynesboro Pike
Emmitsburg, MD 21727
|
1,404 sq. feet
|
1 baths - beds |
show details | |

|
#37
Braveheart Dr
Frederick, MD 21704
|
2,911 sq. feet
|
3 baths - beds |
show details | |

|
#38
Carriage Hill Dr
Frederick, MD 21704
|
2,268 sq. feet
|
3 baths - beds |
show details | |

|
#39
Penrose St
Frederick, MD 21704
|
2,880 sq. feet
|
3 baths - beds |
show details | |

|
#40
Bill Moxley Rd
Mount Airy, MD 21771
|
1,102 sq. feet
|
1 baths - beds |
show details |
| Photo | Address | Area | Beds / Baths | Price | Details |
|---|---|---|---|---|---|

|
#41
Molesworth Dr
Mount Airy, MD 21771
|
1,950 sq. feet
|
1 baths - beds |
show details | |

|
#42
City View Ave
Westminster, MD 21157
|
672 sq. feet
|
1 baths - beds |
show details | |

|
#43
E Main St
Middletown, MD 21769
|
1,242 sq. feet
|
1 baths - beds |
show details | |

|
#44
Fields Ln
Mount Airy, MD 21771
|
2,124 sq. feet
|
2 baths - beds |
show details | |

|
#45
Bowersox Rd
New Windsor, MD 21776
|
1,196 sq. feet
|
1 baths - beds |
show details | |

|
#46
Bartholows Rd
Mount Airy, MD 21771
|
2,229 sq. feet
|
2 baths - beds |
show details | |

|
#47
Willard Horine Ct
Frederick, MD 21703
|
1,837 sq. feet
|
3 baths - beds |
show details | |

|
#48
Old Bartholows Rd
Mount Airy, MD 21771
|
1,560 sq. feet
|
2 baths - beds |
show details | |

|
#49
Butterfly Ln
Frederick, MD 21703
|
1,560 sq. feet
|
1 baths - beds |
show details | |

|
Check over 1 million property listings on Foreclosure.com!
|
browse all offers | |||

Latest news about housing in Woodsboro, MD collected exclusively by city-data.com from local newspapers, TV, and radio stations

 | What is Frederick, MD like? (126 replies) |
| What are the safest Suburbs around Frederick? (24 replies) |
| More questions about Frederick and environs (6 replies) |

Median year apartment built: 1974
Household type by relationship:
Households: 1,300- Male householders: 203 (40 living alone), Female householders: 230 (67 living alone)
267 spouses (265 opposite-sex spouses), 87 unmarried partners, (82 opposite-sex unmarried partners), 362 children (359 natural, 3 adopted, 0 stepchildren), 19 grandchildren, 0 brothers or sisters, 18 parents, 0 foster children, 14 other relatives, 95 non-relatives
Size of family households: 128 2-persons, 48 3-persons, 51 4-persons, 37 5-persons, 9 6-persons, 33 7-or-more-persons.
Size of nonfamily households: 102 1-person, 17 2-persons.
198 married couples with children.
42 single-parent households (38 men, 4 women).
91.5% of residents of Woodsboro speak English at home.
2.0% of residents speak Spanish at home (100% speak English very well).
4.6% of residents speak other Indo-European language at home (100% speak English very well).
0.8% of residents speak Asian or Pacific Island language at home (100% speak English very well).
Foreign born population: 241 (18.5%)
(66.8% of them are naturalized citizens)
| Here: | 8.3 |
| State: | 7.3 |
| Here: | 3.4 |
| State: | 4.2 |

- Bedrooms in owner-occupied houses and condos in Woodsboro, Maryland
- 3no bedroom
- 01 bedroom
- 442 bedrooms
- 1103 bedrooms
- 1444 bedrooms
- 455+ bedrooms

- Bedrooms in renter-occupied apartments in Woodsboro, Maryland
- 4no bedroom
- 491 bedroom
- 62 bedrooms
- 283 bedrooms
- 04 bedrooms
- 05+ bedrooms

- Cars and other vehicles available in Woodsboro in owner-occupied houses/condos
- 3no vehicle
- 401 vehicle
- 1532 vehicles
- 723 vehicles
- 594 vehicles
- 195+ vehicles

- Cars and other vehicles available in Woodsboro in renter-occupied apartments
- 0no vehicle
- 571 vehicle
- 32 vehicles
- 243 vehicles
- 44 vehicles
- 05+ vehicles

- Rooms in owner-occupied houses in Woodsboro, Maryland
- 31 room
- 02 rooms
- 03 rooms
- 134 rooms
- 195 rooms
- 556 rooms
- 347 rooms
- 638 rooms
- 1619+ rooms

- Rooms in renter-occupied apartments in Woodsboro, Maryland
- 41 room
- 02 rooms
- 453 rooms
- 44 rooms
- 115 rooms
- 206 rooms
- 07 rooms
- 08 rooms
- 49+ rooms


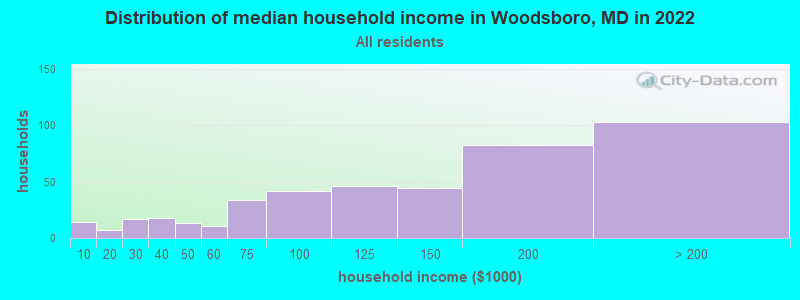
Woodsboro, MD household income distribution

- 14Less than $10,000
- 7$10,000 to $19,999
- 17$20,000 to $29,999
- 18$30,000 to $39,999
- 13$40,000 to $49,999
- 11$50,000 to $59,999
- 34$60,000 to $74,999
- 42$75,000 to $99,999
- 46$100,000 to $124,999
- 44$125,000 to $149,999
- 83$150,000 to $199,999
- 103$200,000 or more
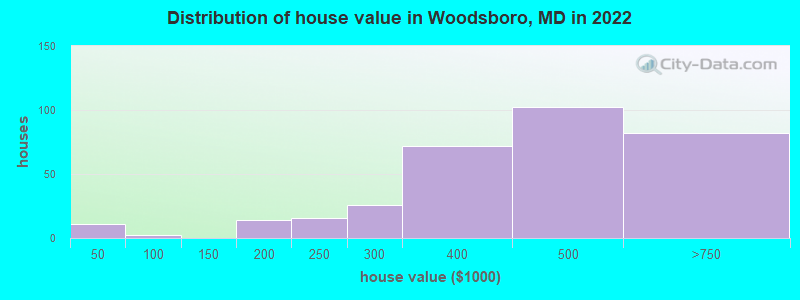
Home value of owner - occupied houses in 2022 in Woodsboro, MD
-
- 3$25,000 to $29,999
- 7$30,000 to $34,999
- 1$90,000 to $99,999
- 2$150,000 to $174,999
- 11$175,000 to $199,999
- 16$200,000 to $249,999
- 26$250,000 to $299,999
- 72$300,000 to $399,999
- 101$400,000 to $499,999
- 82$500,000 to $749,999
Rent paid by renters in 2022 in Woodsboro, MD
-
- 9$400 to $449
- 5$450 to $499
- 9$700 to $749
- 26$800 to $899
- 6$1,000 to $1,249
- 16$1,250 to $1,499
- 8$1,500 to $1,999


Percentage of workers working in this county: 78.8%
Number of people working at home: 79 (10.3% of all workers)
Travel time to work (commute)
- Less than 5 minutes: 24
- 5 to 9 minutes: 20
- 10 to 14 minutes: 24
- 15 to 19 minutes: 49
- 20 to 24 minutes: 61
- 25 to 29 minutes: 44
- 30 to 34 minutes: 248
- 35 to 39 minutes: 9
- 40 to 44 minutes: 22
- 45 to 59 minutes: 41
- 60 to 89 minutes: 98
- 90 or more minutes: 6
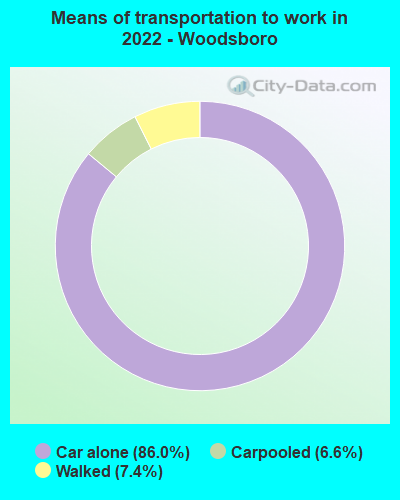
Means of transportation to work:
- Drove a car alone: 408 (70.7%)
- Carpooled: 34 (5.9%)
- Walked: 26 (4.5%)
- Worked at home: 79 (13.7%)

- Unemployment by race in 2022
- Unemployment rate for White non-Hispanic residents
- 1.2%Males
- 1.4%Females

- Year of entry for the foreign-born population in Woodsboro, Maryland
- 812010 or later
- 242000 to 2009
- 931990 to 1999
- 61980 to 1989
- 11970 to 1979
- 13Before 1970

First ancestries reported:
- American: 134 (19.6%)
- German: 91 (13.3%)
- English: 69 (10.1%)
- Irish: 54 (7.9%)
- Italian: 30 (4.4%)
- Polish: 18 (2.6%)
- Scottish: 17 (2.5%)
- European: 12 (1.8%)
- Austrian: 3 (0.4%)
- Celtic: 3 (0.4%)
- Dutch: 1 (0.1%)
- Pennsylvania German: 1 (0.1%)
Most common places of birth for foreign-born residents (%):
| Woodsboro: | 86.3% (182) |
| Maryland: | 2.5% (23,969) |
| Woodsboro: | 3.3% (7) |
| Maryland: | 0.9% (8,603) |
Place of birth for U.S.-born residents:
- This state: 765
- Other state: 291
- Northeast: 125
- Midwest: 37
- South: 111
- West: 12
86.0% of Woodsboro residents lived in the same house 1 years ago.
Out of people who lived in different houses, 37.3% lived in this county.
Out of people who lived in different counties, 21.8% lived in Maryland.
| Woodsboro: | 86.0% |
| State average: | 88.5% |
Education attainment for males 25 years and older:
- No schooling: 0
- Nursery to 4th grade: 0
- 5th and 6th grade: 3
- 7th and 8th grade: 0
- 9th grade: 3
- 10th grade: 10
- 11th grade: 0
- 12th grade, no diploma: 4
- High school graduate (or equivalency): 90
- Less than 1 year of college: 16
- Some college more than 1 year, no degree: 50
- Associate degree: 29
- Bachelor's degree: 89
- Master's degree: 95
- Professional school degree: 0
- Doctorate degree: 0

Education attainment for females 25 years and older:
- No schooling: 0
- Nursery to 4th grade: 0
- 5th and 6th grade: 0
- 7th and 8th grade: 1
- 9th grade: 0
- 10th grade: 2
- 11th grade: 13
- 12th grade, no diploma: 25
- High school graduate (or equivalency): 79
- Less than 1 year of college: 35
- Some college more than 1 year, no degree: 26
- Associate degree: 84
- Bachelor's degree: 86
- Master's degree: 98
- Professional school degree: 1
- Doctorate degree: 3


Housing units in structures:
- One, detached: 346
- One, attached: 27
- Two: 4
- 3 or 4: 3
- 5 to 9: 28
- 10 to 19: 19
- 20 to 49: 4
Housing units lacking complete kitchen facilities in 2022: 1.2%
House/condo owner moved in on average 14 years ago
Renter moved in on average 1 years ago

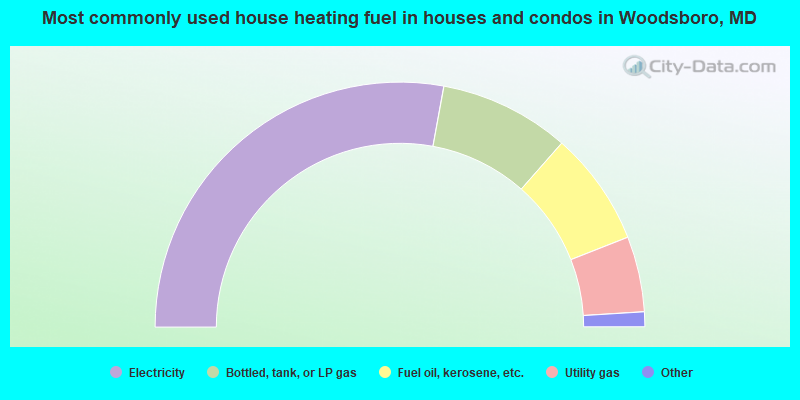
- 56.1%Electricity
- 17.3%Bottled, tank, or LP gas
- 15.2%Fuel oil, kerosene, etc.
- 10.0%Utility gas
- 0.9%No fuel used
- 0.6%Other fuel
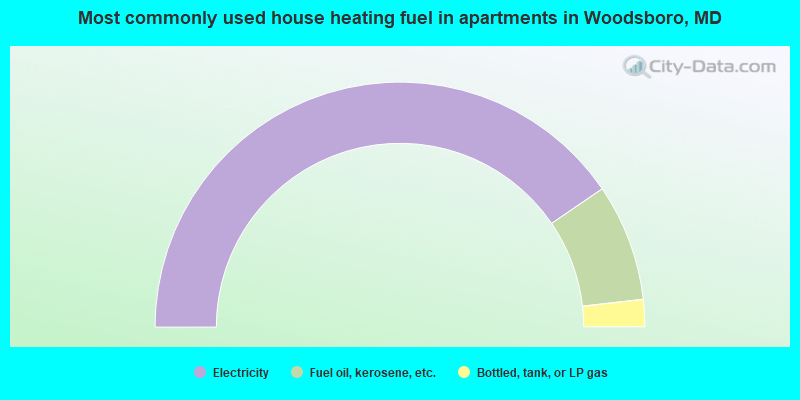
- 81.0%Electricity
- 15.5%Fuel oil, kerosene, etc.
- 3.6%Bottled, tank, or LP gas
Private vs. public school enrollment:
| Here: | 1.6% |
| Maryland: | 15.2% |
| Here: | 0.0% |
| Maryland: | 14.4% |
| Here: | 6.2% |
| Maryland: | 20.2% |


