Woodcrest, CA (California) Houses and Residents
Estimated median house or condo value in 2022: $763,450 (it was $225,600 in 2000 )
Woodcrest:
$763,450California:
$715,900
Lower value quartile - upper value quartile: $622,276 - $878,909Mean price in 2022: Detached houses: $619,317 Here:
$619,317State:
$988,808
Mobile homes: $124,289 Here:
$124,289State:
$184,506
Total population: 14,347 (Urban population: 8,339, Rural population: 0)
Houses: 5,058 (4,758 occupied: 4,327 owner occupied, 462 renter occupied )
% of renters here:
10%State:
44%
Housing density: 500 houses/condos per square mile
Median price asked for vacant for-sale houses and condos in 2022: $683,897.
Median contract rent in 2022: over $2,000 (lower quartile is $1,361, upper quartile is over $2,000)
Median rent asked for vacant for-rent units in 2022: $2,512
Median gross rent in Woodcrest, CA in 2022: over $2,000
Housing units in Woodcrest with a mortgage: 3,190 (269 second mortgage, 10 home equity loan, 275 both second mortgage and home equity loan )Houses without a mortgage: 50
Median household income for houses/condos with a mortgage: $144,557
Median household income for apartments without a mortgage: $109,944
Median monthly housing costs: $2,368
Data:
Median house or condo value ($)
Median house or condo value ($ change since 2000)
Median house or condo value ($) - White
Median house or condo value ($) - Black or African American
Median house or condo value ($) - Asian
Median house or condo value ($) - Hispanic or Latino
Median house or condo value ($) - American Indian and Alaska Native
Median house or condo value ($) - Multirace
Median house or condo value ($) - Other Race
Median price asked for mobile homes ($)
Household density (households per square mile)
Mean house or condo value by units in structure - 1, detached ($)
Mean house or condo value by units in structure - 1, attached ($)
Mean house or condo value by units in structure - 2 ($)
Mean house or condo value by units in structure by units in structure - 3 or 4 ($)
Mean house or condo value by units in structure - 5 or more ($)
Mean house or condo value by units in structure - Boat, RV, van, etc. ($)
Mean house or condo value by units in structure - Mobile home ($)
Median contract rent ($)
Median contract rent - Lower quartile ($)
Median contract rent - Upper quartile ($)
Median gross rent ($)
Urban houses (%)
Rural houses (%)
Houses occupied (%)
Houses occupied (% change since 2000)
Houses owner occupied (%)
Houses owner occupied (% change since 2000)
Houses renter occupied (%)
Houses renter occupied (% change since 2000)
Vacant housing units - For rent (%)
Vacant housing units - For rent (% change since 2000)
Vacant housing units - For sale only (%)
Vacant housing units - For sale only (% change since 2000)
Vacant housing units - Rented or sold, not occupied (%)
Vacant housing units - Rented or sold, not occupied (% change since 2000)
Vacant housing units - For seasonal, recreational, or occasional use (%)
Vacant housing units - For seasonal, recreational, or occasional use (% change since 2000)
Vacant housing units - For migrant workers (%)
Vacant housing units - For migrant workers (% change since 2000)
Vacant housing units - Other vacant (%)
Vacant housing units - Other vacant (% change since 2000)
Median monthly housing costs ($)
Median household income for houses/condos with a mortgage ($)
Median household income for houses/condos without a mortgage ($)
Median household income ($)
Median household income ($) - White
Median household income ($) - Black or African American
Median household income ($) - Asian
Median household income ($) - Hispanic or Latino
Median household income ($) - American Indian and Alaska Native
Median household income ($) - Multirace
Median household income ($) - Other Race
Mortgage status - with mortgage (%)
Mortgage status - with second mortgage (%)
Mortgage status - with home equity loan (%)
Mortgage status - with both second mortgage and home equity loan (%)
Mortgage status - without a mortgage (%)
Median year house/condo built
Median year apartment built
Household type by relationship - Male householder living alone (%)
Household type by relationship - Male householder not living alone (%)
Household type by relationship - Female householder living alone (%)
Household type by relationship - Female householder not living alone (%)
Household type by relationship - Opposite-Sex spouse (%)
Household type by relationship - Same-Sex spouse (%)
Household type by relationship - Opposite-Sex unmarried partner (%)
Household type by relationship - Same-Sex unmarried partner (%)
Household type by relationship - In group quarters (%)
Size of family households - 2-person household (%)
Size of family households - 3-person household (%)
Size of family households - 4-person household (%)
Size of family households - 5-person household (%)
Size of family households - 6-person household (%)
Size of family households - 7-or-more-person household (%)
Size of nonfamily households - 1-person household (%)
Size of nonfamily households - 2-person household (%)
Size of nonfamily households - 3-person household (%)
Size of nonfamily households - 4-person household (%)
Size of nonfamily households - 5-person household (%)
Size of nonfamily households - 6-person household (%)
Size of nonfamily households - 7-or-moreperson household (%)
Year house built - Built 2010 or later (%)
Year house built - Built 2000 to 2009 (%)
Year house built - Built 1990 to 1999 (%)
Year house built - Built 1980 to 1989 (%)
Year house built - Built 1970 to 1979 (%)
Year house built - Built 1960 to 1969 (%)
Year house built - Built 1950 to 1959 (%)
Year house built - Built 1940 to 1949 (%)
Year house built - Built 1939 or earlier (%)
Median number of rooms in houses and condos
Median number of rooms in apartments
Median number of bedrooms in owner occupied houses
Mean number of bedrooms in owner occupied houses
Median number of bedrooms in renter occupied houses
Mean number of bedrooms in renter occupied houses
Median number of vehichles in owner occupied houses
Mean number of vehichles in owner occupied houses
Median number of vehichles in renter occupied houses
Mean number of vehichles in renter occupied houses
Rooms in owner-occupied houses - 1 room (%)
Rooms in owner-occupied houses - 2 rooms (%)
Rooms in owner-occupied houses - 3 rooms (%)
Rooms in owner-occupied houses - 4 rooms (%)
Rooms in owner-occupied houses - 5 rooms (%)
Rooms in owner-occupied houses - 6 rooms (%)
Rooms in owner-occupied houses - 7 rooms (%)
Rooms in owner-occupied houses - 8 rooms (%)
Rooms in owner-occupied houses - 9+ rooms (%)
Rooms in renter-occupied houses - 1 room (%)
Rooms in renter-occupied houses - 2 rooms (%)
Rooms in renter-occupied houses - 3 rooms (%)
Rooms in renter-occupied houses - 4 rooms (%)
Rooms in renter-occupied houses - 5 rooms (%)
Rooms in renter-occupied houses - 6 rooms (%)
Rooms in renter-occupied houses - 7 rooms (%)
Rooms in renter-occupied houses - 8 rooms (%)
Rooms in renter-occupied houses - 9+ rooms (%)
Bedrooms in owner-occupied houses - no bedrooms (%)
Bedrooms in owner-occupied houses - 1 bedroom (%)
Bedrooms in owner-occupied houses - 2 bedrooms (%)
Bedrooms in owner-occupied houses - 3 bedrooms (%)
Bedrooms in owner-occupied houses - 4 bedrooms (%)
Bedrooms in owner-occupied houses - 5+ bedrooms (%)
Bedrooms in renter-occupied houses - no bedrooms (%)
Bedrooms in renter-occupied houses - 1 bedroom (%)
Bedrooms in renter-occupied houses - 2 bedrooms (%)
Bedrooms in renter-occupied houses - 3 bedrooms (%)
Bedrooms in renter-occupied houses - 4 bedrooms (%)
Bedrooms in renter-occupied houses - 5+ bedrooms (%)
Vehicles available in owner-occupied houses - no vehicle available (%)
Vehicles available in owner-occupied houses - 1 vehicle available(%)
Vehicles available in owner-occupied houses - 2 Vehicles available (%)
Vehicles available in owner-occupied houses - 3 Vehicles available (%)
Vehicles available in owner-occupied houses - 4 Vehicles available (%)
Vehicles available in owner-occupied houses - 5+ Vehicles available (%)
Vehicles available in renter-occupied houses - no vehicle available (%)
Vehicles available in renter-occupied houses - 1 vehicle available (%)
Vehicles available in renter-occupied houses - 2 Vehicles available (%)
Vehicles available in renter-occupied houses - 3 Vehicles available (%)
Vehicles available in renter-occupied houses - 4 Vehicles available (%)
Vehicles available in renter-occupied houses - 5+ Vehicles available (%)
Housing units in structures - 1, detached (%)
Housing units in structures - 1, attached (%)
Housing units in structures - 2 (%)
Housing units in structures - 3 or 4 (%)
Housing units in structures - 5 to 9 (%)
Housing units in structures - 10 to 19 (%)
Housing units in structures - 20 to 49 (%)
Housing units in structures - 50 or more (%)
Housing units in structures - Mobile home (%)
Housing units in structures - Boat, RV, van, etc. (%)
Housing units in structures - Owners - 1, detached (%)
Housing units in structures - Owners - 1, attached (%)
Housing units in structures - Owners - 2 (%)
Housing units in structures - Owners - 3 or 4 (%)
Housing units in structures - Owners - 5 to 9 (%)
Housing units in structures - Owners - 10 to 19 (%)
Housing units in structures - Owners - 20 to 49 (%)
Housing units in structures - Owners - 50 or more (%)
Housing units in structures - Owners - Mobile home (%)
Housing units in structures - Owners - Boat, RV, van, etc. (%)
Housing units in structures - Renters - 1, detached (%)
Housing units in structures - Renters - 1, attached (%)
Housing units in structures - Renters - 2 (%)
Housing units in structures - Renters - 3 or 4 (%)
Housing units in structures - Renters - 5 to 9 (%)
Housing units in structures - Renters - 10 to 19 (%)
Housing units in structures - Renters - 20 to 49 (%)
Housing units in structures - Renters - 50 or more (%)
Housing units in structures - Renters - Mobile home (%)
Housing units in structures - Renters - Boat, RV, van, etc. (%)
House/condo owner moved in on average (years ago)
Renter moved in on average (years ago)
Year householder moved into unit - Moved in 1999 to March 2000 (%)
Year householder moved into unit - Moved in 1999 to March 2000 (%) - White
Year householder moved into unit - Moved in 1999 to March 2000 (%) - Black or African American
Year householder moved into unit - Moved in 1999 to March 2000 (%) - Asian
Year householder moved into unit - Moved in 1999 to March 2000 (%) - Hispanic or Latino
Year householder moved into unit - Moved in 1999 to March 2000 (%) - American Indian and Alaska Native
Year householder moved into unit - Moved in 1999 to March 2000 (%) - Multirace
Year householder moved into unit - Moved in 1999 to March 2000 (%) - Other Race
Year householder moved into unit - Moved in 1995 to 1998 (%)
Year householder moved into unit - Moved in 1995 to 1998 (%) - White
Year householder moved into unit - Moved in 1995 to 1998 (%) - Black or African American
Year householder moved into unit - Moved in 1995 to 1998 (%) - Asian
Year householder moved into unit - Moved in 1995 to 1998 (%) - Hispanic or Latino
Year householder moved into unit - Moved in 1995 to 1998 (%) - American Indian and Alaska Native
Year householder moved into unit - Moved in 1995 to 1998 (%) - Multirace
Year householder moved into unit - Moved in 1995 to 1998 (%) - Other Race
Year householder moved into unit - Moved in 1990 to 1994 (%)
Year householder moved into unit - Moved in 1990 to 1994 (%) - White
Year householder moved into unit - Moved in 1990 to 1994 (%) - Black or African American
Year householder moved into unit - Moved in 1990 to 1994 (%) - Asian
Year householder moved into unit - Moved in 1990 to 1994 (%) - Hispanic or Latino
Year householder moved into unit - Moved in 1990 to 1994 (%) - American Indian and Alaska Native
Year householder moved into unit - Moved in 1990 to 1994 (%) - Multirace
Year householder moved into unit - Moved in 1990 to 1994 (%) - Other Race
Year householder moved into unit - Moved in 1980 to 1989 (%)
Year householder moved into unit - Moved in 1980 to 1989 (%) - White
Year householder moved into unit - Moved in 1980 to 1989 (%) - Black or African American
Year householder moved into unit - Moved in 1980 to 1989 (%) - Asian
Year householder moved into unit - Moved in 1980 to 1989 (%) - Hispanic or Latino
Year householder moved into unit - Moved in 1980 to 1989 (%) - American Indian and Alaska Native
Year householder moved into unit - Moved in 1980 to 1989 (%) - Multirace
Year householder moved into unit - Moved in 1980 to 1989 (%) - Other Race
Year householder moved into unit - Moved in 1970 to 1979 (%)
Year householder moved into unit - Moved in 1970 to 1979 (%) - White
Year householder moved into unit - Moved in 1970 to 1979 (%) - Black or African American
Year householder moved into unit - Moved in 1970 to 1979 (%) - Asian
Year householder moved into unit - Moved in 1970 to 1979 (%) - Hispanic or Latino
Year householder moved into unit - Moved in 1970 to 1979 (%) - American Indian and Alaska Native
Year householder moved into unit - Moved in 1970 to 1979 (%) - Multirace
Year householder moved into unit - Moved in 1970 to 1979 (%) - Other Race
Year householder moved into unit - Moved in 1969 or earlier (%)
Year householder moved into unit - Moved in 1969 or earlier (%) - White
Year householder moved into unit - Moved in 1969 or earlier (%) - Black or African American
Year householder moved into unit - Moved in 1969 or earlier (%) - Asian
Year householder moved into unit - Moved in 1969 or earlier (%) - Hispanic or Latino
Year householder moved into unit - Moved in 1969 or earlier (%) - American Indian and Alaska Native
Year householder moved into unit - Moved in 1969 or earlier (%) - Multirace
Year householder moved into unit - Moved in 1969 or earlier (%) - Other Race
Housing units lacking complete plumbing facilities (%)
Housing units lacking complete kitchen facilities (%)
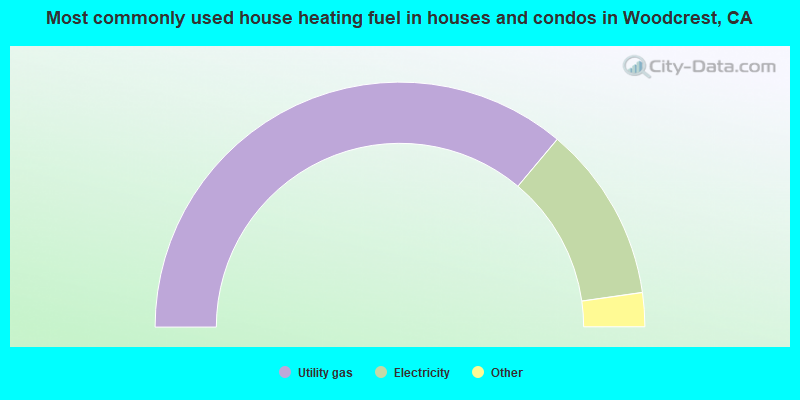
House heating fuel used in houses and condos - Utility gas (%)
House heating fuel used in houses and condos - Bottled, tank, or LP gas (%)
House heating fuel used in houses and condos - Electricity (%)
House heating fuel used in houses and condos - Fuel oil, kerosene, etc. (%)
House heating fuel used in houses and condos - Coal or coke (%)
House heating fuel used in houses and condos - Wood (%)
House heating fuel used in houses and condos - Solar energy (%)
House heating fuel used in houses and condos - Other fuel (%)
House heating fuel used in houses and condos - No fuel used (%)
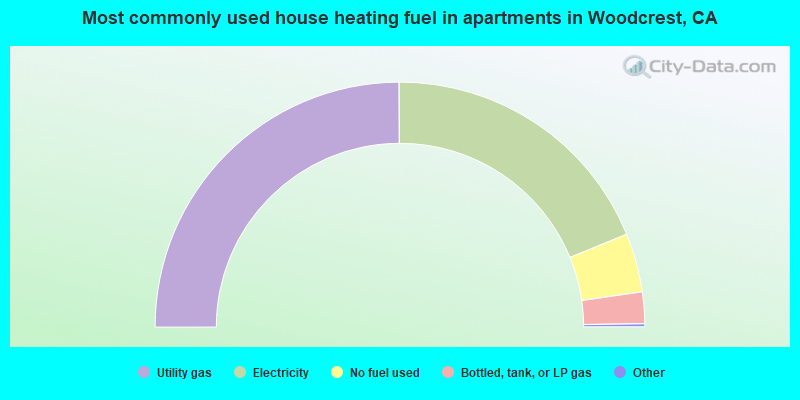
House heating fuel used in apartments - Utility gas (%)
House heating fuel used in apartments - Bottled, tank, or LP gas (%)
House heating fuel used in apartments - Electricity (%)
House heating fuel used in apartments - Fuel oil, kerosene, etc. (%)
House heating fuel used in apartments - Coal or coke (%)
House heating fuel used in apartments - Wood (%)
House heating fuel used in apartments - Solar energy (%)
House heating fuel used in apartments - Other fuel (%)
House heating fuel used in apartments - No fuel used (%)
Latest news about housing in Woodcrest, CA collected exclusively by city-data.com from local newspapers, TV, and radio stations
Median year house/condo built: 1983Median year apartment built: 1992Household type by relationship:
Households: 17,695
Male householders: 2,453 (275 living alone ), Female householders: 2,301 (250 living alone )3,486 spouses (3,450 opposite-sex spouses ), 205 unmarried partners , (195 opposite-sex unmarried partners ), 5,926 children (5,749 natural , 74 adopted , 102 stepchildren ), 999 grandchildren , 291 brothers or sisters , 377 parents , 0 foster children , 769 other relatives , 643 non-relatives In group quarters: 240
Size of family households: 1,090 2-persons , 997 3-persons , 811 4-persons , 665 5-persons , 177 6-persons , 463 7-or-more-persons .
Size of nonfamily households: 510 1-person , 121 2-persons .
2,598 married couples with children. single-parent households (63 men , 267 women ).
62.8% of residents of Woodcrest speak English at home. of residents speak Spanish at home (69% speak English very well , 17% speak English well , 11% speak English not well , 3% don't speak English at all ).of residents speak other Indo-European language at home (100% speak English very well ).of residents speak Asian or Pacific Island language at home (60% speak English very well , 28% speak English well , 11% speak English not well , 2% don't speak English at all ).of residents speak other language at home (86% speak English very well , 14% speak English not well ).
Foreign born population: 2,894 (16.4%)of them are naturalized citizens )
Median number of rooms in houses and condos:
Median number of rooms in apartments
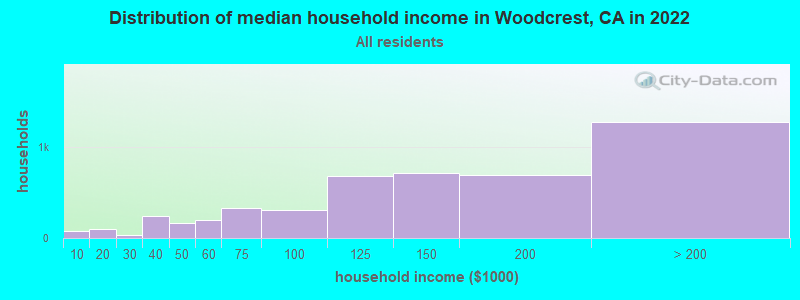
Woodcrest, CA household income distribution 80 Less than $10,00094 $10,000 to $19,99936 $20,000 to $29,999247 $30,000 to $39,999170 $40,000 to $49,999202 $50,000 to $59,999327 $60,000 to $74,999311 $75,000 to $99,999686 $100,000 to $124,999711 $125,000 to $149,999694 $150,000 to $199,9991,274 $200,000 or more
Home value of owner - occupied houses in 2022 in Woodcrest, CA 48 Less than $10,0003 $25,000 to $29,9996 $30,000 to $34,9999 $40,000 to $49,99987 $50,000 to $59,99925 $60,000 to $69,99924 $70,000 to $79,99910 $90,000 to $99,99984 $100,000 to $124,9996 $125,000 to $149,99977 $150,000 to $174,99926 $175,000 to $199,99935 $200,000 to $249,99922 $250,000 to $299,99973 $300,000 to $399,999293 $400,000 to $499,9992,687 $500,000 to $749,9991,430 $750,000 to $999,999421 $1,000,000 to $1,499,99949 $1,500,000 to $1,999,99949 $2,000,000 or moreRent paid by renters in 2022 in Woodcrest, CA 21 $800 to $8996 $900 to $99972 $1,000 to $1,2497 $1,250 to $1,49960 $1,500 to $1,99955 $2,000 to $2,499210 $2,500 to $2,99949 $3,000 to $3,49944 No cash rent
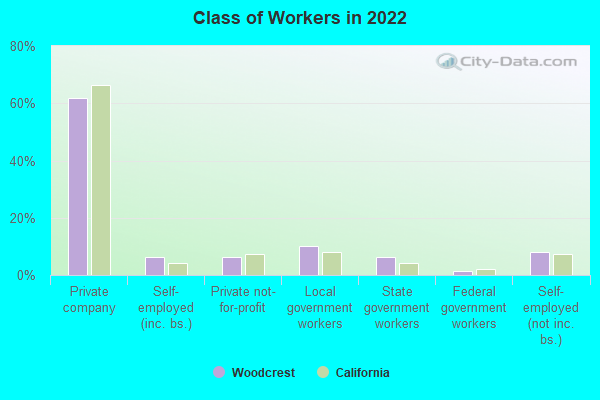
Percentage of workers working in this county: 70.3%Number of people working at home: 1,085 (12.8% of all workers )
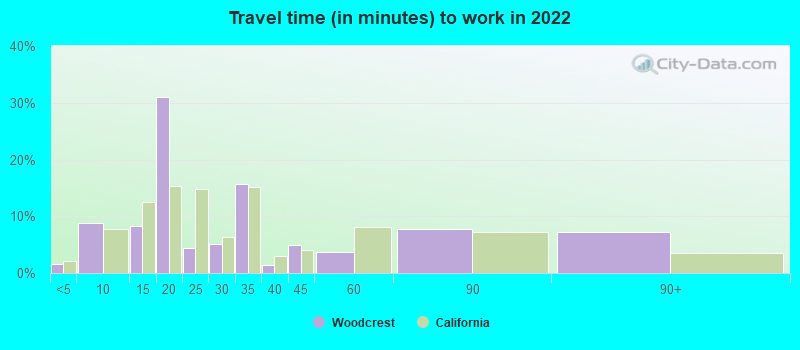
Travel time to work (commute)
Less than 5 minutes: 355 to 9 minutes: 45810 to 14 minutes: 30815 to 19 minutes: 1,17120 to 24 minutes: 1,34325 to 29 minutes: 50430 to 34 minutes: 1,00735 to 39 minutes: 24740 to 44 minutes: 41845 to 59 minutes: 58260 to 89 minutes: 1,13890 or more minutes: 312
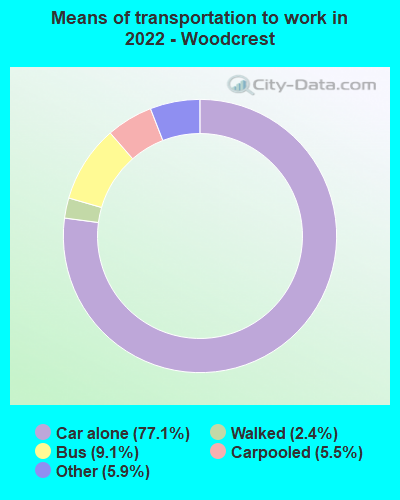
Means of transportation to work:
Drove a car alone: 855 (42.2%)Carpooled: 66 (3.3%)Bus : 90 (4.4%)Taxi: 67 (3.3%)Walked: 26 (1.3%)Worked at home: 1,085 (53.6%)
Unemployment by race in 2022
Unemployment rate for White non-Hispanic residents 2.5% Males3.5% FemalesUnemployment rate for Black residents 67.2% FemalesUnemployment rate for Asian residents 6.2% MalesUnemployment rate for two or more race residents 4.2% Males3.6% FemalesUnemployment rate for Hispanic or Latino residents 2.1% Males
Year of entry for the foreign-born population in Woodcrest, California
418 2010 or later 315 2000 to 2009 687 1990 to 1999 146 1980 to 1989 182 1970 to 1979 201 Before 1970
First ancestries reported:
English: 547 (5.2%)
German: 397 (3.7%)
Italian: 306 (2.9%)
American: 299 (2.8%)
Irish: 299 (2.8%)
Dutch: 67 (0.6%)
Egyptian: 64 (0.6%)
European: 64 (0.6%)
Norwegian: 64 (0.6%)
Northern European: 52 (0.5%)
Polish: 49 (0.5%)
Lebanese: 39 (0.4%)
Swedish: 38 (0.4%)
Eastern European: 35 (0.3%)
Canadian: 27 (0.3%)
Scottish: 25 (0.2%)
British: 17 (0.2%)
Scotch-Irish: 13 (0.1%)
Armenian: 10 (0.09%)
Iranian: 10 (0.09%)
French: 9 (0.08%)
Finnish: 8 (0.08%)
Basque: 7 (0.07%)
Scandinavian: 7 (0.07%)
Arab: 6 (0.06%)
Russian: 4 (0.04%)
Slovak: 4 (0.04%) Most common places of birth for foreign-born residents (%): Mexico Woodcrest:
54.0% (1,562)California:
37.2% (3,881,193)
Korea Woodcrest:
11.0% (318)California:
3.0% (315,248)
China, excluding Hong Kong and Taiwan Woodcrest:
9.3% (269)California:
6.6% (684,672)
El Salvador Woodcrest:
3.9% (113)California:
4.2% (440,287)
India Woodcrest:
3.2% (94)California:
5.2% (539,184)
Philippines Woodcrest:
3.1% (91)California:
7.8% (818,297)
Taiwan Woodcrest:
2.6% (74)California:
1.7% (176,274)
Place of birth for U.S.-born residents:
This state: 12,592Other state: 1,894Northeast: 250Midwest: 875South: 537West: 229 90.0% of Woodcrest residents lived in the same house 1 years ago.
Out of people who lived in different houses, 39.4% lived in this county.
Out of people who lived in different counties, 78.2% lived in California.
Woodcrest:
90.0%State average:
88.9%
Education attainment for males 25 years and older:
No schooling: 116Nursery to 4th grade: 135th and 6th grade: 617th and 8th grade: 539th grade: 4410th grade: 1411th grade: 10112th grade, no diploma: 98High school graduate (or equivalency): 1,797Less than 1 year of college: 634Some college more than 1 year, no degree: 1,134Associate degree: 594Bachelor's degree: 1,107Master's degree: 328Professional school degree: 70Doctorate degree: 116
Education attainment for females 25 years and older:
No schooling: 76Nursery to 4th grade: 265th and 6th grade: 857th and 8th grade: 839th grade: 6810th grade: 511th grade: 8812th grade, no diploma: 50High school graduate (or equivalency): 1,337Less than 1 year of college: 301Some college more than 1 year, no degree: 1,093Associate degree: 609Bachelor's degree: 985Master's degree: 633Professional school degree: 36Doctorate degree: 287
Housing units in structures:
One, detached: 4,528One, attached: 9Two: 723 or 4: 950 or more: 70Mobile homes: 368Median worth of mobile homes: $147,830
Housing units lacking complete plumbing facilities in 2022: 1.3%Housing units lacking complete kitchen facilities in 2022: 1.3%House/condo owner moved in on average 14 years ago
Renter moved in on average 6 years ago
Private vs. public school enrollment:
Students in private schools in grades 1 to 8 (elementary and middle school): 269 Here:
15.8%California:
10.5%
Students in private schools in grades 9 to 12 (high school): 106 Students in private undergraduate colleges: 281 Here:
17.6%California:
15.9%