Woodbury, TN (Tennessee) Houses and Residents
| Woodbury: | $203,937 |
| Tennessee: | $284,800 |
Mean price in 2022:
Detached houses: $203,159
Here: $203,159 State: $374,382 Townhouses or other attached units: $529,417
Here: $529,417 State: $354,101 Mobile homes: $116,308
Here: $116,308 State: $101,421
Total population: 2,730 (Urban population: 0, Rural population: 2,442 (all nonfarm))
Houses: 1,105 (1,037 occupied: 515 owner occupied, 541 renter occupied)
| % of renters here: | 51% |
| State: | 33% |
Housing density: 640 houses/condos per square mile
Median price asked for vacant for-sale houses and condos in 2022: $472,694.
Median contract rent in 2022: $548 (lower quartile is $379, upper quartile is $706)
Median rent asked for vacant for-rent units in 2022: $1,869
Median gross rent in Woodbury, TN in 2022: $694
Housing units in Woodbury with a mortgage: 317 (3 second mortgage, 0 home equity loan, 3 both second mortgage and home equity loan)
Houses without a mortgage: 0
Median household income for houses/condos with a mortgage: $71,539
Median household income for apartments without a mortgage: $37,561
Median monthly housing costs: $786
Compare current foreclosures near Woodbury, TN:
| Photo | Address | Area | Beds / Baths | Price | Details |
|---|---|---|---|---|---|

|
#1
Appaloosa Ln
Woodbury, TN 37190
|
3,114 sq. feet
|
3 baths - beds |
show details | |

|
#2
Judge Purser Hill Rd
Woodbury, TN 37190
|
2,986 sq. feet
|
2 baths - beds |
show details | |

|
#3
Mcminvvile Highway
Woodbury, TN 37190
|
1,144 sq. feet
|
1 baths - beds |
show details | |

|
#4
Sunny Slope Rd
Woodbury, TN 37190
|
984 sq. feet
|
1 baths - beds |
show details | |

|
#5
W High St
Woodbury, TN 37190
|
2,582 sq. feet
|
2 baths - beds |
show details | |

|
#6
Murfreesboro Rd
Woodbury, TN 37190
|
1,100 sq. feet
|
1 baths - beds |
show details | |

|
#7
Laurel St
Woodbury, TN 37190
|
1,000 sq. feet
|
1 baths - beds |
show details | |

|
#8
Tanglewood Dr
Woodbury, TN 37190
|
1,375 sq. feet
|
1 baths - beds |
show details | |

|
#9
Short Mountain Rd
Woodbury, TN 37190
|
1,386 sq. feet
|
1 baths - beds |
show details | |

|
#10
Old Mcminnville Rd
Woodbury, TN 37190
|
1,302 sq. feet
|
2 baths - beds |
show details |
| Photo | Address | Area | Beds / Baths | Price | Details |
|---|---|---|---|---|---|

|
#11
Jamie Cir
Woodbury, TN 37190
|
1,416 sq. feet
|
2 baths - beds |
show details | |

|
#12
Laurel St
Woodbury, TN 37190
|
1,000 sq. feet
|
1 baths - beds |
show details | |

|
#13
Rivendell Rd
Woodbury, TN 37190
|
1,280 sq. feet
|
2 baths - beds |
show details | |

|
#14
Rivers Edge Ln
Woodbury, TN 37190
|
1,800 sq. feet
|
2 baths - beds |
show details | |

|
#15
Hickory Ridge Ln
Woodbury, TN 37190
|
- sq. feet
|
- baths - beds |
show details | |

|
#16
Hollis Creek Rd
Woodbury, TN 37190
|
- sq. feet
|
- baths - beds |
show details | |

|
#17
Bogle Scott Rd
Woodbury, TN 37190
|
1,798 sq. feet
|
- baths - beds |
show details | |

|
#18
Auburn Hills Dr
Woodbury, TN 37190
|
- sq. feet
|
- baths - beds |
show details | |

|
#19
Mcbroom St
Woodbury, TN 37190
|
- sq. feet
|
- baths - beds |
show details | |

|
#20
S Dillon St Apt 201
Woodbury, TN 37190
|
- sq. feet
|
- baths - beds |
show details |
| Photo | Address | Area | Beds / Baths | Price | Details |
|---|---|---|---|---|---|

|
#21
Bragg St
Woodbury, TN 37190
|
- sq. feet
|
- baths - beds |
show details | |

|
#22
Mcferrin St
Woodbury, TN 37190
|
- sq. feet
|
- baths - beds |
show details | |

|
#23
S Mccrary St
Woodbury, TN 37190
|
- sq. feet
|
- baths - beds |
show details | |

|
#24
B Mathis Ln
Woodbury, TN 37190
|
- sq. feet
|
- baths - beds |
show details | |

|
#25
Old Prospect Rd
Woodbury, TN 37190
|
- sq. feet
|
- baths - beds |
show details | |

|
#26
Cove Hill Rd
Woodbury, TN 37190
|
- sq. feet
|
- baths - beds |
show details | |

|
#27
Hidden Valley Cir
Mc Minnville, TN 37110
|
1,404 sq. feet
|
2 baths 3 beds |
show details | |

|
#28
S Mountain St
Smithville, TN 37166
|
1,216 sq. feet
|
2 baths 3 beds |
show details | |

|
#29
Gossburg Rd
Beechgrove, TN 37018
|
2,960 sq. feet
|
3 baths 4 beds |
show details | |

|
#30
Twin Oak Dr
Murfreesboro, TN 37130
|
1,066 sq. feet
|
1 baths 3 beds |
show details |
| Photo | Address | Area | Beds / Baths | Price | Details |
|---|---|---|---|---|---|

|
#31
Moore Ln
Dowelltown, TN 37059
|
1,268 sq. feet
|
2 baths - beds |
show details | |

|
#32
Willow Dr
Murfreesboro, TN 37127
|
1,248 sq. feet
|
2 baths - beds |
show details | |

|
#33
Spring Valley Rd
Mc Minnville, TN 37110
|
1,250 sq. feet
|
2 baths - beds |
show details | |

|
#34
Ross Dr
Mc Minnville, TN 37110
|
1,000 sq. feet
|
1 baths - beds |
show details | |

|
#35
Chasteen Ct
Murfreesboro, TN 37130
|
2,875 sq. feet
|
4 baths - beds |
show details | |

|
#36
Obrien Dr
Murfreesboro, TN 37130
|
1,575 sq. feet
|
1 baths - beds |
show details | |

|
#37
Snell Rd
Murfreesboro, TN 37127
|
1,319 sq. feet
|
1 baths - beds |
show details | |

|
#38
Taborwood Trl
Murfreesboro, TN 37127
|
1,518 sq. feet
|
2 baths - beds |
show details | |

|
#39
Old Castle Dr
Murfreesboro, TN 37127
|
960 sq. feet
|
2 baths - beds |
show details | |

|
#40
Medford Campbell Blvd
Murfreesboro, TN 37127
|
1,276 sq. feet
|
2 baths - beds |
show details |
| Photo | Address | Area | Beds / Baths | Price | Details |
|---|---|---|---|---|---|

|
#41
Falling Tree Ct
Murfreesboro, TN 37130
|
1,230 sq. feet
|
2 baths - beds |
show details | |

|
#42
Hillingdon Dr
Murfreesboro, TN 37127
|
1,056 sq. feet
|
2 baths - beds |
show details | |

|
#43
Lillard Rd
Murfreesboro, TN 37130
|
2,149 sq. feet
|
2 baths - beds |
show details | |

|
#44
Gold Valley Dr
Murfreesboro, TN 37130
|
1,238 sq. feet
|
2 baths - beds |
show details | |

|
#45
Earl Ave
Smithville, TN 37166
|
1,200 sq. feet
|
1 baths - beds |
show details | |

|
#46
Lascassas Pike
Murfreesboro, TN 37130
|
4,631 sq. feet
|
- baths - beds |
show details | |

|
#47
May Ln
Murfreesboro, TN 37130
|
1,269 sq. feet
|
1 baths - beds |
show details | |

|
#48
Watts Ln
Murfreesboro, TN 37127
|
1,739 sq. feet
|
2 baths - beds |
show details | |

|
#49
Foxdale Dr
Murfreesboro, TN 37130
|
1,325 sq. feet
|
1 baths - beds |
show details | |

|
Check over 1 million property listings on Foreclosure.com!
|
browse all offers | |||

Latest news about housing in Woodbury, TN collected exclusively by city-data.com from local newspapers, TV, and radio stations

 | Contemplating a mobile home rather than apartment (26 replies) |
| Tennessee's 2020 Census results (74 replies) |
| Apartments off Old Hickory near Woodbury? (1 reply) |
| Searching for a house to rent (Wilson/Cannon/ or Sumner County (0 replies) |
| Searching for Home Rentals by Owner (0 replies) |
| Help finding new city (19 replies) |

Median year apartment built: 1972
Household type by relationship:
Households: 2,753- Male householders: 449 (188 living alone), Female householders: 576 (189 living alone)
262 spouses (259 opposite-sex spouses), 47 unmarried partners, (47 opposite-sex unmarried partners), 842 children (842 natural, 0 adopted, 0 stepchildren), 151 grandchildren, 11 brothers or sisters, 8 parents, 0 foster children, 77 other relatives, 193 non-relatives
- In group quarters: 133
Size of family households: 263 2-persons, 93 3-persons, 118 4-persons, 71 5-persons, 20 6-persons.
Size of nonfamily households: 384 1-person, 105 2-persons.
201 married couples with children.
320 single-parent households (7 men, 313 women).
98.5% of residents of Woodbury speak English at home.
0.9% of residents speak Spanish at home (83% speak English very well, 17% speak English not well).
Foreign born population: 28 (1.0%)
(57.1% of them are naturalized citizens)
| Here: | 6.3 |
| State: | 6.5 |
| Here: | 4.2 |
| State: | 4.4 |

- Bedrooms in owner-occupied houses and condos in Woodbury, Tennessee
- 6no bedroom
- 41 bedroom
- 782 bedrooms
- 3063 bedrooms
- 684 bedrooms
- 525+ bedrooms

- Bedrooms in renter-occupied apartments in Woodbury, Tennessee
- 19no bedroom
- 811 bedroom
- 2552 bedrooms
- 1873 bedrooms
- 04 bedrooms
- 05+ bedrooms

- Cars and other vehicles available in Woodbury in owner-occupied houses/condos
- 16no vehicle
- 2201 vehicle
- 1542 vehicles
- 883 vehicles
- 194 vehicles
- 185+ vehicles

- Cars and other vehicles available in Woodbury in renter-occupied apartments
- 69no vehicle
- 2701 vehicle
- 1402 vehicles
- 553 vehicles
- 84 vehicles
- 05+ vehicles

- Rooms in owner-occupied houses in Woodbury, Tennessee
- 61 room
- 02 rooms
- 183 rooms
- 154 rooms
- 1315 rooms
- 1146 rooms
- 727 rooms
- 768 rooms
- 839+ rooms

- Rooms in renter-occupied apartments in Woodbury, Tennessee
- 161 room
- 332 rooms
- 403 rooms
- 2214 rooms
- 1375 rooms
- 526 rooms
- 397 rooms
- 08 rooms
- 39+ rooms


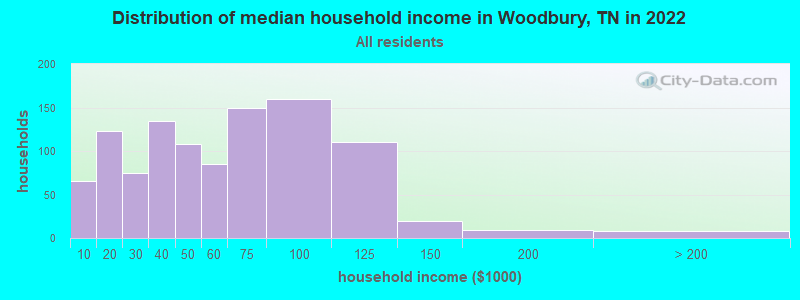
Woodbury, TN household income distribution

- 66Less than $10,000
- 123$10,000 to $19,999
- 75$20,000 to $29,999
- 135$30,000 to $39,999
- 108$40,000 to $49,999
- 85$50,000 to $59,999
- 150$60,000 to $74,999
- 160$75,000 to $99,999
- 110$100,000 to $124,999
- 20$125,000 to $149,999
- 9$150,000 to $199,999
- 8$200,000 or more
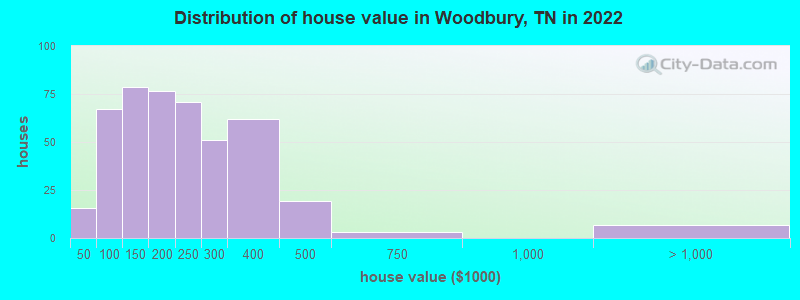
Home value of owner - occupied houses in 2022 in Woodbury, TN
-
- 10$30,000 to $34,999
- 4$40,000 to $49,999
- 7$50,000 to $59,999
- 5$60,000 to $69,999
- 18$70,000 to $79,999
- 14$80,000 to $89,999
- 14$90,000 to $99,999
- 46$100,000 to $124,999
- 31$125,000 to $149,999
- 54$150,000 to $174,999
- 21$175,000 to $199,999
- 70$200,000 to $249,999
- 50$250,000 to $299,999
- 61$300,000 to $399,999
- 19$400,000 to $499,999
- 3$500,000 to $749,999
- 6$2,000,000 or more
Rent paid by renters in 2022 in Woodbury, TN
-
- 40Less than $100
- 4$100 to $149
- 9$150 to $199
- 13$200 to $249
- 17$250 to $299
- 17$300 to $349
- 22$350 to $399
- 56$400 to $449
- 25$450 to $499
- 73$500 to $549
- 26$550 to $599
- 25$600 to $649
- 37$650 to $699
- 7$700 to $749
- 26$750 to $799
- 26$800 to $899
- 13$900 to $999
- 5$1,000 to $1,249
- 9$1,250 to $1,499
- 41No cash rent


Percentage of workers working in this county: 33.3%
Number of people working at home: 57 (4.6% of all workers)
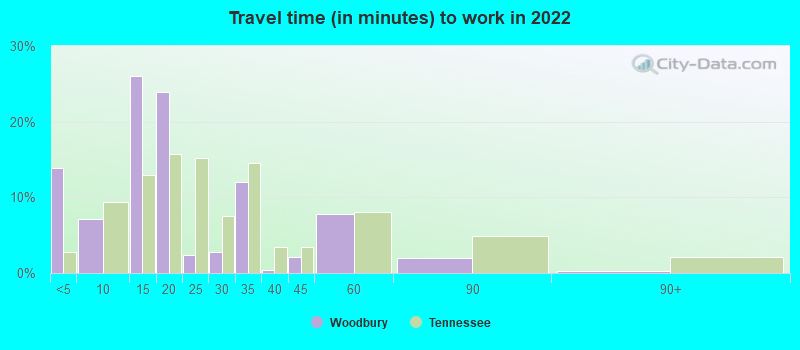
Travel time to work (commute)
- Less than 5 minutes: 206
- 5 to 9 minutes: 75
- 10 to 14 minutes: 51
- 15 to 19 minutes: 42
- 20 to 24 minutes: 119
- 25 to 29 minutes: 26
- 30 to 34 minutes: 207
- 35 to 39 minutes: 79
- 40 to 44 minutes: 26
- 45 to 59 minutes: 157
- 60 to 89 minutes: 146
- 90 or more minutes: 30
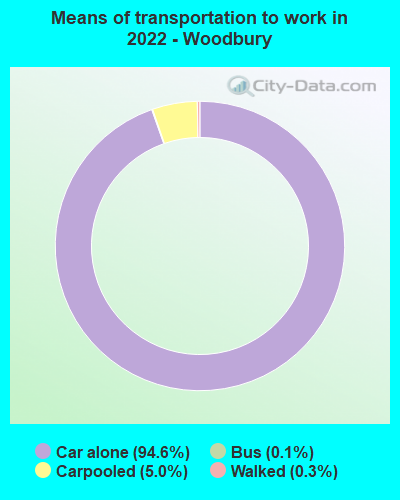
Means of transportation to work:
- Drove a car alone: 1,347 (87.6%)
- Carpooled: 74 (4.8%)
- Bus: 1 (0.1%)
- Walked: 4 (0.3%)
- Worked at home: 57 (3.7%)

- Unemployment by race in 2022
- Unemployment rate for White non-Hispanic residents
- 3.4%Males
- 0.8%Females
- Unemployment rate for Black residents
- 14.4%Males

- Year of entry for the foreign-born population in Woodbury, Tennessee
- 02010 or later
- 42000 to 2009
- 191990 to 1999
- 201980 to 1989
- 01970 to 1979
- 8Before 1970

First ancestries reported:
- American: 371 (38.5%)
- English: 150 (15.6%)
- Irish: 126 (13.1%)
- German: 32 (3.3%)
- Scotch-Irish: 19 (2.0%)
- European: 17 (1.8%)
- Italian: 12 (1.2%)
- French: 7 (0.7%)
- French Canadian: 5 (0.5%)
- Norwegian: 3 (0.3%)
- Hungarian: 2 (0.2%)
Most common places of birth for foreign-born residents (%):
| Woodbury: | 60.7% (17) |
| Tennessee: | 23.0% (86,435) |
| Woodbury: | 10.7% (3) |
| Tennessee: | 1.3% (4,841) |
| Woodbury: | 10.7% (3) |
| Tennessee: | 2.7% (10,295) |
Place of birth for U.S.-born residents:
- This state: 2,025
- Other state: 664
- Northeast: 101
- Midwest: 175
- South: 300
- West: 89
81.3% of Woodbury residents lived in the same house 1 years ago.
Out of people who lived in different houses, 20.0% lived in this county.
Out of people who lived in different counties, 95.8% lived in Tennessee.
| Woodbury: | 81.3% |
| State average: | 87.0% |
Education attainment for males 25 years and older:
- No schooling: 5
- Nursery to 4th grade: 3
- 5th and 6th grade: 0
- 7th and 8th grade: 2
- 9th grade: 44
- 10th grade: 24
- 11th grade: 16
- 12th grade, no diploma: 37
- High school graduate (or equivalency): 453
- Less than 1 year of college: 72
- Some college more than 1 year, no degree: 93
- Associate degree: 34
- Bachelor's degree: 116
- Master's degree: 11
- Professional school degree: 3
- Doctorate degree: 10

Education attainment for females 25 years and older:
- No schooling: 15
- Nursery to 4th grade: 2
- 5th and 6th grade: 11
- 7th and 8th grade: 11
- 9th grade: 3
- 10th grade: 17
- 11th grade: 14
- 12th grade, no diploma: 16
- High school graduate (or equivalency): 465
- Less than 1 year of college: 43
- Some college more than 1 year, no degree: 113
- Associate degree: 72
- Bachelor's degree: 129
- Master's degree: 14
- Professional school degree: 5
- Doctorate degree: 0


Housing units in structures:
- One, detached: 813
- One, attached: 28
- Two: 29
- 3 or 4: 55
- 5 to 9: 127
- 20 to 49: 22
- 50 or more: 9
- Mobile homes: 18
Housing units lacking complete kitchen facilities in 2022: 1.4%
House/condo owner moved in on average 5 years ago
Renter moved in on average 6 years ago

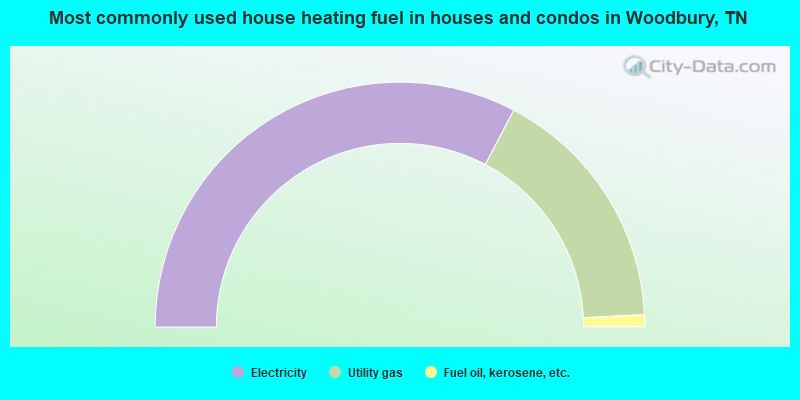
- 65.4%Electricity
- 33.0%Utility gas
- 1.6%Fuel oil, kerosene, etc.
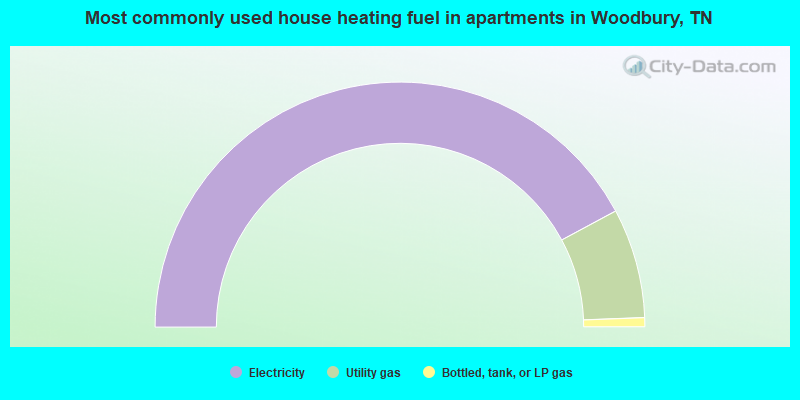
- 84.3%Electricity
- 14.5%Utility gas
- 1.2%Bottled, tank, or LP gas
Private vs. public school enrollment:
| Here: | 8.7% |
| Tennessee: | 15.0% |
| Here: | 14.0% |
| Tennessee: | 16.2% |
| Here: | 0.0% |
| Tennessee: | 23.5% |


