Woodbury, MN (Minnesota) Houses and Residents
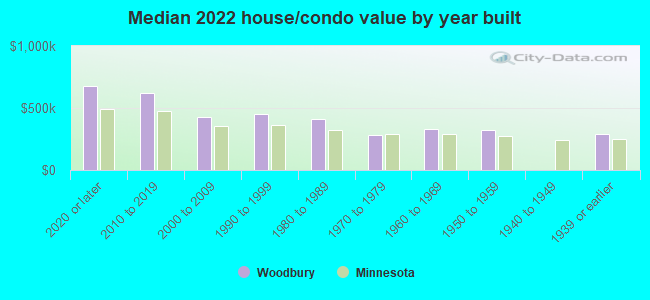
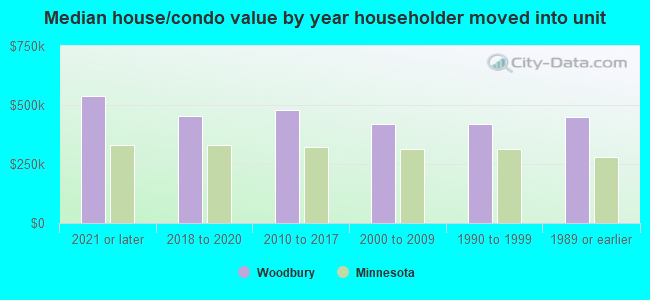
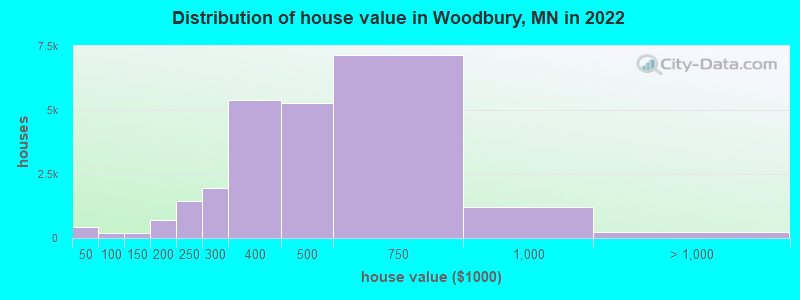
Estimated median house or condo value in 2022: $448,400 (it was $172,700 in 2000 )
Woodbury:
$448,400Minnesota:
$314,600
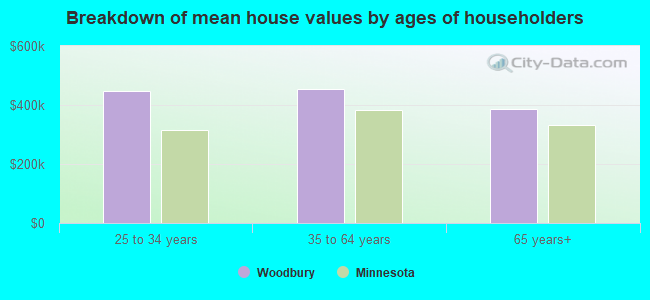
Lower value quartile - upper value quartile: $316,900 - $606,300Mean price in 2022: Detached houses: $494,067 Here:
$494,067State:
$374,552
Townhouses or other attached units: $324,971 Here:
$324,971State:
$312,049
In 2-unit structures: $363,146 Here:
$363,146State:
$323,045
In 3-to-4-unit structures: $155,994 Here:
$155,994State:
$238,971
In 5-or-more-unit structures: $259,328 Here:
$259,328State:
$258,516
Mobile homes: $87,380 Here:
$87,380State:
$94,605
Total population: 66,807 (Urban population: 44,929, Rural population: 1,535 (149 farm, 1,386 nonfarm ))
Houses: 30,571 (30,291 occupied: 23,100 owner occupied, 7,191 renter occupied )
% of renters here:
24%State:
28%
Housing density: 874 houses/condos per square mile
Median price asked for vacant for-sale houses and condos in 2022: $1,260,304.
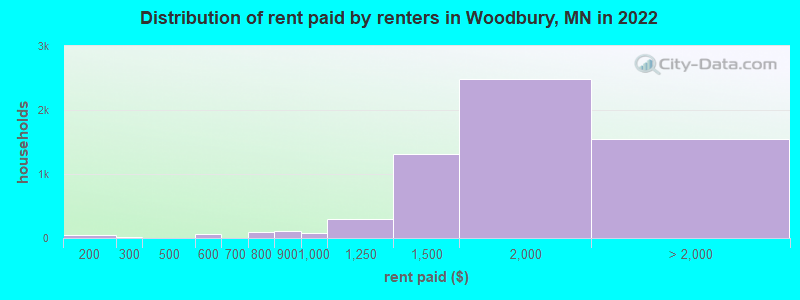
Median contract rent in 2022: $1,672 (lower quartile is $1,396, upper quartile is $1,926)
Median rent asked for vacant for-rent units in 2022: $954
Median gross rent in Woodbury, MN in 2022: $1,794
Housing units in Woodbury with a mortgage: 16,607 (2,084 second mortgage, 90 home equity loan, 1,908 both second mortgage and home equity loan )Houses without a mortgage: 144
Median household income for houses/condos with a mortgage: $156,110
Median household income for apartments without a mortgage: $109,092
Median monthly housing costs: $1,815
Data:
Median house or condo value ($)
Median house or condo value ($ change since 2000)
Median house or condo value ($) - White
Median house or condo value ($) - Black or African American
Median house or condo value ($) - Asian
Median house or condo value ($) - Hispanic or Latino
Median house or condo value ($) - American Indian and Alaska Native
Median house or condo value ($) - Multirace
Median house or condo value ($) - Other Race
Median price asked for mobile homes ($)
Household density (households per square mile)
Mean house or condo value by units in structure - 1, detached ($)
Mean house or condo value by units in structure - 1, attached ($)
Mean house or condo value by units in structure - 2 ($)
Mean house or condo value by units in structure by units in structure - 3 or 4 ($)
Mean house or condo value by units in structure - 5 or more ($)
Mean house or condo value by units in structure - Boat, RV, van, etc. ($)
Mean house or condo value by units in structure - Mobile home ($)
Median contract rent ($)
Median contract rent - Lower quartile ($)
Median contract rent - Upper quartile ($)
Median gross rent ($)
Urban houses (%)
Rural houses (%)
Houses occupied (%)
Houses occupied (% change since 2000)
Houses owner occupied (%)
Houses owner occupied (% change since 2000)
Houses renter occupied (%)
Houses renter occupied (% change since 2000)
Vacant housing units - For rent (%)
Vacant housing units - For rent (% change since 2000)
Vacant housing units - For sale only (%)
Vacant housing units - For sale only (% change since 2000)
Vacant housing units - Rented or sold, not occupied (%)
Vacant housing units - Rented or sold, not occupied (% change since 2000)
Vacant housing units - For seasonal, recreational, or occasional use (%)
Vacant housing units - For seasonal, recreational, or occasional use (% change since 2000)
Vacant housing units - For migrant workers (%)
Vacant housing units - For migrant workers (% change since 2000)
Vacant housing units - Other vacant (%)
Vacant housing units - Other vacant (% change since 2000)
Median monthly housing costs ($)
Median household income for houses/condos with a mortgage ($)
Median household income for houses/condos without a mortgage ($)
Median household income ($)
Median household income ($) - White
Median household income ($) - Black or African American
Median household income ($) - Asian
Median household income ($) - Hispanic or Latino
Median household income ($) - American Indian and Alaska Native
Median household income ($) - Multirace
Median household income ($) - Other Race
Mortgage status - with mortgage (%)
Mortgage status - with second mortgage (%)
Mortgage status - with home equity loan (%)
Mortgage status - with both second mortgage and home equity loan (%)
Mortgage status - without a mortgage (%)
Median year house/condo built
Median year apartment built
Household type by relationship - Male householder living alone (%)
Household type by relationship - Male householder not living alone (%)
Household type by relationship - Female householder living alone (%)
Household type by relationship - Female householder not living alone (%)
Household type by relationship - Opposite-Sex spouse (%)
Household type by relationship - Same-Sex spouse (%)
Household type by relationship - Opposite-Sex unmarried partner (%)
Household type by relationship - Same-Sex unmarried partner (%)
Household type by relationship - In group quarters (%)
Size of family households - 2-person household (%)
Size of family households - 3-person household (%)
Size of family households - 4-person household (%)
Size of family households - 5-person household (%)
Size of family households - 6-person household (%)
Size of family households - 7-or-more-person household (%)
Size of nonfamily households - 1-person household (%)
Size of nonfamily households - 2-person household (%)
Size of nonfamily households - 3-person household (%)
Size of nonfamily households - 4-person household (%)
Size of nonfamily households - 5-person household (%)
Size of nonfamily households - 6-person household (%)
Size of nonfamily households - 7-or-moreperson household (%)
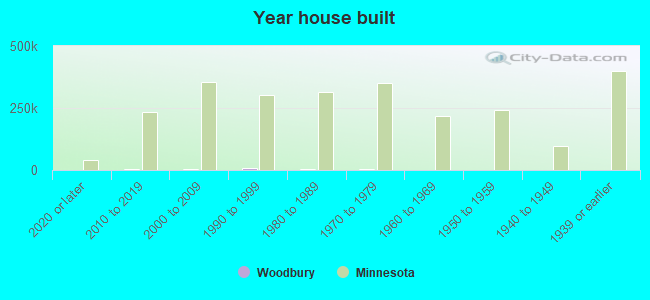
Year house built - Built 2010 or later (%)
Year house built - Built 2000 to 2009 (%)
Year house built - Built 1990 to 1999 (%)
Year house built - Built 1980 to 1989 (%)
Year house built - Built 1970 to 1979 (%)
Year house built - Built 1960 to 1969 (%)
Year house built - Built 1950 to 1959 (%)
Year house built - Built 1940 to 1949 (%)
Year house built - Built 1939 or earlier (%)
Median number of rooms in houses and condos
Median number of rooms in apartments
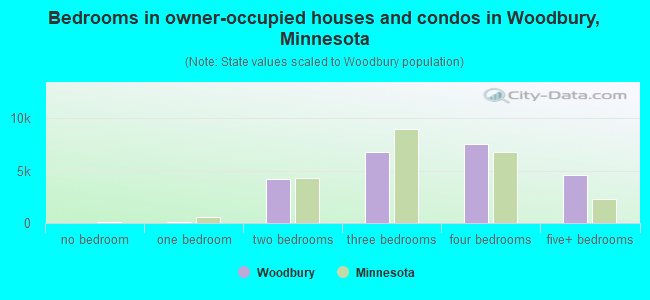
Median number of bedrooms in owner occupied houses
Mean number of bedrooms in owner occupied houses
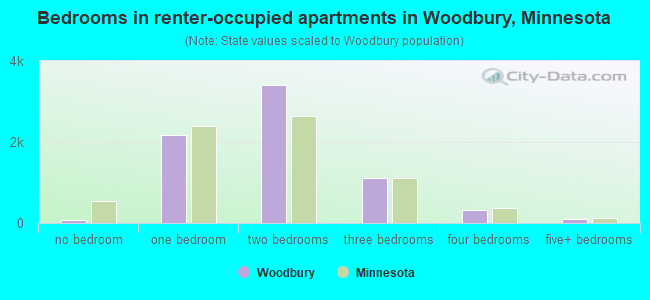
Median number of bedrooms in renter occupied houses
Mean number of bedrooms in renter occupied houses
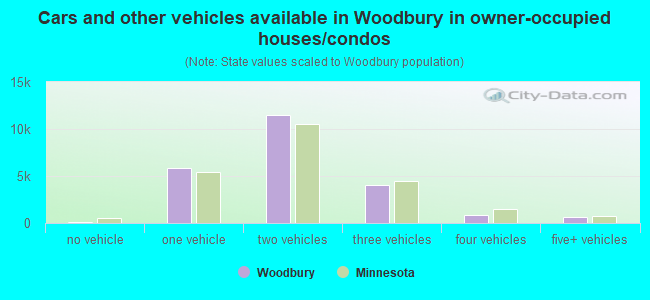
Median number of vehichles in owner occupied houses
Mean number of vehichles in owner occupied houses
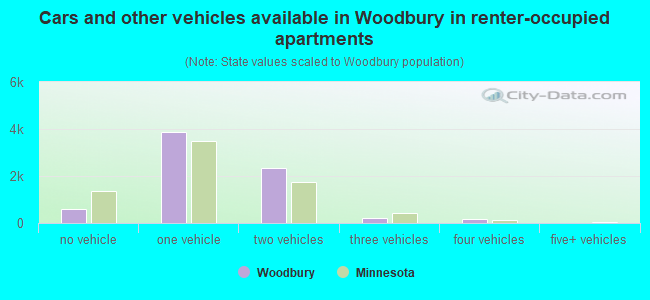
Median number of vehichles in renter occupied houses
Mean number of vehichles in renter occupied houses
Rooms in owner-occupied houses - 1 room (%)
Rooms in owner-occupied houses - 2 rooms (%)
Rooms in owner-occupied houses - 3 rooms (%)
Rooms in owner-occupied houses - 4 rooms (%)
Rooms in owner-occupied houses - 5 rooms (%)
Rooms in owner-occupied houses - 6 rooms (%)
Rooms in owner-occupied houses - 7 rooms (%)
Rooms in owner-occupied houses - 8 rooms (%)
Rooms in owner-occupied houses - 9+ rooms (%)
Rooms in renter-occupied houses - 1 room (%)
Rooms in renter-occupied houses - 2 rooms (%)
Rooms in renter-occupied houses - 3 rooms (%)
Rooms in renter-occupied houses - 4 rooms (%)
Rooms in renter-occupied houses - 5 rooms (%)
Rooms in renter-occupied houses - 6 rooms (%)
Rooms in renter-occupied houses - 7 rooms (%)
Rooms in renter-occupied houses - 8 rooms (%)
Rooms in renter-occupied houses - 9+ rooms (%)
Bedrooms in owner-occupied houses - no bedrooms (%)
Bedrooms in owner-occupied houses - 1 bedroom (%)
Bedrooms in owner-occupied houses - 2 bedrooms (%)
Bedrooms in owner-occupied houses - 3 bedrooms (%)
Bedrooms in owner-occupied houses - 4 bedrooms (%)
Bedrooms in owner-occupied houses - 5+ bedrooms (%)
Bedrooms in renter-occupied houses - no bedrooms (%)
Bedrooms in renter-occupied houses - 1 bedroom (%)
Bedrooms in renter-occupied houses - 2 bedrooms (%)
Bedrooms in renter-occupied houses - 3 bedrooms (%)
Bedrooms in renter-occupied houses - 4 bedrooms (%)
Bedrooms in renter-occupied houses - 5+ bedrooms (%)
Vehicles available in owner-occupied houses - no vehicle available (%)
Vehicles available in owner-occupied houses - 1 vehicle available(%)
Vehicles available in owner-occupied houses - 2 Vehicles available (%)
Vehicles available in owner-occupied houses - 3 Vehicles available (%)
Vehicles available in owner-occupied houses - 4 Vehicles available (%)
Vehicles available in owner-occupied houses - 5+ Vehicles available (%)
Vehicles available in renter-occupied houses - no vehicle available (%)
Vehicles available in renter-occupied houses - 1 vehicle available (%)
Vehicles available in renter-occupied houses - 2 Vehicles available (%)
Vehicles available in renter-occupied houses - 3 Vehicles available (%)
Vehicles available in renter-occupied houses - 4 Vehicles available (%)
Vehicles available in renter-occupied houses - 5+ Vehicles available (%)
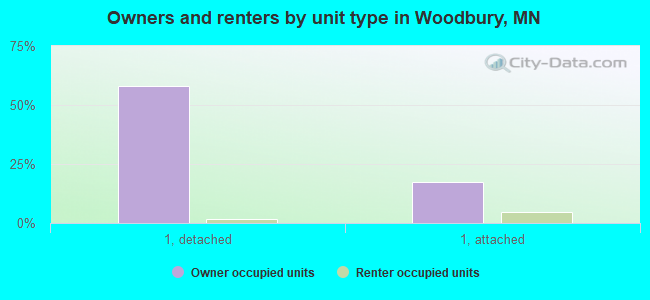
Housing units in structures - 1, detached (%)
Housing units in structures - 1, attached (%)
Housing units in structures - 2 (%)
Housing units in structures - 3 or 4 (%)
Housing units in structures - 5 to 9 (%)
Housing units in structures - 10 to 19 (%)
Housing units in structures - 20 to 49 (%)
Housing units in structures - 50 or more (%)
Housing units in structures - Mobile home (%)
Housing units in structures - Boat, RV, van, etc. (%)
Housing units in structures - Owners - 1, detached (%)
Housing units in structures - Owners - 1, attached (%)
Housing units in structures - Owners - 2 (%)
Housing units in structures - Owners - 3 or 4 (%)
Housing units in structures - Owners - 5 to 9 (%)
Housing units in structures - Owners - 10 to 19 (%)
Housing units in structures - Owners - 20 to 49 (%)
Housing units in structures - Owners - 50 or more (%)
Housing units in structures - Owners - Mobile home (%)
Housing units in structures - Owners - Boat, RV, van, etc. (%)
Housing units in structures - Renters - 1, detached (%)
Housing units in structures - Renters - 1, attached (%)
Housing units in structures - Renters - 2 (%)
Housing units in structures - Renters - 3 or 4 (%)
Housing units in structures - Renters - 5 to 9 (%)
Housing units in structures - Renters - 10 to 19 (%)
Housing units in structures - Renters - 20 to 49 (%)
Housing units in structures - Renters - 50 or more (%)
Housing units in structures - Renters - Mobile home (%)
Housing units in structures - Renters - Boat, RV, van, etc. (%)
House/condo owner moved in on average (years ago)
Renter moved in on average (years ago)
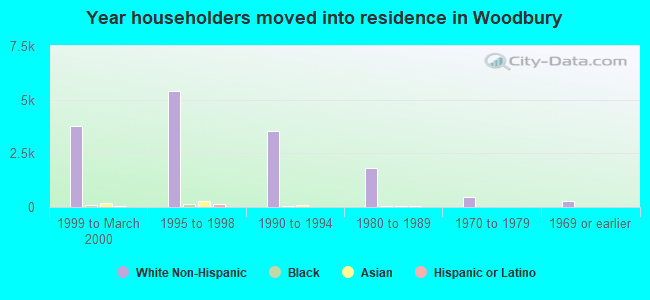
Year householder moved into unit - Moved in 1999 to March 2000 (%)
Year householder moved into unit - Moved in 1999 to March 2000 (%) - White
Year householder moved into unit - Moved in 1999 to March 2000 (%) - Black or African American
Year householder moved into unit - Moved in 1999 to March 2000 (%) - Asian
Year householder moved into unit - Moved in 1999 to March 2000 (%) - Hispanic or Latino
Year householder moved into unit - Moved in 1999 to March 2000 (%) - American Indian and Alaska Native
Year householder moved into unit - Moved in 1999 to March 2000 (%) - Multirace
Year householder moved into unit - Moved in 1999 to March 2000 (%) - Other Race
Year householder moved into unit - Moved in 1995 to 1998 (%)
Year householder moved into unit - Moved in 1995 to 1998 (%) - White
Year householder moved into unit - Moved in 1995 to 1998 (%) - Black or African American
Year householder moved into unit - Moved in 1995 to 1998 (%) - Asian
Year householder moved into unit - Moved in 1995 to 1998 (%) - Hispanic or Latino
Year householder moved into unit - Moved in 1995 to 1998 (%) - American Indian and Alaska Native
Year householder moved into unit - Moved in 1995 to 1998 (%) - Multirace
Year householder moved into unit - Moved in 1995 to 1998 (%) - Other Race
Year householder moved into unit - Moved in 1990 to 1994 (%)
Year householder moved into unit - Moved in 1990 to 1994 (%) - White
Year householder moved into unit - Moved in 1990 to 1994 (%) - Black or African American
Year householder moved into unit - Moved in 1990 to 1994 (%) - Asian
Year householder moved into unit - Moved in 1990 to 1994 (%) - Hispanic or Latino
Year householder moved into unit - Moved in 1990 to 1994 (%) - American Indian and Alaska Native
Year householder moved into unit - Moved in 1990 to 1994 (%) - Multirace
Year householder moved into unit - Moved in 1990 to 1994 (%) - Other Race
Year householder moved into unit - Moved in 1980 to 1989 (%)
Year householder moved into unit - Moved in 1980 to 1989 (%) - White
Year householder moved into unit - Moved in 1980 to 1989 (%) - Black or African American
Year householder moved into unit - Moved in 1980 to 1989 (%) - Asian
Year householder moved into unit - Moved in 1980 to 1989 (%) - Hispanic or Latino
Year householder moved into unit - Moved in 1980 to 1989 (%) - American Indian and Alaska Native
Year householder moved into unit - Moved in 1980 to 1989 (%) - Multirace
Year householder moved into unit - Moved in 1980 to 1989 (%) - Other Race
Year householder moved into unit - Moved in 1970 to 1979 (%)
Year householder moved into unit - Moved in 1970 to 1979 (%) - White
Year householder moved into unit - Moved in 1970 to 1979 (%) - Black or African American
Year householder moved into unit - Moved in 1970 to 1979 (%) - Asian
Year householder moved into unit - Moved in 1970 to 1979 (%) - Hispanic or Latino
Year householder moved into unit - Moved in 1970 to 1979 (%) - American Indian and Alaska Native
Year householder moved into unit - Moved in 1970 to 1979 (%) - Multirace
Year householder moved into unit - Moved in 1970 to 1979 (%) - Other Race
Year householder moved into unit - Moved in 1969 or earlier (%)
Year householder moved into unit - Moved in 1969 or earlier (%) - White
Year householder moved into unit - Moved in 1969 or earlier (%) - Black or African American
Year householder moved into unit - Moved in 1969 or earlier (%) - Asian
Year householder moved into unit - Moved in 1969 or earlier (%) - Hispanic or Latino
Year householder moved into unit - Moved in 1969 or earlier (%) - American Indian and Alaska Native
Year householder moved into unit - Moved in 1969 or earlier (%) - Multirace
Year householder moved into unit - Moved in 1969 or earlier (%) - Other Race
Housing units lacking complete plumbing facilities (%)
Housing units lacking complete kitchen facilities (%)
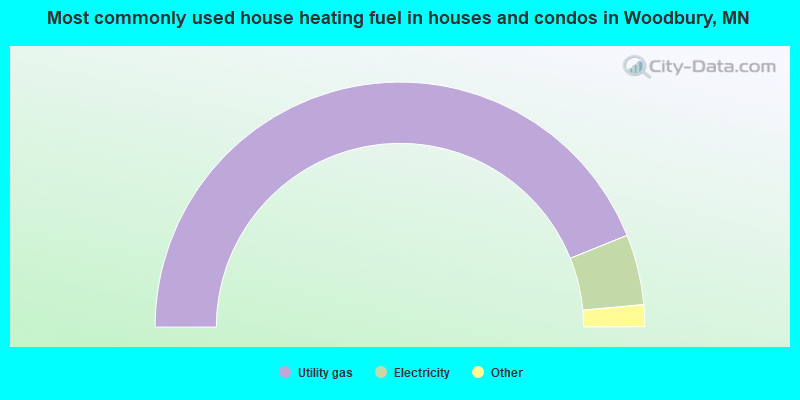
House heating fuel used in houses and condos - Utility gas (%)
House heating fuel used in houses and condos - Bottled, tank, or LP gas (%)
House heating fuel used in houses and condos - Electricity (%)
House heating fuel used in houses and condos - Fuel oil, kerosene, etc. (%)
House heating fuel used in houses and condos - Coal or coke (%)
House heating fuel used in houses and condos - Wood (%)
House heating fuel used in houses and condos - Solar energy (%)
House heating fuel used in houses and condos - Other fuel (%)
House heating fuel used in houses and condos - No fuel used (%)
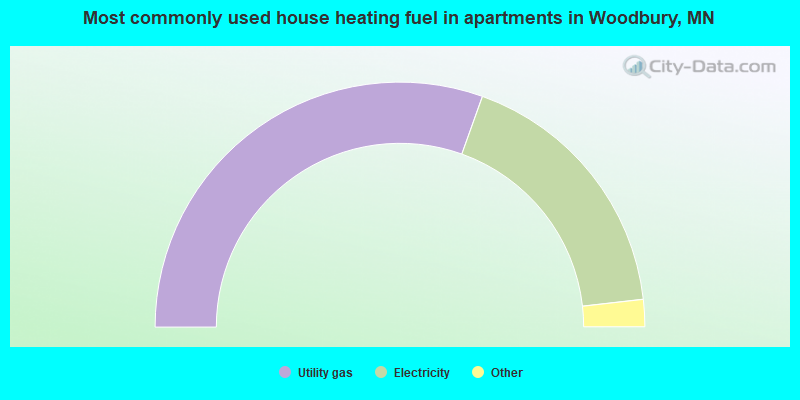
House heating fuel used in apartments - Utility gas (%)
House heating fuel used in apartments - Bottled, tank, or LP gas (%)
House heating fuel used in apartments - Electricity (%)
House heating fuel used in apartments - Fuel oil, kerosene, etc. (%)
House heating fuel used in apartments - Coal or coke (%)
House heating fuel used in apartments - Wood (%)
House heating fuel used in apartments - Solar energy (%)
House heating fuel used in apartments - Other fuel (%)
House heating fuel used in apartments - No fuel used (%)
Latest news about housing in Woodbury, MN collected exclusively by city-data.com from local newspapers, TV, and radio stations
Median year house/condo built: 1996Median year apartment built: 2005Household type by relationship:
Households: 78,560
Male householders: 13,324 (1,863 living alone ), Female householders: 16,967 (4,866 living alone )16,670 spouses (16,670 opposite-sex spouses ), 2,190 unmarried partners , (2,190 opposite-sex unmarried partners ), 23,091 children (22,155 natural , 453 adopted , 483 stepchildren ), 788 grandchildren , 711 brothers or sisters , 876 parents , 126 foster children , 297 other relatives , 3,045 non-relatives In group quarters: 475
Size of family households: 8,603 2-persons , 4,632 3-persons , 5,054 4-persons , 2,071 5-persons , 374 6-persons , 378 7-or-more-persons .
Size of nonfamily households: 6,729 1-person , 1,979 2-persons , 158 3-persons , 78 5-persons , 235 7-or-more-persons .
15,052 married couples with children. single-parent households (1,140 men , 2,564 women ).
83.1% of residents of Woodbury speak English at home. of residents speak Spanish at home (61% speak English very well , 25% speak English well , 12% speak English not well , 3% don't speak English at all ).of residents speak other Indo-European language at home (80% speak English very well , 16% speak English well , 5% speak English not well ).of residents speak Asian or Pacific Island language at home (68% speak English very well , 29% speak English well , 3% speak English not well ).of residents speak other language at home (55% speak English very well , 40% speak English well , 3% speak English not well , 2% don't speak English at all ).
Foreign born population: 10,891 (13.9%)of them are naturalized citizens )
Median number of rooms in houses and condos:
Median number of rooms in apartments
Owner-occupied Renter-occupied
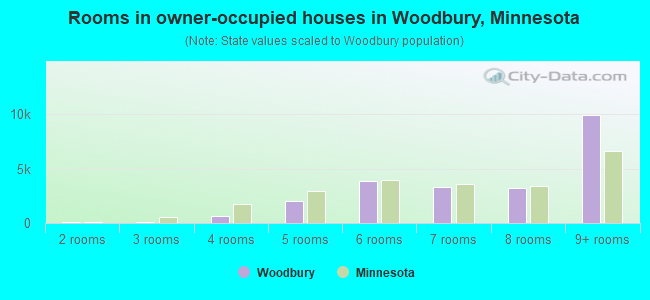
Rooms in owner-occupied houses in Woodbury, Minnesota
0 1 room 51 2 rooms 60 3 rooms 663 4 rooms 1,991 5 rooms 3,896 6 rooms 3,324 7 rooms 3,191 8 rooms 9,924 9+ rooms
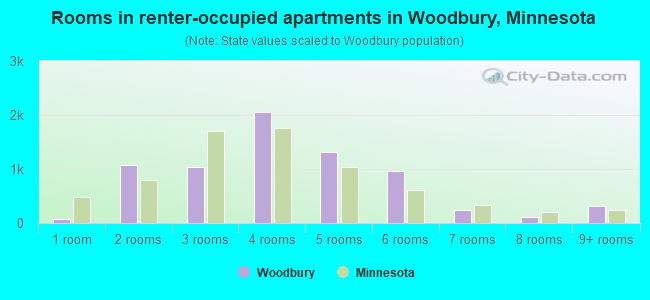
Rooms in renter-occupied apartments in Woodbury, Minnesota
71 1 room 1,073 2 rooms 1,043 3 rooms 2,054 4 rooms 1,319 5 rooms 972 6 rooms 236 7 rooms 116 8 rooms 307 9+ rooms
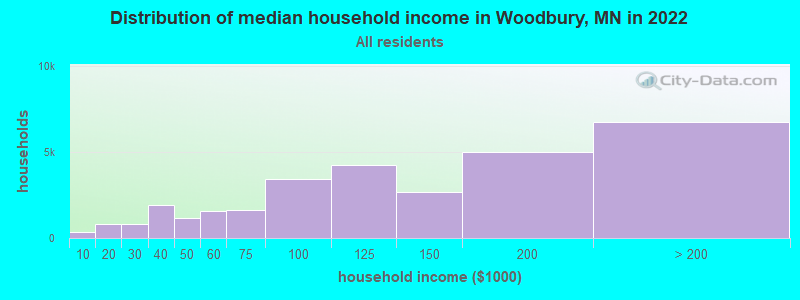
Woodbury, MN household income distribution 326 Less than $10,000804 $10,000 to $19,999792 $20,000 to $29,9991,914 $30,000 to $39,9991,176 $40,000 to $49,9991,584 $50,000 to $59,9991,628 $60,000 to $74,9993,410 $75,000 to $99,9994,232 $100,000 to $124,9992,689 $125,000 to $149,9995,011 $150,000 to $199,9996,725 $200,000 or more
Home value of owner - occupied houses in 2022 in Woodbury, MN 199 Less than $10,00082 $10,000 to $14,9998 $15,000 to $19,99944 $20,000 to $24,99966 $25,000 to $29,9993 $30,000 to $34,99928 $35,000 to $39,9999 $40,000 to $49,9998 $50,000 to $59,99944 $60,000 to $69,99930 $80,000 to $89,99989 $90,000 to $99,999108 $100,000 to $124,99978 $125,000 to $149,999134 $150,000 to $174,999563 $175,000 to $199,9991,450 $200,000 to $249,9991,958 $250,000 to $299,9995,395 $300,000 to $399,9995,274 $400,000 to $499,9997,140 $500,000 to $749,9991,212 $750,000 to $999,999176 $1,000,000 to $1,499,99974 $2,000,000 or moreRent paid by renters in 2022 in Woodbury, MN 16 $100 to $14930 $150 to $19910 $250 to $29958 $550 to $59968 $700 to $74923 $750 to $799114 $800 to $89985 $900 to $999293 $1,000 to $1,2491,304 $1,250 to $1,4992,480 $1,500 to $1,999614 $2,000 to $2,499348 $2,500 to $2,999142 $3,000 to $3,499126 $3,500 or more308 No cash rent
Percentage of workers working in this county: 52.0%Number of people working at home: 12,251 (28.6% of all workers )
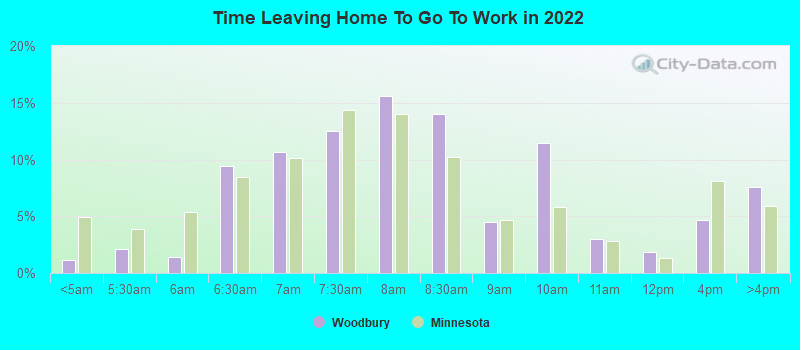
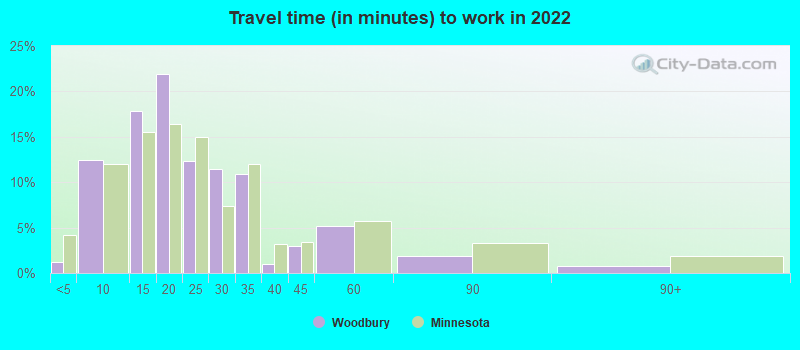
Travel time to work (commute)
Less than 5 minutes: 3275 to 9 minutes: 2,42210 to 14 minutes: 3,95515 to 19 minutes: 4,36020 to 24 minutes: 6,81425 to 29 minutes: 3,30530 to 34 minutes: 5,87635 to 39 minutes: 94840 to 44 minutes: 93745 to 59 minutes: 2,21060 to 89 minutes: 27790 or more minutes: 414
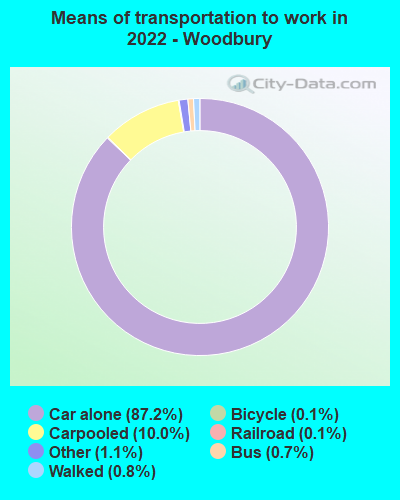
Means of transportation to work:
Drove a car alone: 22,105 (59.7%)Carpooled: 2,371 (6.4%)Bus : 135 (0.4%)Light rail, streetcar or trolley : 30 (0.1%)Taxi: 343 (0.9%)Bicycle: 48 (0.1%)Walked: 167 (0.5%)Worked at home: 12,251 (33.1%)
Unemployment by race in 2022
Unemployment rate for White non-Hispanic residents 2.7% Males2.7% FemalesUnemployment rate for Black residents 1.6% Males2.0% FemalesUnemployment rate for Asian residents 1.1% MalesUnemployment rate for other race residents 3.1% MalesUnemployment rate for two or more race residents 4.1% Males8.5% FemalesUnemployment rate for Hispanic or Latino residents 1.7% Males12.1% Females
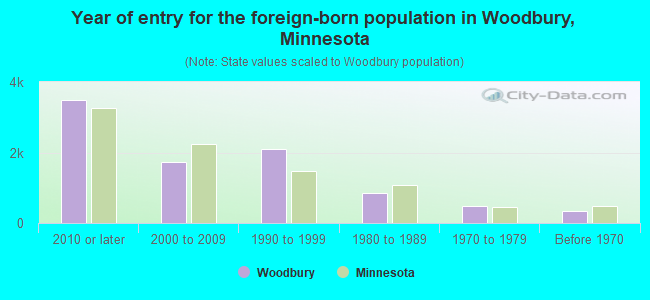
Year of entry for the foreign-born population in Woodbury, Minnesota
3,476 2010 or later 1,729 2000 to 2009 2,109 1990 to 1999 856 1980 to 1989 479 1970 to 1979 348 Before 1970
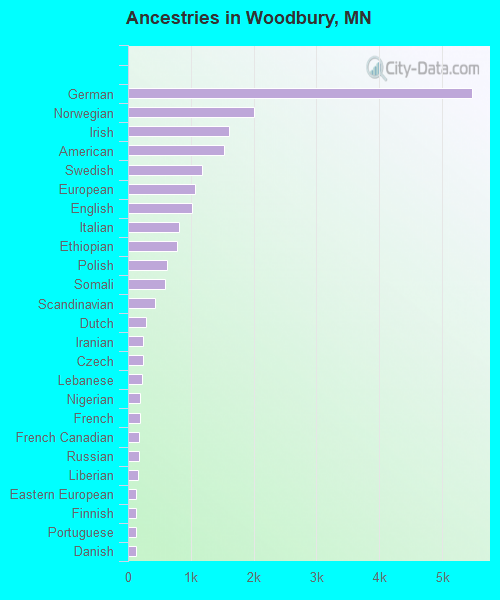
First ancestries reported:
German: 5,472 (17.1%)
Norwegian: 1,999 (6.2%)
Irish: 1,611 (5.0%)
American: 1,521 (4.8%)
Swedish: 1,175 (3.7%)
European: 1,073 (3.4%)
English: 1,014 (3.2%)
Italian: 804 (2.5%)
Ethiopian: 773 (2.4%)
Polish: 614 (1.9%)
Somali: 586 (1.8%)
Scandinavian: 433 (1.4%)
Dutch: 287 (0.9%)
Iranian: 242 (0.8%)
Czech: 241 (0.8%)
Lebanese: 216 (0.7%)
Nigerian: 187 (0.6%)
French: 185 (0.6%)
French Canadian: 177 (0.6%)
Russian: 169 (0.5%)
Liberian: 157 (0.5%)
Eastern European: 131 (0.4%)
Finnish: 128 (0.4%)
Portuguese: 124 (0.4%)
Danish: 122 (0.4%)
Swiss: 121 (0.4%)
Belgian: 114 (0.4%)
African: 86 (0.3%)
Ukrainian: 83 (0.3%)
Romanian: 76 (0.2%)
Bulgarian: 73 (0.2%)
Scottish: 71 (0.2%)
Northern European: 62 (0.2%)
Scotch-Irish: 53 (0.2%)
Welsh: 49 (0.2%)
Croatian: 48 (0.2%)
Palestinian: 45 (0.1%)
Yugoslavian: 38 (0.1%)
Moroccan: 36 (0.1%)
British: 35 (0.1%)
Sudanese: 35 (0.1%)
Canadian: 32 (0.1%)
Lithuanian: 30 (0.09%)
Slovak: 26 (0.08%)
Hungarian: 22 (0.07%)
Albanian: 21 (0.07%)
Austrian: 20 (0.06%)
Turkish: 15 (0.05%)
Macedonian: 10 (0.03%)
Haitian: 10 (0.03%)
Latvian: 9 (0.03%)
South African: 8 (0.03%)
Syrian: 6 (0.02%)
Slovene: 5 (0.02%)
Most common places of birth for foreign-born residents (%): India Woodbury:
20.1% (1,920)Minnesota:
6.7% (32,141)
Mexico Woodbury:
6.9% (659)Minnesota:
12.1% (58,312)
Thailand Woodbury:
5.9% (563)Minnesota:
4.0% (19,333)
Vietnam Woodbury:
5.9% (563)Minnesota:
3.8% (18,442)
Korea Woodbury:
4.8% (454)Minnesota:
2.4% (11,675)
China, excluding Hong Kong and Taiwan Woodbury:
4.1% (387)Minnesota:
3.6% (17,119)
Somalia Woodbury:
3.3% (314)Minnesota:
8.0% (38,461)
Pakistan Woodbury:
2.6% (247)Minnesota:
0.6% (2,729)
Ethiopia Woodbury:
2.5% (235)Minnesota:
5.1% (24,630)
Nigeria Woodbury:
2.1% (205)Minnesota:
1.7% (8,263)
Philippines Woodbury:
1.8% (173)Minnesota:
2.0% (9,850)
Iran Woodbury:
1.8% (172)Minnesota:
0.4% (2,035)
Place of birth for U.S.-born residents:
This state: 41,515Other state: 24,516Northeast: 2,545Midwest: 14,992South: 3,443West: 3,536 86.7% of Woodbury residents lived in the same house 1 years ago.
Out of people who lived in different houses, 26.2% lived in this county.
Out of people who lived in different counties, 79.5% lived in Minnesota.
Woodbury:
86.7%State average:
87.4%
Education attainment for males 25 years and older:
No schooling: 299Nursery to 4th grade: 05th and 6th grade: 07th and 8th grade: 139th grade: 22210th grade: 011th grade: 5612th grade, no diploma: 154High school graduate (or equivalency): 2,987Less than 1 year of college: 823Some college more than 1 year, no degree: 3,274Associate degree: 1,563Bachelor's degree: 9,989Master's degree: 3,802Professional school degree: 414Doctorate degree: 1,692
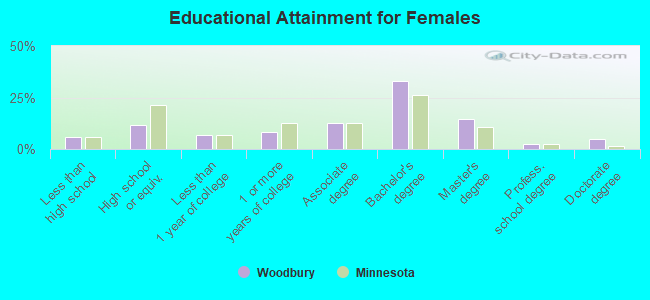
Education attainment for females 25 years and older:
No schooling: 709Nursery to 4th grade: 515th and 6th grade: 517th and 8th grade: 799th grade: 10310th grade: 28911th grade: 6012th grade, no diploma: 210High school graduate (or equivalency): 3,267Less than 1 year of college: 1,844Some college more than 1 year, no degree: 2,342Associate degree: 3,471Bachelor's degree: 9,146Master's degree: 3,972Professional school degree: 713Doctorate degree: 1,371
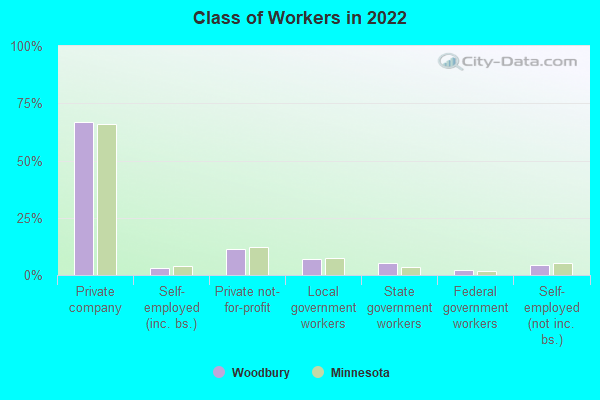
Housing units in structures:
One, detached: 16,585One, attached: 7,319Two: 803 or 4: 1,0895 to 9: 64810 to 19: 75220 to 49: 1,19850 or more: 2,900Housing units lacking complete kitchen facilities in 2022: 0.2%House/condo owner moved in on average 9 years ago
Renter moved in on average 1 years ago
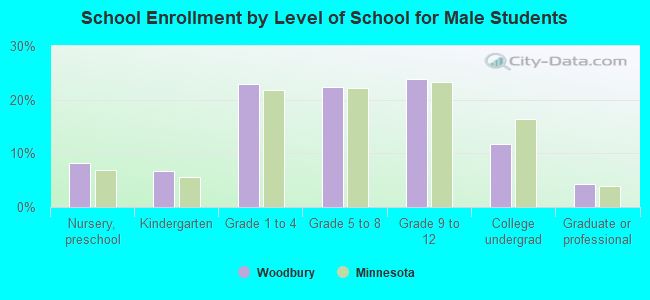
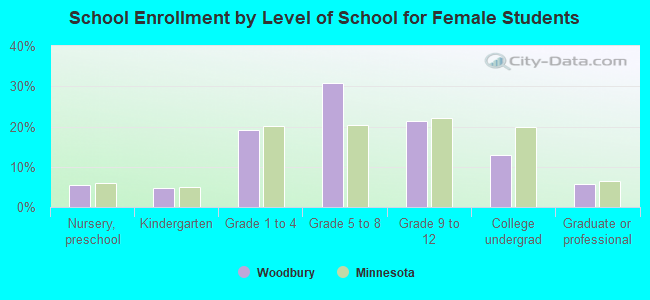
Private vs. public school enrollment:
Students in private schools in grades 1 to 8 (elementary and middle school): 1,490 Here:
15.2%Minnesota:
12.9%
Students in private schools in grades 9 to 12 (high school): 572 Students in private undergraduate colleges: 511 Here:
20.2%Minnesota:
26.2%