Woodbridge, VA (Virginia) Houses and Residents
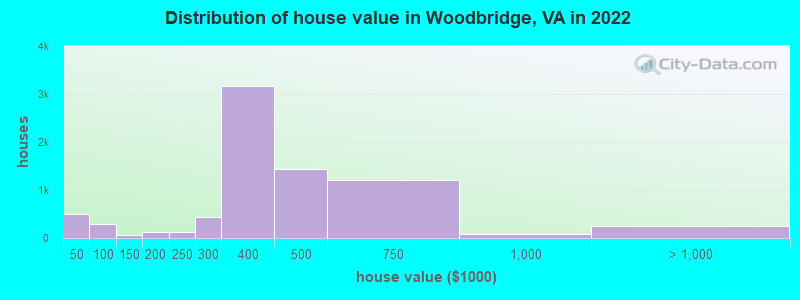
Estimated median house or condo value in 2022: $397,188 (it was $113,800 in 2000 )
Woodbridge:
$397,188Virginia:
$365,700
Lower value quartile - upper value quartile: $324,101 - $488,021Mean price in 2022: Detached houses: $508,112 Here:
$508,112State:
$472,865
Townhouses or other attached units: $522,022 Here:
$522,022State:
$457,437
In 5-or-more-unit structures: $436,889 Here:
$436,889State:
$382,551
Total population: 4,055 (All urban)
Houses: 15,291 (13,950 occupied: 8,419 owner occupied, 5,603 renter occupied )
% of renters here:
40%State:
33%
Housing density: 1,459 houses/condos per square mile
Median price asked for vacant for-sale houses and condos in 2022: $409,742.
Median contract rent in 2022: $1,716 (lower quartile is $1,464, upper quartile is $1,955)
Median rent asked for vacant for-rent units in 2022: $1,762
Median gross rent in Woodbridge, VA in 2022: $1,812
Housing units in Woodbridge with a mortgage: 5,694 (410 second mortgage, 2 home equity loan, 334 both second mortgage and home equity loan )Houses without a mortgage: 127
Median household income for houses/condos with a mortgage: $113,809
Median household income for apartments without a mortgage: $99,897
Median monthly housing costs: $1,756
Data:
Median house or condo value ($)
Median house or condo value ($ change since 2000)
Median house or condo value ($) - White
Median house or condo value ($) - Black or African American
Median house or condo value ($) - Asian
Median house or condo value ($) - Hispanic or Latino
Median house or condo value ($) - American Indian and Alaska Native
Median house or condo value ($) - Multirace
Median house or condo value ($) - Other Race
Median price asked for mobile homes ($)
Household density (households per square mile)
Mean house or condo value by units in structure - 1, detached ($)
Mean house or condo value by units in structure - 1, attached ($)
Mean house or condo value by units in structure - 2 ($)
Mean house or condo value by units in structure by units in structure - 3 or 4 ($)
Mean house or condo value by units in structure - 5 or more ($)
Mean house or condo value by units in structure - Boat, RV, van, etc. ($)
Mean house or condo value by units in structure - Mobile home ($)
Median contract rent ($)
Median contract rent - Lower quartile ($)
Median contract rent - Upper quartile ($)
Median gross rent ($)
Urban houses (%)
Rural houses (%)
Houses occupied (%)
Houses occupied (% change since 2000)
Houses owner occupied (%)
Houses owner occupied (% change since 2000)
Houses renter occupied (%)
Houses renter occupied (% change since 2000)
Vacant housing units - For rent (%)
Vacant housing units - For rent (% change since 2000)
Vacant housing units - For sale only (%)
Vacant housing units - For sale only (% change since 2000)
Vacant housing units - Rented or sold, not occupied (%)
Vacant housing units - Rented or sold, not occupied (% change since 2000)
Vacant housing units - For seasonal, recreational, or occasional use (%)
Vacant housing units - For seasonal, recreational, or occasional use (% change since 2000)
Vacant housing units - For migrant workers (%)
Vacant housing units - For migrant workers (% change since 2000)
Vacant housing units - Other vacant (%)
Vacant housing units - Other vacant (% change since 2000)
Median monthly housing costs ($)
Median household income for houses/condos with a mortgage ($)
Median household income for houses/condos without a mortgage ($)
Median household income ($)
Median household income ($) - White
Median household income ($) - Black or African American
Median household income ($) - Asian
Median household income ($) - Hispanic or Latino
Median household income ($) - American Indian and Alaska Native
Median household income ($) - Multirace
Median household income ($) - Other Race
Mortgage status - with mortgage (%)
Mortgage status - with second mortgage (%)
Mortgage status - with home equity loan (%)
Mortgage status - with both second mortgage and home equity loan (%)
Mortgage status - without a mortgage (%)
Median year house/condo built
Median year apartment built
Household type by relationship - Male householder living alone (%)
Household type by relationship - Male householder not living alone (%)
Household type by relationship - Female householder living alone (%)
Household type by relationship - Female householder not living alone (%)
Household type by relationship - Opposite-Sex spouse (%)
Household type by relationship - Same-Sex spouse (%)
Household type by relationship - Opposite-Sex unmarried partner (%)
Household type by relationship - Same-Sex unmarried partner (%)
Household type by relationship - In group quarters (%)
Size of family households - 2-person household (%)
Size of family households - 3-person household (%)
Size of family households - 4-person household (%)
Size of family households - 5-person household (%)
Size of family households - 6-person household (%)
Size of family households - 7-or-more-person household (%)
Size of nonfamily households - 1-person household (%)
Size of nonfamily households - 2-person household (%)
Size of nonfamily households - 3-person household (%)
Size of nonfamily households - 4-person household (%)
Size of nonfamily households - 5-person household (%)
Size of nonfamily households - 6-person household (%)
Size of nonfamily households - 7-or-moreperson household (%)
Year house built - Built 2010 or later (%)
Year house built - Built 2000 to 2009 (%)
Year house built - Built 1990 to 1999 (%)
Year house built - Built 1980 to 1989 (%)
Year house built - Built 1970 to 1979 (%)
Year house built - Built 1960 to 1969 (%)
Year house built - Built 1950 to 1959 (%)
Year house built - Built 1940 to 1949 (%)
Year house built - Built 1939 or earlier (%)
Median number of rooms in houses and condos
Median number of rooms in apartments
Median number of bedrooms in owner occupied houses
Mean number of bedrooms in owner occupied houses
Median number of bedrooms in renter occupied houses
Mean number of bedrooms in renter occupied houses
Median number of vehichles in owner occupied houses
Mean number of vehichles in owner occupied houses
Median number of vehichles in renter occupied houses
Mean number of vehichles in renter occupied houses
Rooms in owner-occupied houses - 1 room (%)
Rooms in owner-occupied houses - 2 rooms (%)
Rooms in owner-occupied houses - 3 rooms (%)
Rooms in owner-occupied houses - 4 rooms (%)
Rooms in owner-occupied houses - 5 rooms (%)
Rooms in owner-occupied houses - 6 rooms (%)
Rooms in owner-occupied houses - 7 rooms (%)
Rooms in owner-occupied houses - 8 rooms (%)
Rooms in owner-occupied houses - 9+ rooms (%)
Rooms in renter-occupied houses - 1 room (%)
Rooms in renter-occupied houses - 2 rooms (%)
Rooms in renter-occupied houses - 3 rooms (%)
Rooms in renter-occupied houses - 4 rooms (%)
Rooms in renter-occupied houses - 5 rooms (%)
Rooms in renter-occupied houses - 6 rooms (%)
Rooms in renter-occupied houses - 7 rooms (%)
Rooms in renter-occupied houses - 8 rooms (%)
Rooms in renter-occupied houses - 9+ rooms (%)
Bedrooms in owner-occupied houses - no bedrooms (%)
Bedrooms in owner-occupied houses - 1 bedroom (%)
Bedrooms in owner-occupied houses - 2 bedrooms (%)
Bedrooms in owner-occupied houses - 3 bedrooms (%)
Bedrooms in owner-occupied houses - 4 bedrooms (%)
Bedrooms in owner-occupied houses - 5+ bedrooms (%)
Bedrooms in renter-occupied houses - no bedrooms (%)
Bedrooms in renter-occupied houses - 1 bedroom (%)
Bedrooms in renter-occupied houses - 2 bedrooms (%)
Bedrooms in renter-occupied houses - 3 bedrooms (%)
Bedrooms in renter-occupied houses - 4 bedrooms (%)
Bedrooms in renter-occupied houses - 5+ bedrooms (%)
Vehicles available in owner-occupied houses - no vehicle available (%)
Vehicles available in owner-occupied houses - 1 vehicle available(%)
Vehicles available in owner-occupied houses - 2 Vehicles available (%)
Vehicles available in owner-occupied houses - 3 Vehicles available (%)
Vehicles available in owner-occupied houses - 4 Vehicles available (%)
Vehicles available in owner-occupied houses - 5+ Vehicles available (%)
Vehicles available in renter-occupied houses - no vehicle available (%)
Vehicles available in renter-occupied houses - 1 vehicle available (%)
Vehicles available in renter-occupied houses - 2 Vehicles available (%)
Vehicles available in renter-occupied houses - 3 Vehicles available (%)
Vehicles available in renter-occupied houses - 4 Vehicles available (%)
Vehicles available in renter-occupied houses - 5+ Vehicles available (%)
Housing units in structures - 1, detached (%)
Housing units in structures - 1, attached (%)
Housing units in structures - 2 (%)
Housing units in structures - 3 or 4 (%)
Housing units in structures - 5 to 9 (%)
Housing units in structures - 10 to 19 (%)
Housing units in structures - 20 to 49 (%)
Housing units in structures - 50 or more (%)
Housing units in structures - Mobile home (%)
Housing units in structures - Boat, RV, van, etc. (%)
Housing units in structures - Owners - 1, detached (%)
Housing units in structures - Owners - 1, attached (%)
Housing units in structures - Owners - 2 (%)
Housing units in structures - Owners - 3 or 4 (%)
Housing units in structures - Owners - 5 to 9 (%)
Housing units in structures - Owners - 10 to 19 (%)
Housing units in structures - Owners - 20 to 49 (%)
Housing units in structures - Owners - 50 or more (%)
Housing units in structures - Owners - Mobile home (%)
Housing units in structures - Owners - Boat, RV, van, etc. (%)
Housing units in structures - Renters - 1, detached (%)
Housing units in structures - Renters - 1, attached (%)
Housing units in structures - Renters - 2 (%)
Housing units in structures - Renters - 3 or 4 (%)
Housing units in structures - Renters - 5 to 9 (%)
Housing units in structures - Renters - 10 to 19 (%)
Housing units in structures - Renters - 20 to 49 (%)
Housing units in structures - Renters - 50 or more (%)
Housing units in structures - Renters - Mobile home (%)
Housing units in structures - Renters - Boat, RV, van, etc. (%)
House/condo owner moved in on average (years ago)
Renter moved in on average (years ago)
Year householder moved into unit - Moved in 1999 to March 2000 (%)
Year householder moved into unit - Moved in 1999 to March 2000 (%) - White
Year householder moved into unit - Moved in 1999 to March 2000 (%) - Black or African American
Year householder moved into unit - Moved in 1999 to March 2000 (%) - Asian
Year householder moved into unit - Moved in 1999 to March 2000 (%) - Hispanic or Latino
Year householder moved into unit - Moved in 1999 to March 2000 (%) - American Indian and Alaska Native
Year householder moved into unit - Moved in 1999 to March 2000 (%) - Multirace
Year householder moved into unit - Moved in 1999 to March 2000 (%) - Other Race
Year householder moved into unit - Moved in 1995 to 1998 (%)
Year householder moved into unit - Moved in 1995 to 1998 (%) - White
Year householder moved into unit - Moved in 1995 to 1998 (%) - Black or African American
Year householder moved into unit - Moved in 1995 to 1998 (%) - Asian
Year householder moved into unit - Moved in 1995 to 1998 (%) - Hispanic or Latino
Year householder moved into unit - Moved in 1995 to 1998 (%) - American Indian and Alaska Native
Year householder moved into unit - Moved in 1995 to 1998 (%) - Multirace
Year householder moved into unit - Moved in 1995 to 1998 (%) - Other Race
Year householder moved into unit - Moved in 1990 to 1994 (%)
Year householder moved into unit - Moved in 1990 to 1994 (%) - White
Year householder moved into unit - Moved in 1990 to 1994 (%) - Black or African American
Year householder moved into unit - Moved in 1990 to 1994 (%) - Asian
Year householder moved into unit - Moved in 1990 to 1994 (%) - Hispanic or Latino
Year householder moved into unit - Moved in 1990 to 1994 (%) - American Indian and Alaska Native
Year householder moved into unit - Moved in 1990 to 1994 (%) - Multirace
Year householder moved into unit - Moved in 1990 to 1994 (%) - Other Race
Year householder moved into unit - Moved in 1980 to 1989 (%)
Year householder moved into unit - Moved in 1980 to 1989 (%) - White
Year householder moved into unit - Moved in 1980 to 1989 (%) - Black or African American
Year householder moved into unit - Moved in 1980 to 1989 (%) - Asian
Year householder moved into unit - Moved in 1980 to 1989 (%) - Hispanic or Latino
Year householder moved into unit - Moved in 1980 to 1989 (%) - American Indian and Alaska Native
Year householder moved into unit - Moved in 1980 to 1989 (%) - Multirace
Year householder moved into unit - Moved in 1980 to 1989 (%) - Other Race
Year householder moved into unit - Moved in 1970 to 1979 (%)
Year householder moved into unit - Moved in 1970 to 1979 (%) - White
Year householder moved into unit - Moved in 1970 to 1979 (%) - Black or African American
Year householder moved into unit - Moved in 1970 to 1979 (%) - Asian
Year householder moved into unit - Moved in 1970 to 1979 (%) - Hispanic or Latino
Year householder moved into unit - Moved in 1970 to 1979 (%) - American Indian and Alaska Native
Year householder moved into unit - Moved in 1970 to 1979 (%) - Multirace
Year householder moved into unit - Moved in 1970 to 1979 (%) - Other Race
Year householder moved into unit - Moved in 1969 or earlier (%)
Year householder moved into unit - Moved in 1969 or earlier (%) - White
Year householder moved into unit - Moved in 1969 or earlier (%) - Black or African American
Year householder moved into unit - Moved in 1969 or earlier (%) - Asian
Year householder moved into unit - Moved in 1969 or earlier (%) - Hispanic or Latino
Year householder moved into unit - Moved in 1969 or earlier (%) - American Indian and Alaska Native
Year householder moved into unit - Moved in 1969 or earlier (%) - Multirace
Year householder moved into unit - Moved in 1969 or earlier (%) - Other Race
Housing units lacking complete plumbing facilities (%)
Housing units lacking complete kitchen facilities (%)
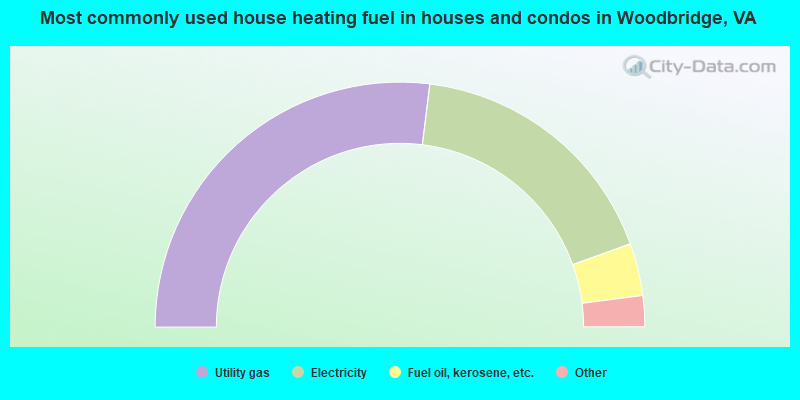
House heating fuel used in houses and condos - Utility gas (%)
House heating fuel used in houses and condos - Bottled, tank, or LP gas (%)
House heating fuel used in houses and condos - Electricity (%)
House heating fuel used in houses and condos - Fuel oil, kerosene, etc. (%)
House heating fuel used in houses and condos - Coal or coke (%)
House heating fuel used in houses and condos - Wood (%)
House heating fuel used in houses and condos - Solar energy (%)
House heating fuel used in houses and condos - Other fuel (%)
House heating fuel used in houses and condos - No fuel used (%)
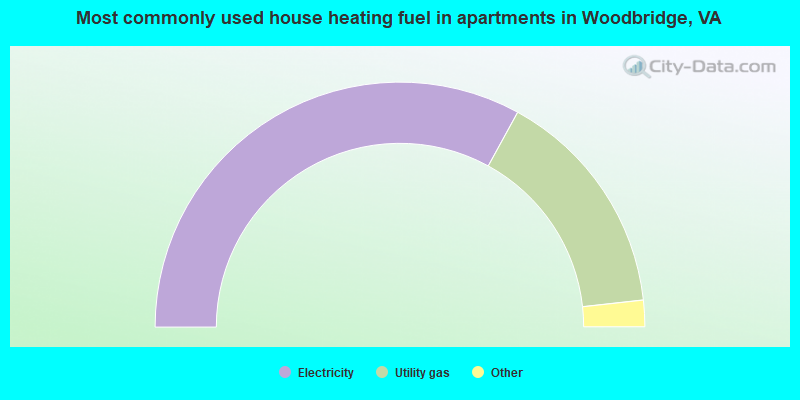
House heating fuel used in apartments - Utility gas (%)
House heating fuel used in apartments - Bottled, tank, or LP gas (%)
House heating fuel used in apartments - Electricity (%)
House heating fuel used in apartments - Fuel oil, kerosene, etc. (%)
House heating fuel used in apartments - Coal or coke (%)
House heating fuel used in apartments - Wood (%)
House heating fuel used in apartments - Solar energy (%)
House heating fuel used in apartments - Other fuel (%)
House heating fuel used in apartments - No fuel used (%)
Latest news about housing in Woodbridge, VA collected exclusively by city-data.com from local newspapers, TV, and radio stations
Median year house/condo built: 1974Median year apartment built: 1998Household type by relationship:
Households: 43,135
Male householders: 7,665 (1,577 living alone ), Female householders: 6,154 (1,765 living alone )6,042 spouses (5,985 opposite-sex spouses ), 707 unmarried partners , (707 opposite-sex unmarried partners ), 13,817 children (12,542 natural , 47 adopted , 1,227 stepchildren ), 1,412 grandchildren , 1,187 brothers or sisters , 1,113 parents , 0 foster children , 2,526 other relatives , 2,469 non-relatives In group quarters: 38
Size of family households: 2,780 2-persons , 2,046 3-persons , 1,948 4-persons , 1,723 5-persons , 770 6-persons , 366 7-or-more-persons .
Size of nonfamily households: 3,531 1-person , 719 2-persons , 50 3-persons , 31 4-persons , 156 5-persons .
4,822 married couples with children. single-parent households (1,376 men , 1,982 women ).
47.8% of residents of Woodbridge speak English at home. of residents speak Spanish at home (50% speak English very well , 28% speak English well , 19% speak English not well , 2% don't speak English at all ).of residents speak other Indo-European language at home (63% speak English very well , 25% speak English well , 9% speak English not well , 3% don't speak English at all ).of residents speak Asian or Pacific Island language at home (75% speak English very well , 14% speak English well , 10% speak English not well , 1% don't speak English at all ).of residents speak other language at home (68% speak English very well , 31% speak English well , 1% speak English not well ).
Foreign born population: 15,859 (36.8%)of them are naturalized citizens )
Median number of rooms in houses and condos:
Median number of rooms in apartments
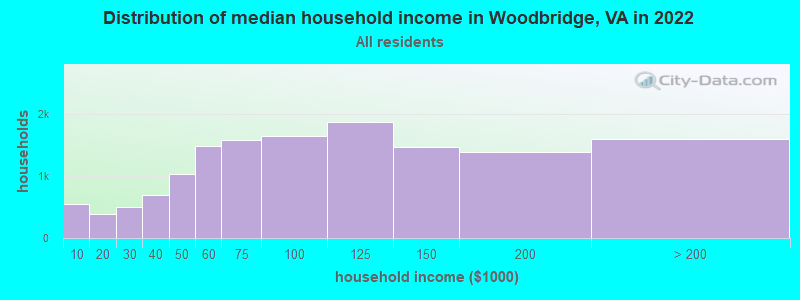
Woodbridge, VA household income distribution 540 Less than $10,000391 $10,000 to $19,999501 $20,000 to $29,999688 $30,000 to $39,9991,026 $40,000 to $49,9991,475 $50,000 to $59,9991,580 $60,000 to $74,9991,641 $75,000 to $99,9991,867 $100,000 to $124,9991,465 $125,000 to $149,9991,384 $150,000 to $199,9991,591 $200,000 or more
Home value of owner - occupied houses in 2022 in Woodbridge, VA 258 Less than $10,00066 $25,000 to $29,99933 $30,000 to $34,99919 $35,000 to $39,999119 $40,000 to $49,999164 $50,000 to $59,99956 $100,000 to $124,9995 $125,000 to $149,99948 $150,000 to $174,99981 $175,000 to $199,999135 $200,000 to $249,999434 $250,000 to $299,9993,177 $300,000 to $399,9991,436 $400,000 to $499,9991,209 $500,000 to $749,99981 $750,000 to $999,99969 $1,000,000 to $1,499,999172 $2,000,000 or moreRent paid by renters in 2022 in Woodbridge, VA 10 $150 to $1998 $300 to $34951 $400 to $44927 $500 to $54929 $600 to $64943 $750 to $799119 $1,000 to $1,249916 $1,250 to $1,4993,351 $1,500 to $1,999837 $2,000 to $2,499186 $2,500 to $2,99923 $3,000 to $3,499131 No cash rent
Percentage of workers working in this county: 48.6%Number of people working at home: 3,534 (15.1% of all workers )
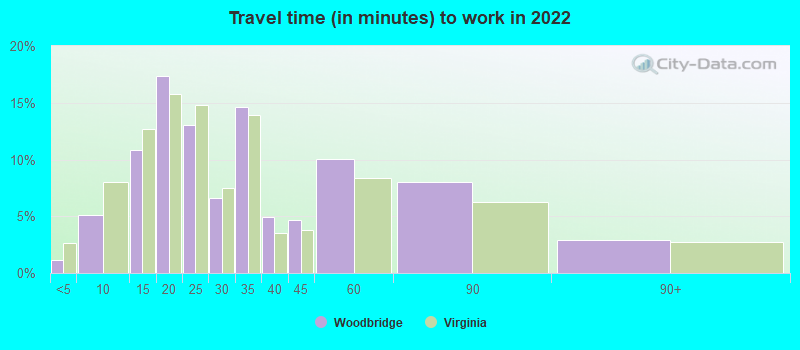
Travel time to work (commute)
Less than 5 minutes: 1555 to 9 minutes: 71510 to 14 minutes: 1,60115 to 19 minutes: 2,76820 to 24 minutes: 1,26225 to 29 minutes: 57030 to 34 minutes: 3,74635 to 39 minutes: 1,05540 to 44 minutes: 1,20545 to 59 minutes: 3,31260 to 89 minutes: 2,55790 or more minutes: 538
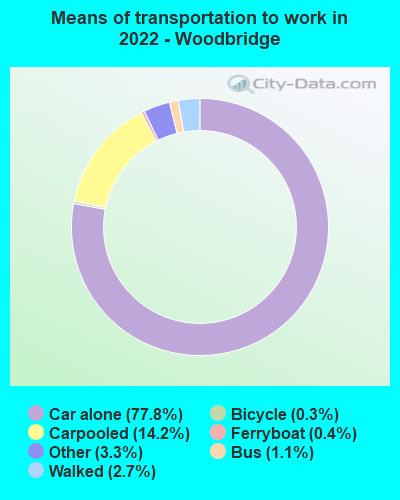
Means of transportation to work:
Drove a car alone: 10,477 (60.2%)Carpooled: 1,906 (10.9%)Bus : 94 (0.5%)Subway or elevated rail : 13 (0.1%)Long-distance train or commuter rail : 15 (0.1%)Ferryboat: 48 (0.3%)Taxi: 638 (3.7%)Bicycle: 35 (0.2%)Walked: 348 (2.0%)Worked at home: 3,534 (20.3%)
Unemployment by race in 2022
Unemployment rate for White non-Hispanic residents 5.0% Males1.6% FemalesUnemployment rate for Black residents 4.9% Males4.1% FemalesUnemployment rate for Asian residents 2.8% Males1.2% FemalesUnemployment rate for other race residents 8.5% Males13.6% FemalesUnemployment rate for two or more race residents 6.7% Males2.2% FemalesUnemployment rate for Hispanic or Latino residents 7.9% Males9.9% Females
Year of entry for the foreign-born population in Woodbridge, Virginia
4,623 2010 or later 5,882 2000 to 2009 2,566 1990 to 1999 2,078 1980 to 1989 664 1970 to 1979 395 Before 1970
First ancestries reported:
Ethiopian: 1,679 (6.5%)
Ghanaian: 1,131 (4.4%)
Afghan: 795 (3.1%)
American: 650 (2.5%)
German: 458 (1.8%)
Polish: 292 (1.1%)
English: 291 (1.1%)
Ugandan: 284 (1.1%)
Sierra Leonean: 281 (1.1%)
Italian: 278 (1.1%)
African: 231 (0.9%)
Irish: 222 (0.9%)
Liberian: 129 (0.5%)
Northern European: 110 (0.4%)
Jamaican: 108 (0.4%)
Ukrainian: 105 (0.4%)
Scottish: 87 (0.3%)
Haitian: 71 (0.3%)
Scotch-Irish: 64 (0.2%)
Egyptian: 60 (0.2%)
Lebanese: 44 (0.2%)
European: 38 (0.1%)
French Canadian: 37 (0.1%)
Moroccan: 29 (0.1%)
Iraqi: 28 (0.1%)
Greek: 28 (0.1%)
Czech: 24 (0.09%)
Norwegian: 22 (0.09%)
Swedish: 21 (0.08%)
Russian: 21 (0.08%)
Scandinavian: 20 (0.08%)
French: 17 (0.07%)
Welsh: 17 (0.07%)
Iranian: 10 (0.04%)
Lithuanian: 9 (0.03%)
West Indian: 9 (0.03%)
Portuguese: 8 (0.03%)
Arab: 6 (0.02%)
Brazilian: 5 (0.02%)
Dutch: 5 (0.02%)
British: 3 (0.01%)
Canadian: 2 (0.01%) Most common places of birth for foreign-born residents (%): El Salvador Woodbridge:
28.6% (4,699)Virginia:
9.9% (107,534)
Ethiopia Woodbridge:
9.0% (1,484)Virginia:
2.9% (32,082)
Honduras Woodbridge:
7.6% (1,248)Virginia:
3.0% (32,892)
Ghana Woodbridge:
7.2% (1,188)Virginia:
1.6% (17,346)
Afghanistan Woodbridge:
4.5% (746)Virginia:
1.8% (19,426)
Mexico Woodbridge:
3.4% (563)Virginia:
5.3% (57,498)
Bangladesh Woodbridge:
3.4% (562)Virginia:
1.1% (12,049)
Korea Woodbridge:
3.2% (518)Virginia:
4.9% (52,857)
Philippines Woodbridge:
3.1% (517)Virginia:
4.8% (52,629)
Nicaragua Woodbridge:
2.7% (447)Virginia:
0.6% (6,916)
Guatemala Woodbridge:
2.7% (436)Virginia:
3.3% (35,938)
Peru Woodbridge:
2.3% (382)Virginia:
2.4% (26,366)
India Woodbridge:
2.0% (331)Virginia:
9.0% (97,830)
Sierra Leone Woodbridge:
1.7% (285)Virginia:
0.6% (6,458)
Pakistan Woodbridge:
1.6% (266)Virginia:
2.3% (24,582)
Place of birth for U.S.-born residents:
This state: 15,304Other state: 10,678Northeast: 2,873Midwest: 1,267South: 4,984West: 1,465 85.8% of Woodbridge residents lived in the same house 1 years ago.
Out of people who lived in different houses, 27.4% lived in this county.
Out of people who lived in different counties, 62.3% lived in Virginia.
Woodbridge:
85.8%State average:
86.6%
Education attainment for males 25 years and older:
No schooling: 637Nursery to 4th grade: 1505th and 6th grade: 2537th and 8th grade: 2759th grade: 20810th grade: 18211th grade: 13712th grade, no diploma: 438High school graduate (or equivalency): 4,210Less than 1 year of college: 1,199Some college more than 1 year, no degree: 1,640Associate degree: 786Bachelor's degree: 2,398Master's degree: 1,163Professional school degree: 144Doctorate degree: 224
Education attainment for females 25 years and older:
No schooling: 1,051Nursery to 4th grade: 725th and 6th grade: 487th and 8th grade: 1779th grade: 5810th grade: 5911th grade: 4712th grade, no diploma: 310High school graduate (or equivalency): 4,120Less than 1 year of college: 638Some college more than 1 year, no degree: 1,385Associate degree: 793Bachelor's degree: 3,223Master's degree: 1,491Professional school degree: 162Doctorate degree: 54
Housing units in structures:
One, detached: 5,719One, attached: 2,875Two: 1273 or 4: 2225 to 9: 1,09510 to 19: 2,67320 to 49: 66350 or more: 1,500Mobile homes: 412Median worth of mobile homes: $51,863
Housing units lacking complete plumbing facilities in 2022: 0.1%Housing units lacking complete kitchen facilities in 2022: 0.3%House/condo owner moved in on average 11 years ago
Renter moved in on average 1 years ago
Private vs. public school enrollment:
Students in private schools in grades 1 to 8 (elementary and middle school): 135 Students in private schools in grades 9 to 12 (high school): 81 Students in private undergraduate colleges: 503