Wolcott, CT (Connecticut) Houses and Residents
| Wolcott: | $310,232 |
| Connecticut: | $347,200 |
Total population: 16,680 (Urban population: 13,720, Rural population: 1,495 (all nonfarm))
Houses: 5,544 (5,414 occupied: 4,768 owner occupied, 646 renter occupied)
| % of renters here: | 12% |
| State: | 34% |
Housing density: 271 houses/condos per square mile
Median price asked for vacant for-sale houses and condos in 2022 in this county: $371,867.
Median contract rent in 2022: $1,284 (lower quartile is $760, upper quartile is $1,840)
Median rent asked for vacant for-rent units in 2022: $1,065
Median gross rent in Wolcott, CT in 2022: $1,467
Housing units in Wolcott with a mortgage: 3,299 (382 second mortgage, 494 home equity loan, 0 both second mortgage and home equity loan)
Houses without a mortgage: 1,150
Compare current foreclosures near Wolcott, CT:
| Photo | Address | Area | Beds / Baths | Price | Details |
|---|---|---|---|---|---|

|
#1
Clinton Hill Rd
Wolcott, CT 06716
|
1,828 sq. feet
|
1 baths 3 beds |
$240,000
|
show details |

|
#2
August Ave
Wolcott, CT 06716
|
1,891 sq. feet
|
1 baths 3 beds |
show details | |

|
#3
Cedar Ln
Wolcott, CT 06716
|
1,876 sq. feet
|
1 baths 3 beds |
show details | |

|
#4
East St
Wolcott, CT 06716
|
1,128 sq. feet
|
2 baths 3 beds |
show details | |

|
#5
Wilson Rd
Wolcott, CT 06716
|
1,116 sq. feet
|
1 baths 3 beds |
show details | |

|
#6
Todd Hollow Rd
Wolcott, CT 06716
|
2,520 sq. feet
|
1 baths 4 beds |
show details | |

|
#7
Woodtick Rd
Wolcott, CT 06716
|
1,880 sq. feet
|
2 baths 3 beds |
show details | |

|
#8
Kingswood Ln
Wolcott, CT 06716
|
1,544 sq. feet
|
1 baths 3 beds |
show details | |

|
#9
Porter Rd
Wolcott, CT 06716
|
2,243 sq. feet
|
2 baths 2 beds |
show details | |

|
#10
Grilley Rd
Wolcott, CT 06716
|
3,925 sq. feet
|
3 baths 4 beds |
show details |
| Photo | Address | Area | Beds / Baths | Price | Details |
|---|---|---|---|---|---|

|
#11
Richard Ave
Wolcott, CT 06716
|
1,800 sq. feet
|
1 baths 3 beds |
show details | |

|
#12
Meadowbrook Ln
Wolcott, CT 06716
|
1,728 sq. feet
|
1 baths 4 beds |
show details | |

|
#13
Harrison Dr
Wolcott, CT 06716
|
- sq. feet
|
- baths - beds |
show details | |

|
#14
Woodcrest Ave
Wolcott, CT 06716
|
- sq. feet
|
- baths - beds |
show details | |

|
#15
Park Ave # 4-2
Wolcott, CT 06716
|
- sq. feet
|
- baths - beds |
show details | |

|
#16
Seymour Rd
New Haven, CT 06525
|
1,639 sq. feet
|
2 baths 3 beds |
$312,000
|
show details |

|
#17
Willis Ave
Meriden, CT 06450
|
1,008 sq. feet
|
1 baths 2 beds |
$299,900
|
show details |

|
#18
Birchwood Dr
Hamden, CT 06518
|
2,604 sq. feet
|
2 baths 3 beds |
$614,900
|
show details |

|
#19
Peck St
Berlin, CT 06037
|
608 sq. feet
|
1 baths 1 beds |
$144,900
|
show details |

|
#20
Roosevelt St
New Britain, CT 06051
|
1,536 sq. feet
|
2 baths 3 beds |
$299,900
|
show details |
| Photo | Address | Area | Beds / Baths | Price | Details |
|---|---|---|---|---|---|

|
#21
Allen St
Bristol, CT 06010
|
1,092 sq. feet
|
1 baths 3 beds |
$215,000
|
show details |

|
#22
Woodbine St
Torrington, CT 06790
|
2,756 sq. feet
|
3 baths 6 beds |
$419,900
|
show details |

|
#23
Chestnut St
Naugatuck, CT 06770
|
1,012 sq. feet
|
1 baths 2 beds |
$279,900
|
show details |

|
#24
N Star Dr
Seymour, CT 06483
|
1,670 sq. feet
|
2 baths 3 beds |
$424,900
|
show details |

|
#25
Winthrop Blvd
Cromwell, CT 06416
|
1,092 sq. feet
|
1 baths 3 beds |
$220,000
|
show details |

|
#26
Amity Rd
Woodbridge, CT 06525
|
1,850 sq. feet
|
1 baths 3 beds |
$549,900
|
show details |

|
#27
Dowd Ave
Canton, CT 06019
|
1,190 sq. feet
|
1 baths 2 beds |
$239,900
|
show details |

|
#28
Janwood Rd
Waterbury, CT 06708
|
1,200 sq. feet
|
2 baths 3 beds |
$275,000
|
show details |

|
#29
Fairfield Ave
Waterbury, CT 06708
|
1,538 sq. feet
|
1 baths 2 beds |
show details | |

|
#30
Clairmont Ave
Waterbury, CT 06708
|
1,564 sq. feet
|
2 baths 4 beds |
show details |
| Photo | Address | Area | Beds / Baths | Price | Details |
|---|---|---|---|---|---|

|
#31
Pratt St
Meriden, CT 06450
|
1,040 sq. feet
|
2 baths 3 beds |
show details | |

|
#32
Sylvan Ave
Terryville, CT 06786
|
1,691 sq. feet
|
1 baths 4 beds |
show details | |

|
#33
Fawn Dr
Meriden, CT 06451
|
1,766 sq. feet
|
2 baths 4 beds |
show details | |

|
#34
W Main St
New Britain, CT 06053
|
1,584 sq. feet
|
2 baths 4 beds |
show details | |

|
#35
Hidden Valley Dr
Meriden, CT 06451
|
2,264 sq. feet
|
2 baths 4 beds |
show details | |

|
#36
Robin Ln
Cheshire, CT 06410
|
1,641 sq. feet
|
2 baths 3 beds |
show details | |

|
#37
Spring St
Meriden, CT 06451
|
660 sq. feet
|
1 baths 3 beds |
show details | |

|
#38
Old Fairwood Rd
Bethany, CT 06524
|
2,464 sq. feet
|
3 baths 4 beds |
show details | |

|
#39
New Haven Rd Apt 6-E
Naugatuck, CT 06770
|
1,008 sq. feet
|
1 baths 2 beds |
show details | |

|
#40
Farmington Chase Cre
Farmington, CT 06032
|
1,317 sq. feet
|
1 baths 2 beds |
show details |
| Photo | Address | Area | Beds / Baths | Price | Details |
|---|---|---|---|---|---|

|
#41
Maple Hill Rd
Naugatuck, CT 06770
|
1,600 sq. feet
|
2 baths 3 beds |
show details | |

|
#42
Surrey Dr
Bristol, CT 06010
|
1,079 sq. feet
|
1 baths 3 beds |
show details | |

|
#43
Fawn Meadow Dr
Naugatuck, CT 06770
|
3,052 sq. feet
|
3 baths 4 beds |
show details | |

|
#44
Spring St
Naugatuck, CT 06770
|
1,216 sq. feet
|
1 baths 3 beds |
show details | |

|
#45
Vanderbilt Rd
Bristol, CT 06010
|
1,803 sq. feet
|
1 baths 5 beds |
show details | |

|
#46
Evansville Ave
Meriden, CT 06451
|
624 sq. feet
|
1 baths 3 beds |
show details | |

|
#47
Russell Rd
Bethany, CT 06524
|
3,787 sq. feet
|
3 baths 5 beds |
show details | |

|
#48
Amity St
Meriden, CT 06450
|
1,568 sq. feet
|
2 baths 3 beds |
show details | |

|
#49
Governors Hill Rd
Oxford, CT 06478
|
2,106 sq. feet
|
2 baths 3 beds |
show details | |

|
Check over 1 million property listings on Foreclosure.com!
|
browse all offers | |||
Latest news about housing in Wolcott, CT collected exclusively by city-data.com from local newspapers, TV, and radio stations


Household type by relationship:
Households: 833,279- In family households: 686,398 (135,155 male householders, 80,594 female householders)
152,067 spouses, 248,015 children (234,078 natural, 5,289 adopted, 8,648 stepchildren), 16,153 grandchildren, 8,819 brothers or sisters, 9,694 parents, foster children, 10,947 other relatives, 19,201 non-relatives
- In nonfamily households: 146,881 (52,812 male householders (40,674 living alone)), 65,941 female householders (55,844 living alone)), 28,128 nonrelatives
- In group quarters: 29,198 (10,313 institutionalized population)
129,243 married couples with children.
54,016 single-parent households (8,416 men, 45,600 women).
90.2% of residents of Wolcott speak English at home.
1.8% of residents speak Spanish at home (65% speak English very well, 31% speak English well, 4% speak English not well).
6.5% of residents speak other Indo-European language at home (76% speak English very well, 14% speak English well, 9% speak English not well, 1% don't speak English at all).
0.5% of residents speak Asian or Pacific Island language at home (91% speak English very well, 9% speak English well).
1.0% of residents speak other language at home (93% speak English very well, 7% speak English well).
Foreign born population: 1,334 (8.3%)
(80.9% of them are naturalized citizens)
| Here: | 6.5 |
| State: | 6.5 |
| Here: | 4.1 |
| State: | 4.0 |

- Bedrooms in owner-occupied houses and condos in Wolcott, Connecticut
- 0no bedroom
- 951 bedroom
- 8342 bedrooms
- 3,0323 bedrooms
- 7114 bedrooms
- 965+ bedrooms
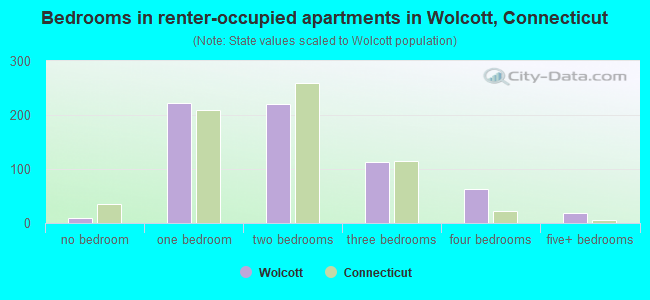
- Bedrooms in renter-occupied apartments in Wolcott, Connecticut
- 9no bedroom
- 2221 bedroom
- 2212 bedrooms
- 1133 bedrooms
- 634 bedrooms
- 185+ bedrooms

- Cars and other vehicles available in Wolcott in owner-occupied houses/condos
- 175no vehicle
- 1,0921 vehicle
- 2,2862 vehicles
- 8813 vehicles
- 2294 vehicles
- 1055+ vehicles

- Cars and other vehicles available in Wolcott in renter-occupied apartments
- 77no vehicle
- 3851 vehicle
- 1562 vehicles
- 283 vehicles
- 04 vehicles
- 05+ vehicles

- Rooms in owner-occupied houses in Wolcott, Connecticut
- 01 room
- 82 rooms
- 353 rooms
- 2974 rooms
- 1,2765 rooms
- 1,2396 rooms
- 1,0767 rooms
- 4938 rooms
- 3449+ rooms

- Rooms in renter-occupied apartments in Wolcott, Connecticut
- 91 room
- 382 rooms
- 1933 rooms
- 1644 rooms
- 925 rooms
- 606 rooms
- 237 rooms
- 618 rooms
- 69+ rooms


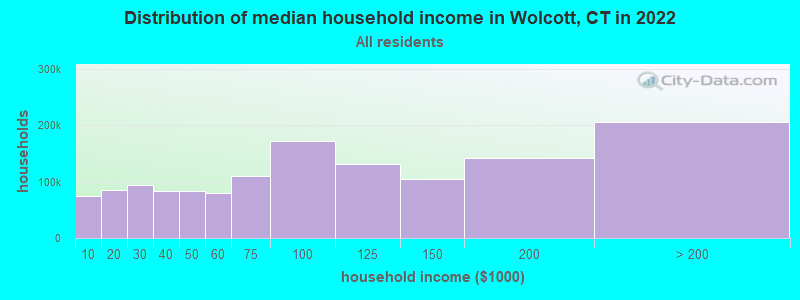
Wolcott, CT household income distribution

- 73,333Less than $10,000
- 83,902$10,000 to $19,999
- 93,630$20,000 to $29,999
- 82,122$30,000 to $39,999
- 82,747$40,000 to $49,999
- 79,967$50,000 to $59,999
- 108,763$60,000 to $74,999
- 171,255$75,000 to $99,999
- 130,311$100,000 to $124,999
- 103,943$125,000 to $149,999
- 141,240$150,000 to $199,999
- 204,448$200,000 or more
Percentage of workers working in this county: 63.2%
Number of people working at home: 1,365 (15.7% of all workers)
Travel time to work (commute)
- Less than 5 minutes: 261
- 5 to 9 minutes: 706
- 10 to 14 minutes: 1,317
- 15 to 19 minutes: 1,330
- 20 to 24 minutes: 1,186
- 25 to 29 minutes: 514
- 30 to 34 minutes: 852
- 35 to 39 minutes: 198
- 40 to 44 minutes: 409
- 45 to 59 minutes: 532
- 60 to 89 minutes: 232
- 90 or more minutes: 136
Means of transportation to work:
- Drove a car alone: 7,009 (89.6%)
- Carpooled: 559 (7.1%)
- Bus or trolley bus: 12 (0.2%)
- Walked: 88 (1.1%)
- Other means: 5 (0.1%)
- Worked at home: 147 (1.9%)


- Year of entry for the foreign-born population in Wolcott, Connecticut
- 741995 to March 2000
- 561990 to 1994
- 491985 to 1989
- 761980 to 1984
- 1071975 to 1979
- 1381970 to 1974
- 941965 to 1969
- 272Before 1965

First ancestries reported:
- Italian: 5,804 (28.9%)
- Irish: 3,171 (15.8%)
- French: 2,172 (10.8%)
- German: 1,628 (8.1%)
- Polish: 1,447 (7.2%)
- English: 1,291 (6.4%)
- Other: 1,062 (5.3%)
- French Canadian: 912 (4.5%)
- Lithuanian: 328 (1.6%)
- Russian: 301 (1.5%)
- United States: 297 (1.5%)
- Scottish: 256 (1.3%)
- Swedish: 249 (1.2%)
- Portuguese: 237 (1.2%)
- Hungarian: 217 (1.1%)
- Arab: 169 (0.8%)
- Scotch-Irish: 136 (0.7%)
- Dutch: 118 (0.6%)
- Danish: 81 (0.4%)
- Welsh: 58 (0.3%)
- Ukrainian: 32 (0.2%)
- Subsaharan African: 30 (0.1%)
- Czech: 26 (0.1%)
- Norwegian: 20 (0.10%)
- Greek: 11 (0.05%)
- Swiss: 9 (0.04%)
- West Indian: 7 (0.03%)
- Slovak: 6 (0.03%)
Most common places of birth for foreign-born residents (%):
| Wolcott: | 20.1% (174) |
| Connecticut: | 7.0% (26,023) |
| Wolcott: | 14.4% (125) |
| Connecticut: | 5.2% (19,083) |
| Wolcott: | 8.7% (75) |
| Connecticut: | 0.6% (2,371) |
| Wolcott: | 6.7% (58) |
| Connecticut: | 4.4% (16,395) |
| Wolcott: | 5.0% (43) |
| Connecticut: | 3.6% (13,234) |
| Wolcott: | 4.5% (39) |
| Connecticut: | 1.5% (5,508) |
| Wolcott: | 4.2% (36) |
| Connecticut: | 0.7% (2,465) |
| Wolcott: | 3.7% (32) |
| Connecticut: | 3.1% (11,432) |
| Wolcott: | 3.6% (31) |
| Connecticut: | 0.9% (3,317) |
| Wolcott: | 3.1% (27) |
| Connecticut: | 0.7% (2,646) |
| Wolcott: | 3.1% (27) |
| Connecticut: | 6.9% (25,507) |
| Wolcott: | 1.8% (16) |
| Connecticut: | 0.1% (356) |
| Wolcott: | 1.7% (15) |
| Connecticut: | 0.5% (1,983) |
| Wolcott: | 1.7% (15) |
| Connecticut: | 2.1% (7,596) |
| Wolcott: | 1.7% (15) |
| Connecticut: | 2.5% (9,358) |
| Wolcott: | 1.7% (15) |
| Connecticut: | 0.9% (3,472) |
| Wolcott: | 1.5% (13) |
| Connecticut: | 0.3% (1,224) |
Place of birth for U.S.-born residents:
- This state: 12,371
- Other state: 1,942
- Northeast: 1,544
- Midwest: 151
- South: 158
- West: 89
68% of Wolcott residents lived in the same house 5 years ago.
Out of people who lived in different houses, 82% lived in this county.
Out of people who lived in different counties, 72% lived in Connecticut.
Education attainment for males 25 years and older:
- No schooling: 39
- Nursery to 4th grade: 12
- 5th and 6th grade: 15
- 7th and 8th grade: 124
- 9th grade: 114
- 10th grade: 127
- 11th grade: 96
- 12th grade, no diploma: 119
- High school graduate (or equivalency): 1,952
- Less than 1 year of college: 384
- Some college more than 1 year, no degree: 699
- Associate degree: 383
- Bachelor's degree: 581
- Master's degree: 174
- Professional school degree: 67
- Doctorate degree: 39

Education attainment for females 25 years and older:
- No schooling: 43
- Nursery to 4th grade: 5
- 5th and 6th grade: 23
- 7th and 8th grade: 131
- 9th grade: 99
- 10th grade: 169
- 11th grade: 79
- 12th grade, no diploma: 72
- High school graduate (or equivalency): 1,957
- Less than 1 year of college: 383
- Some college more than 1 year, no degree: 730
- Associate degree: 594
- Bachelor's degree: 664
- Master's degree: 383
- Professional school degree: 93
- Doctorate degree: 0


Housing units in structures:
- One, detached: 4,861
- One, attached: 110
- Two: 157
- 3 or 4: 96
- 5 to 9: 213
- 10 to 19: 48
- 20 to 49: 51
- Mobile homes: 8
Median worth of mobile homes: $351,105
Housing units lacking complete kitchen facilities: 0.2%

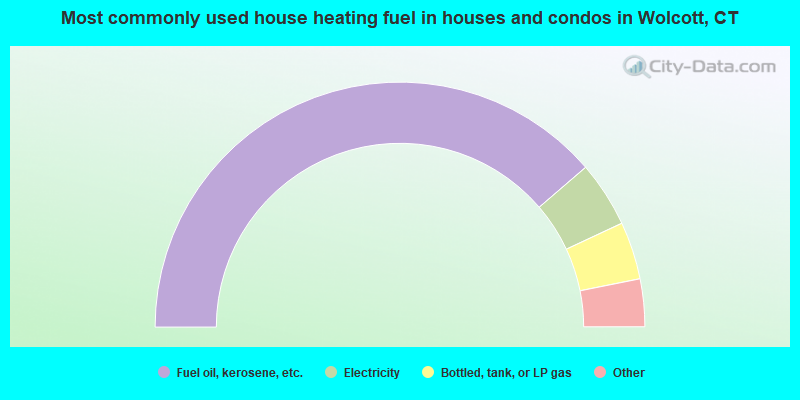
- 77.4%Fuel oil, kerosene, etc.
- 8.7%Electricity
- 7.6%Bottled, tank, or LP gas
- 3.5%Utility gas
- 1.3%Wood
- 1.2%Other fuel
- 0.2%Coal or coke
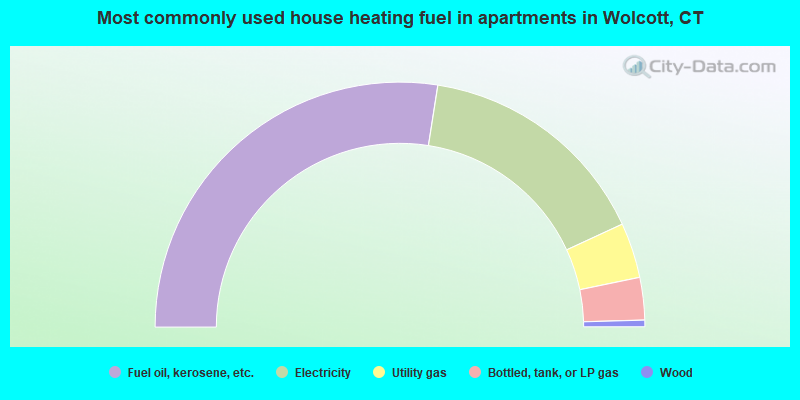
- 55.0%Fuel oil, kerosene, etc.
- 31.3%Electricity
- 7.3%Utility gas
- 5.6%Bottled, tank, or LP gas
- 0.9%Wood
Private vs. public school enrollment:
| Here: | 4.7% |
| Connecticut: | 9.9% |
| Here: | 5.7% |
| Connecticut: | 11.0% |
| Here: | 30.0% |
| Connecticut: | 33.4% |


