Woburn, MA (Massachusetts) Houses and Residents
| Woburn: | $646,668 |
| Massachusetts: | $534,700 |
Mean price in 2022:
Detached houses: $662,544
Here: $662,544 State: $651,570 Townhouses or other attached units: $641,451
Here: $641,451 State: $617,749 In 2-unit structures: $641,645
Here: $641,645 State: $594,808 In 3-to-4-unit structures: $685,173
Here: $685,173 State: $601,912 In 5-or-more-unit structures: $593,995
Here: $593,995 State: $555,768
Total population: 39,272 (Urban population: 37,258, Rural population: 0)
Houses: 17,067 (16,351 occupied: 9,610 owner occupied, 6,726 renter occupied)
| % of renters here: | 41% |
| State: | 38% |
Housing density: 1,347 houses/condos per square mile
Median price asked for vacant for-sale houses and condos in 2022: $1,578,060.
Median contract rent in 2022: $1,920 (lower quartile is $1,446, upper quartile is over $2,000)
Median rent asked for vacant for-rent units in 2022: $2,432
Median gross rent in Woburn, MA in 2022: over $2,000
Housing units in Woburn with a mortgage: 6,413 (798 second mortgage, 14 home equity loan, 751 both second mortgage and home equity loan)
Houses without a mortgage: 408
Median household income for houses/condos with a mortgage: $161,192
Median household income for apartments without a mortgage: $95,179
Median monthly housing costs: $2,105
Compare current foreclosures near Woburn, MA:
| Photo | Address | Area | Beds / Baths | Price | Details |
|---|---|---|---|---|---|

|
#1
Main St
Woburn, MA 01801
|
2,500 sq. feet
|
5 baths 6 beds |
show details | |

|
#2
Forest Park Rd
Woburn, MA 01801
|
1,132 sq. feet
|
2 baths 3 beds |
show details | |

|
#3
Montvale Ave
Woburn, MA 01801
|
2,057 sq. feet
|
2 baths 5 beds |
show details | |

|
#4
Gatta Cir
Woburn, MA 01801
|
1,350 sq. feet
|
2 baths 4 beds |
show details | |

|
#5
Mill St
Woburn, MA 01801
|
1,182 sq. feet
|
2 baths 4 beds |
show details | |

|
#6
Lord Ter
Woburn, MA 01801
|
1,008 sq. feet
|
1 baths 3 beds |
show details | |

|
#7
Davis St
Woburn, MA 01801
|
1,204 sq. feet
|
1 baths 3 beds |
show details | |

|
#8
Deb Rd
Woburn, MA 01801
|
1,350 sq. feet
|
1 baths 3 beds |
show details | |

|
#9
Church St
Woburn, MA 01801
|
3,340 sq. feet
|
2 baths 9 beds |
show details | |

|
#10
Burlington St
Woburn, MA 01801
|
1,008 sq. feet
|
2 baths 5 beds |
show details |
| Photo | Address | Area | Beds / Baths | Price | Details |
|---|---|---|---|---|---|

|
#11
Glenwood Ave
Woburn, MA 01801
|
998 sq. feet
|
1 baths 3 beds |
show details | |

|
#12
Mount Pleasant St
Woburn, MA 01801
|
1,614 sq. feet
|
2 baths 3 beds |
show details | |

|
#13
Mill St Apt 9
Woburn, MA 01801
|
- sq. feet
|
- baths - beds |
show details | |

|
#14
Linscott Rd
Woburn, MA 01801
|
- sq. feet
|
- baths - beds |
show details | |

|
#15
Tradecenter Ste 3700
Woburn, MA 01801
|
- sq. feet
|
- baths - beds |
show details | |

|
#16
Inwood Dr
Woburn, MA 01801
|
- sq. feet
|
- baths - beds |
show details | |

|
#17
Union St
Woburn, MA 01801
|
- sq. feet
|
- baths - beds |
show details | |

|
#18
Kimball Ct Apt 611
Woburn, MA 01801
|
- sq. feet
|
- baths - beds |
show details | |

|
#19
Spring Court Ext
Woburn, MA 01801
|
- sq. feet
|
- baths - beds |
show details | |

|
#20
Bedford Rd Apt 26a
Woburn, MA 01801
|
- sq. feet
|
- baths - beds |
show details |
| Photo | Address | Area | Beds / Baths | Price | Details |
|---|---|---|---|---|---|

|
#21
Westgate Dr Apt 201
Woburn, MA 01801
|
- sq. feet
|
- baths - beds |
show details | |

|
#22
Montvale Ave
Woburn, MA 01801
|
- sq. feet
|
- baths - beds |
show details | |

|
#23
Boyd St
Boston, MA 02124
|
3,970 sq. feet
|
3 baths 9 beds |
$650,000
|
show details |

|
#24
Stevens Ave
Middleton, MA 01949
|
1,396 sq. feet
|
2 baths 3 beds |
$535,600
|
show details |

|
#25
Church St
Boston, MA 02122
|
3,663 sq. feet
|
3 baths 6 beds |
show details | |

|
#26
Thomas St
Jamaica Plain, MA 02130
|
1,990 sq. feet
|
2 baths 2 beds |
show details | |

|
#27
Marcy Rd
Mattapan, MA 02126
|
1,168 sq. feet
|
1 baths 3 beds |
show details | |

|
#28
Bainbridge St
Malden, MA 02148
|
1,600 sq. feet
|
1 baths 3 beds |
show details | |

|
#29
Gilbert Rd
Needham, MA 02492
|
1,778 sq. feet
|
2 baths 3 beds |
show details | |

|
#30
Essex St
Swampscott, MA 01907
|
2,029 sq. feet
|
2 baths 3 beds |
show details |
| Photo | Address | Area | Beds / Baths | Price | Details |
|---|---|---|---|---|---|

|
#31
Boston Rd
Chelmsford, MA 01824
|
1,392 sq. feet
|
1 baths 3 beds |
show details | |

|
#32
Cardington Ave
Billerica, MA 01821
|
1,573 sq. feet
|
2 baths 5 beds |
show details | |

|
#33
Tobey Ln
Wakefield, MA 01880
|
3,240 sq. feet
|
2 baths 4 beds |
show details | |

|
#34
Congress Pl
Dedham, MA 02026
|
1,966 sq. feet
|
2 baths 4 beds |
show details | |

|
#35
Grv St
Needham, MA 02492
|
6,542 sq. feet
|
4 baths 6 beds |
show details | |

|
#36
3rd Ave
North Chelmsford, MA 01863
|
- sq. feet
|
1 baths 2 beds |
show details | |

|
#37
Bower St
Medford, MA 02155
|
2,323 sq. feet
|
2 baths 4 beds |
show details | |

|
#38
Condor St # 2
Boston, MA 02128
|
3,024 sq. feet
|
1 baths 3 beds |
show details | |

|
#39
Margin Street
Lynn, MA 01905
|
1,240 sq. feet
|
2 baths 2 beds |
show details | |

|
#40
Bridge St
Lowell, MA 01850
|
- sq. feet
|
1 baths 3 beds |
show details |
| Photo | Address | Area | Beds / Baths | Price | Details |
|---|---|---|---|---|---|

|
#41
Richmond St
Boston, MA 02124
|
2,516 sq. feet
|
2 baths 4 beds |
show details | |

|
#42
Lyons St
Lowell, MA 01852
|
1,314 sq. feet
|
1 baths 2 beds |
show details | |

|
#43
Salem St
North Andover, MA 01845
|
1,572 sq. feet
|
1 baths 2 beds |
show details | |

|
#44
Harvard St
Lowell, MA 01851
|
2,676 sq. feet
|
2 baths 4 beds |
show details | |

|
#45
Salem Rd
Billerica, MA 01821
|
1,428 sq. feet
|
1 baths 4 beds |
show details | |

|
#46
Brahms St
Roslindale, MA 02131
|
1,604 sq. feet
|
1 baths 4 beds |
show details | |

|
#47
Savin Hill Avenue, Unit 2 190 Savin Hill Avenue Condominium
Boston, MA 02125
|
1,022 sq. feet
|
1 baths 2 beds |
show details | |

|
#48
Thornton St
Lawrence, MA 01841
|
912 sq. feet
|
1 baths 2 beds |
show details | |

|
#49
Belmont Ave
Lynn, MA 01905
|
1,025 sq. feet
|
1 baths 2 beds |
show details | |

|
Check over 1 million property listings on Foreclosure.com!
|
browse all offers | |||

Latest news about housing in Woburn, MA collected exclusively by city-data.com from local newspapers, TV, and radio stations


Median year apartment built: 1977
Household type by relationship:
Households: 40,840- Male householders: 7,068 (1,484 living alone), Female householders: 8,992 (2,714 living alone)
7,743 spouses (7,515 opposite-sex spouses), 1,149 unmarried partners, (1,074 opposite-sex unmarried partners), 11,855 children (11,481 natural, 166 adopted, 208 stepchildren), 447 grandchildren, 460 brothers or sisters, 517 parents, 28 foster children, 707 other relatives, 1,568 non-relatives
- In group quarters: 300
Size of family households: 3,930 2-persons, 2,807 3-persons, 2,346 4-persons, 920 5-persons, 312 6-persons, 109 7-or-more-persons.
Size of nonfamily households: 4,377 1-person, 1,230 2-persons, 212 3-persons, 43 4-persons.
5,395 married couples with children.
1,322 single-parent households (369 men, 953 women).
74.7% of residents of Woburn speak English at home.
4.4% of residents speak Spanish at home (36% speak English very well, 26% speak English well, 25% speak English not well, 13% don't speak English at all).
14.6% of residents speak other Indo-European language at home (61% speak English very well, 25% speak English well, 7% speak English not well, 7% don't speak English at all).
4.2% of residents speak Asian or Pacific Island language at home (59% speak English very well, 24% speak English well, 11% speak English not well, 5% don't speak English at all).
1.9% of residents speak other language at home (88% speak English very well, 12% speak English well).
Foreign born population: 8,549 (20.9%)
(55.7% of them are naturalized citizens)
| Here: | 6.7 |
| State: | 6.5 |
| Here: | 4.0 |
| State: | 4.0 |

- Bedrooms in owner-occupied houses and condos in Woburn, Massachusetts
- 20no bedroom
- 2721 bedroom
- 1,4262 bedrooms
- 4,8193 bedrooms
- 2,2554 bedrooms
- 8195+ bedrooms

- Bedrooms in renter-occupied apartments in Woburn, Massachusetts
- 275no bedroom
- 2,2811 bedroom
- 2,6642 bedrooms
- 1,3723 bedrooms
- 1354 bedrooms
- 05+ bedrooms

- Cars and other vehicles available in Woburn in owner-occupied houses/condos
- 272no vehicle
- 2,4651 vehicle
- 4,4072 vehicles
- 1,6643 vehicles
- 5764 vehicles
- 2275+ vehicles

- Cars and other vehicles available in Woburn in renter-occupied apartments
- 853no vehicle
- 3,4701 vehicle
- 1,7542 vehicles
- 4703 vehicles
- 1794 vehicles
- 05+ vehicles

- Rooms in owner-occupied houses in Woburn, Massachusetts
- 201 room
- 612 rooms
- 2283 rooms
- 7024 rooms
- 1,2345 rooms
- 2,0656 rooms
- 1,9957 rooms
- 1,3948 rooms
- 1,9099+ rooms

- Rooms in renter-occupied apartments in Woburn, Massachusetts
- 2221 room
- 6822 rooms
- 1,6423 rooms
- 1,5594 rooms
- 1,5655 rooms
- 6046 rooms
- 2827 rooms
- 1208 rooms
- 539+ rooms


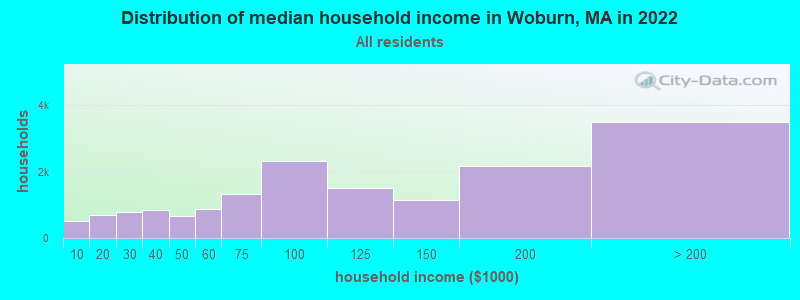
Woburn, MA household income distribution

- 499Less than $10,000
- 689$10,000 to $19,999
- 787$20,000 to $29,999
- 846$30,000 to $39,999
- 663$40,000 to $49,999
- 866$50,000 to $59,999
- 1,320$60,000 to $74,999
- 2,319$75,000 to $99,999
- 1,505$100,000 to $124,999
- 1,150$125,000 to $149,999
- 2,178$150,000 to $199,999
- 3,490$200,000 or more
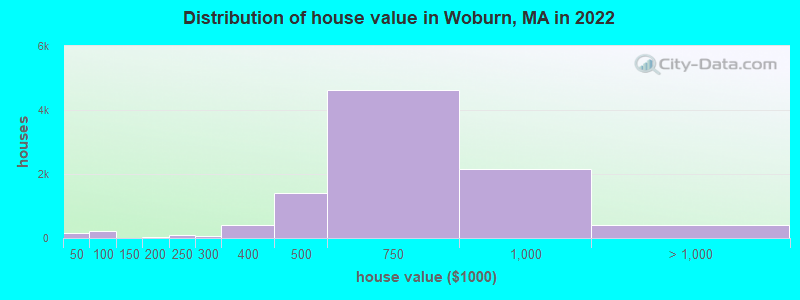
Home value of owner - occupied houses in 2022 in Woburn, MA
-
- 145Less than $10,000
- 11$25,000 to $29,999
- 19$50,000 to $59,999
- 19$60,000 to $69,999
- 135$70,000 to $79,999
- 37$80,000 to $89,999
- 7$125,000 to $149,999
- 21$150,000 to $174,999
- 9$175,000 to $199,999
- 106$200,000 to $249,999
- 71$250,000 to $299,999
- 405$300,000 to $399,999
- 1,391$400,000 to $499,999
- 4,620$500,000 to $749,999
- 2,163$750,000 to $999,999
- 340$1,000,000 to $1,499,999
- 26$1,500,000 to $1,999,999
- 53$2,000,000 or more
Rent paid by renters in 2022 in Woburn, MA
-
- 31Less than $100
- 81$100 to $149
- 58$200 to $249
- 86$250 to $299
- 115$300 to $349
- 107$350 to $399
- 17$400 to $449
- 86$450 to $499
- 35$500 to $549
- 18$550 to $599
- 83$600 to $649
- 36$650 to $699
- 3$700 to $749
- 8$750 to $799
- 34$800 to $899
- 64$900 to $999
- 354$1,000 to $1,249
- 584$1,250 to $1,499
- 1,807$1,500 to $1,999
- 2,028$2,000 to $2,499
- 638$2,500 to $2,999
- 245$3,000 to $3,499
- 37$3,500 or more
- 258No cash rent


Percentage of workers working in this county: 81.4%
Number of people working at home: 3,926 (17.3% of all workers)
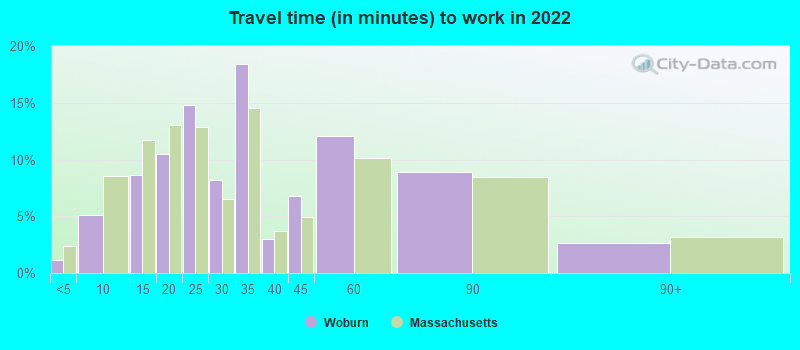
Travel time to work (commute)
- Less than 5 minutes: 268
- 5 to 9 minutes: 2,242
- 10 to 14 minutes: 2,449
- 15 to 19 minutes: 2,850
- 20 to 24 minutes: 2,425
- 25 to 29 minutes: 1,491
- 30 to 34 minutes: 2,809
- 35 to 39 minutes: 575
- 40 to 44 minutes: 278
- 45 to 59 minutes: 1,776
- 60 to 89 minutes: 1,071
- 90 or more minutes: 248
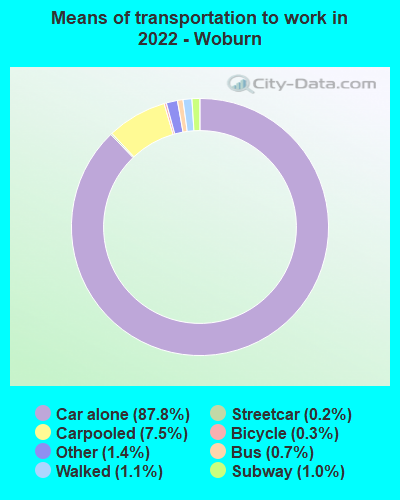
Means of transportation to work:
- Drove a car alone: 28,171 (75.1%)
- Carpooled: 2,520 (6.7%)
- Bus: 176 (0.5%)
- Subway or elevated rail: 57 (0.2%)
- Long-distance train or commuter rail: 219 (0.6%)
- Ferryboat: 16 (0.0%)
- Taxi: 567 (1.5%)
- Bicycle: 129 (0.3%)
- Walked: 381 (1.0%)
- Worked at home: 3,926 (10.5%)

- Unemployment by race in 2022
- Unemployment rate for White non-Hispanic residents
- 5.9%Males
- 4.2%Females
- Unemployment rate for Black residents
- 2.6%Males
- 11.3%Females
- Unemployment rate for Asian residents
- 2.5%Males
- 5.0%Females
- Unemployment rate for other race residents
- 28.7%Males
- 6.6%Females
- Unemployment rate for two or more race residents
- 1.8%Males
- Unemployment rate for Hispanic or Latino residents
- 12.8%Males
- 4.2%Females

- Year of entry for the foreign-born population in Woburn, Massachusetts
- 4,0212010 or later
- 1,9962000 to 2009
- 1,0431990 to 1999
- 7421980 to 1989
- 3721970 to 1979
- 833Before 1970

First ancestries reported:
- Irish: 4,596 (23.4%)
- Italian: 2,743 (14.0%)
- Portuguese: 757 (3.9%)
- Brazilian: 673 (3.4%)
- English: 660 (3.4%)
- Haitian: 639 (3.3%)
- Greek: 455 (2.3%)
- American: 408 (2.1%)
- Danish: 371 (1.9%)
- German: 360 (1.8%)
- Ugandan: 268 (1.4%)
- Albanian: 262 (1.3%)
- French Canadian: 237 (1.2%)
- Armenian: 217 (1.1%)
- Kenyan: 181 (0.9%)
- Bulgarian: 168 (0.9%)
- Polish: 143 (0.7%)
- European: 125 (0.6%)
- Scottish: 107 (0.5%)
- Swedish: 104 (0.5%)
- Northern European: 85 (0.4%)
- Canadian: 65 (0.3%)
- French: 61 (0.3%)
- Ukrainian: 61 (0.3%)
- Lebanese: 60 (0.3%)
- Sudanese: 58 (0.3%)
- Lithuanian: 53 (0.3%)
- Hungarian: 51 (0.3%)
- African: 48 (0.2%)
- Eastern European: 47 (0.2%)
- British: 47 (0.2%)
- Russian: 44 (0.2%)
- Egyptian: 36 (0.2%)
- Syrian: 32 (0.2%)
- Romanian: 31 (0.2%)
- Palestinian: 31 (0.2%)
- Scotch-Irish: 29 (0.1%)
- Barbadian: 26 (0.1%)
- Scandinavian: 25 (0.1%)
- Moroccan: 24 (0.1%)
- New Zealander: 17 (0.09%)
- Afghan: 11 (0.06%)
- Iranian: 11 (0.06%)
- Nigerian: 8 (0.04%)
- Arab: 6 (0.03%)
- Croatian: 1 (0.01%)
Most common places of birth for foreign-born residents (%):
| Woburn: | 17.8% (1,521) |
| Massachusetts: | 6.8% (82,934) |
| Woburn: | 14.8% (1,268) |
| Massachusetts: | 7.6% (92,959) |
| Woburn: | 6.6% (567) |
| Massachusetts: | 4.9% (60,432) |
| Woburn: | 6.0% (516) |
| Massachusetts: | 1.1% (13,563) |
| Woburn: | 5.3% (454) |
| Massachusetts: | 8.4% (103,233) |
| Woburn: | 4.2% (356) |
| Massachusetts: | 1.1% (13,076) |
| Woburn: | 3.5% (297) |
| Massachusetts: | 0.4% (5,099) |
| Woburn: | 2.3% (196) |
| Massachusetts: | 4.1% (50,360) |
| Woburn: | 2.3% (193) |
| Massachusetts: | 3.7% (45,667) |
| Woburn: | 1.9% (161) |
| Massachusetts: | 0.3% (3,184) |
| Woburn: | 1.8% (157) |
| Massachusetts: | 2.3% (27,810) |
| Woburn: | 1.8% (152) |
| Massachusetts: | 3.0% (37,197) |
| Woburn: | 1.7% (149) |
| Massachusetts: | 2.7% (32,733) |
| Woburn: | 1.6% (139) |
| Massachusetts: | 8.3% (101,767) |
Place of birth for U.S.-born residents:
- This state: 25,863
- Other state: 5,697
- Northeast: 3,134
- Midwest: 566
- South: 1,222
- West: 810
86.4% of Woburn residents lived in the same house 1 years ago.
Out of people who lived in different houses, 38.3% lived in this county.
Out of people who lived in different counties, 48.6% lived in Massachusetts.
| Woburn: | 86.4% |
| State average: | 87.7% |
Education attainment for males 25 years and older:
- No schooling: 350
- Nursery to 4th grade: 64
- 5th and 6th grade: 15
- 7th and 8th grade: 124
- 9th grade: 183
- 10th grade: 47
- 11th grade: 46
- 12th grade, no diploma: 259
- High school graduate (or equivalency): 3,640
- Less than 1 year of college: 742
- Some college more than 1 year, no degree: 975
- Associate degree: 884
- Bachelor's degree: 4,034
- Master's degree: 2,085
- Professional school degree: 197
- Doctorate degree: 633

Education attainment for females 25 years and older:
- No schooling: 182
- Nursery to 4th grade: 28
- 5th and 6th grade: 85
- 7th and 8th grade: 56
- 9th grade: 92
- 10th grade: 143
- 11th grade: 99
- 12th grade, no diploma: 175
- High school graduate (or equivalency): 3,498
- Less than 1 year of college: 840
- Some college more than 1 year, no degree: 1,119
- Associate degree: 1,419
- Bachelor's degree: 4,173
- Master's degree: 2,719
- Professional school degree: 70
- Doctorate degree: 212


Housing units in structures:
- One, detached: 8,360
- One, attached: 1,306
- Two: 2,098
- 3 or 4: 860
- 5 to 9: 1,024
- 10 to 19: 687
- 20 to 49: 1,358
- 50 or more: 1,328
- Mobile homes: 42
Housing units lacking complete kitchen facilities in 2022: 1.3%
House/condo owner moved in on average 16 years ago
Renter moved in on average 2 years ago

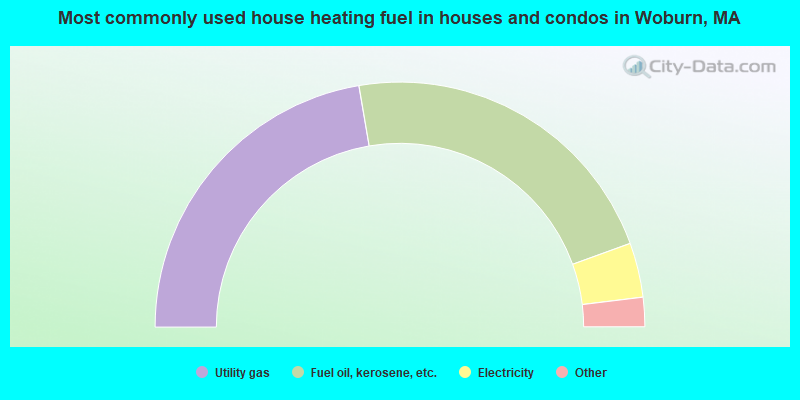
- 44.7%Utility gas
- 44.3%Fuel oil, kerosene, etc.
- 7.2%Electricity
- 3.5%Bottled, tank, or LP gas
- 0.2%Other fuel
- 0.2%Solar energy
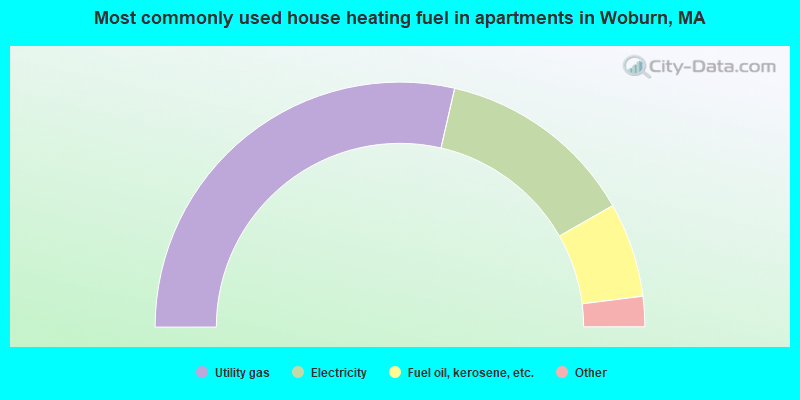
- 57.2%Utility gas
- 26.3%Electricity
- 12.5%Fuel oil, kerosene, etc.
- 2.6%Bottled, tank, or LP gas
- 0.9%Other fuel
- 0.5%No fuel used
Private vs. public school enrollment:
| Here: | 8.8% |
| Massachusetts: | 10.3% |
| Here: | 11.1% |
| Massachusetts: | 12.3% |
| Here: | 44.7% |
| Massachusetts: | 51.2% |


