Wisconsin Rapids, WI (Wisconsin) Houses and Residents
| Wisconsin Rapids: | $125,191 |
| Wisconsin: | $252,800 |
Mean price in 2022:
Detached houses: $152,469
Here: $152,469 State: $308,468 Townhouses or other attached units: $313,942
Here: $313,942 State: $265,873 In 2-unit structures: $144,321
Here: $144,321 State: $203,667 In 5-or-more-unit structures: $85,618
Here: $85,618 State: $280,537 Mobile homes: $51,433
Here: $51,433 State: $79,042
Total population: 17,966 (All urban)
Houses: 9,290 (8,576 occupied: 4,696 owner occupied, 3,938 renter occupied)
| % of renters here: | 46% |
| State: | 32% |
Housing density: 700 houses/condos per square mile
Median price asked for vacant for-sale houses and condos in 2022 in this county: $132,741.
Median contract rent in 2022: $754 (lower quartile is $615, upper quartile is $983)
Median rent asked for vacant for-rent units in 2022: $2,775
Median gross rent in Wisconsin Rapids, WI in 2022: $927
Housing units in Wisconsin Rapids with a mortgage: 2,855 (324 second mortgage, 0 home equity loan, 309 both second mortgage and home equity loan)
Houses without a mortgage: 144
Median household income for houses/condos with a mortgage: $79,384
Median household income for apartments without a mortgage: $49,607
Median monthly housing costs: $872
Compare current foreclosures near Wisconsin Rapids, WI:
| Photo | Address | Area | Beds / Baths | Price | Details |
|---|---|---|---|---|---|

|
#1
Washington St
Wisconsin Rapids, WI 54494
|
1,917 sq. feet
|
1 baths 3 beds |
$179,900
|
show details |

|
#2
2nd St S
Wisconsin Rapids, WI 54494
|
- sq. feet
|
1 baths 4 beds |
show details | |

|
#3
14th St N
Wisconsin Rapids, WI 54494
|
- sq. feet
|
- baths - beds |
show details | |

|
#4
16th St S
Wisconsin Rapids, WI 54494
|
- sq. feet
|
- baths - beds |
show details | |

|
#5
Plover Rd
Wisconsin Rapids, WI 54494
|
- sq. feet
|
- baths - beds |
show details | |

|
#6
State Highway 73 S Trlr B7
Wisconsin Rapids, WI 54494
|
- sq. feet
|
- baths - beds |
show details | |

|
#7
16th St N
Wisconsin Rapids, WI 54494
|
- sq. feet
|
- baths - beds |
show details | |

|
#8
3rd Ave S
Wisconsin Rapids, WI 54495
|
- sq. feet
|
- baths - beds |
show details | |

|
#9
Pepper Ave
Wisconsin Rapids, WI 54494
|
- sq. feet
|
- baths - beds |
show details | |

|
#10
Sampson St
Wisconsin Rapids, WI 54494
|
- sq. feet
|
- baths - beds |
show details |
| Photo | Address | Area | Beds / Baths | Price | Details |
|---|---|---|---|---|---|

|
#11
14th St S # 12
Wisconsin Rapids, WI 54494
|
- sq. feet
|
- baths - beds |
show details | |

|
#12
1st St N Apt 201
Wisconsin Rapids, WI 54494
|
- sq. feet
|
- baths - beds |
show details | |

|
#13
32nd St S
Wisconsin Rapids, WI 54494
|
- sq. feet
|
- baths - beds |
show details | |

|
#14
Lonesome Rd
Wisconsin Rapids, WI 54495
|
- sq. feet
|
- baths - beds |
show details | |

|
#15
Sampson St
Wisconsin Rapids, WI 54494
|
- sq. feet
|
- baths - beds |
show details | |

|
#16
Lincoln St
Wisconsin Rapids, WI 54494
|
- sq. feet
|
- baths - beds |
show details | |

|
#17
24th Ave S
Wisconsin Rapids, WI 54495
|
- sq. feet
|
- baths - beds |
show details | |

|
#18
Woodhaven Ln
Wisconsin Rapids, WI 54494
|
- sq. feet
|
- baths - beds |
show details | |

|
#19
Eagle Rd
Wisconsin Rapids, WI 54494
|
- sq. feet
|
- baths - beds |
show details | |

|
#20
16th St N
Wisconsin Rapids, WI 54494
|
- sq. feet
|
- baths - beds |
show details |
| Photo | Address | Area | Beds / Baths | Price | Details |
|---|---|---|---|---|---|

|
#21
Gaynor Ave
Wisconsin Rapids, WI 54495
|
- sq. feet
|
- baths - beds |
show details | |

|
#22
22nd St N
Wisconsin Rapids, WI 54494
|
- sq. feet
|
- baths - beds |
show details | |

|
#23
Church Ave
Wisconsin Rapids, WI 54494
|
- sq. feet
|
- baths - beds |
show details | |

|
#24
13th Ave N
Wisconsin Rapids, WI 54495
|
- sq. feet
|
- baths - beds |
show details | |

|
#25
15th St S
Wisconsin Rapids, WI 54494
|
- sq. feet
|
- baths - beds |
show details | |

|
#26
Thalacker Ave
Wisconsin Rapids, WI 54494
|
- sq. feet
|
- baths - beds |
show details | |

|
#27
28th St S
Wisconsin Rapids, WI 54494
|
- sq. feet
|
- baths - beds |
show details | |

|
#28
Rangeline Rd
Wisconsin Rapids, WI 54494
|
- sq. feet
|
- baths - beds |
show details | |

|
#29
Airport Ave
Wisconsin Rapids, WI 54494
|
- sq. feet
|
- baths - beds |
show details | |

|
#30
Frederick St
Stevens Point, WI 54481
|
1,196 sq. feet
|
2 baths 5 beds |
show details |
| Photo | Address | Area | Beds / Baths | Price | Details |
|---|---|---|---|---|---|

|
#31
Pleasant Dr, Apt 4
Plover, WI 54467
|
- sq. feet
|
- baths - beds |
show details | |

|
#32
Main St
Junction City, WI 54443
|
- sq. feet
|
- baths - beds |
show details | |

|
#33
Prentice St N Apt 31
Stevens Point, WI 54481
|
- sq. feet
|
- baths - beds |
show details | |

|
#34
Johns Dr Apt 9
Stevens Point, WI 54481
|
- sq. feet
|
- baths - beds |
show details | |

|
#35
W Cornell Ave
Stevens Point, WI 54481
|
- sq. feet
|
- baths - beds |
show details | |

|
#36
Maria Dr # 401
Stevens Point, WI 54481
|
- sq. feet
|
- baths - beds |
show details | |

|
#37
Water St Apt 37
Stevens Point, WI 54481
|
- sq. feet
|
- baths - beds |
show details | |

|
#38
Prairie St
Stevens Point, WI 54481
|
- sq. feet
|
- baths - beds |
show details | |

|
#39
Maple Dr Apt 2
Plover, WI 54467
|
- sq. feet
|
- baths - beds |
show details | |

|
#40
Bridlewood Dr
Plover, WI 54467
|
- sq. feet
|
- baths - beds |
show details |
| Photo | Address | Area | Beds / Baths | Price | Details |
|---|---|---|---|---|---|

|
#41
Minnesota Ave
Stevens Point, WI 54481
|
- sq. feet
|
- baths - beds |
show details | |

|
#42
Hoffman Dr
Plover, WI 54467
|
- sq. feet
|
- baths - beds |
show details | |

|
#43
Bogey Trl
Nekoosa, WI 54457
|
- sq. feet
|
- baths - beds |
show details | |

|
#44
Apache Cir
Nekoosa, WI 54457
|
- sq. feet
|
- baths - beds |
show details | |

|
#45
Hayes Ave, Trlr 26
Plover, WI 54467
|
- sq. feet
|
- baths - beds |
show details | |

|
#46
Leahy Ave Apt 2
Stevens Point, WI 54481
|
- sq. feet
|
- baths - beds |
show details | |

|
#47
Poplar Ave
Plover, WI 54467
|
- sq. feet
|
- baths - beds |
show details | |

|
#48
Leahy Ave
Stevens Point, WI 54481
|
- sq. feet
|
- baths - beds |
show details | |

|
#49
Nebel St
Stevens Point, WI 54481
|
- sq. feet
|
- baths - beds |
show details | |

|
Check over 1 million property listings on Foreclosure.com!
|
browse all offers | |||


 | Which Wisconsin city is best? (15 replies) |
| Houses in Wisconsin Rapids (5 replies) |
| Retiring in WI: Moving from Noo Awlins (34 replies) |
| Marshfield/Wisconsin Rapids/Stevens Point? (8 replies) |
| Question regarding real estate around Nekoosa (2 replies) |
| Stevens Point, Plover, or Rapids? (2 replies) |

Median year apartment built: 1978
Household type by relationship:
Households: 18,746- Male householders: 3,656 (1,082 living alone), Female householders: 4,853 (2,363 living alone)
2,661 spouses (2,645 opposite-sex spouses), 799 unmarried partners, (784 opposite-sex unmarried partners), 5,003 children (4,746 natural, 16 adopted, 239 stepchildren), 150 grandchildren, 233 brothers or sisters, 150 parents, 0 foster children, 197 other relatives, 550 non-relatives
- In group quarters: 488
Size of family households: 2,257 2-persons, 922 3-persons, 562 4-persons, 455 5-persons, 313 6-persons, 128 7-or-more-persons.
Size of nonfamily households: 3,252 1-person, 742 2-persons.
2,630 married couples with children.
1,426 single-parent households (284 men, 1,142 women).
95.1% of residents of Wisconsin Rapids speak English at home.
0.9% of residents speak Spanish at home (82% speak English very well, 18% speak English not well).
0.6% of residents speak other Indo-European language at home (89% speak English very well, 11% speak English well).
3.6% of residents speak Asian or Pacific Island language at home (75% speak English very well, 6% speak English well, 19% speak English not well).
Foreign born population: 446 (2.4%)
(36.1% of them are naturalized citizens)
| Here: | 6.2 |
| State: | 6.5 |
| Here: | 4.5 |
| State: | 4.1 |

- Bedrooms in owner-occupied houses and condos in Wisconsin Rapids, Wisconsin
- 0no bedroom
- 831 bedroom
- 1,0992 bedrooms
- 2,2253 bedrooms
- 1,1274 bedrooms
- 1635+ bedrooms

- Bedrooms in renter-occupied apartments in Wisconsin Rapids, Wisconsin
- 195no bedroom
- 8361 bedroom
- 1,9302 bedrooms
- 6863 bedrooms
- 2054 bedrooms
- 865+ bedrooms

- Cars and other vehicles available in Wisconsin Rapids in owner-occupied houses/condos
- 110no vehicle
- 1,4871 vehicle
- 1,9902 vehicles
- 8333 vehicles
- 2414 vehicles
- 355+ vehicles

- Cars and other vehicles available in Wisconsin Rapids in renter-occupied apartments
- 448no vehicle
- 2,0931 vehicle
- 1,1222 vehicles
- 1403 vehicles
- 464 vehicles
- 905+ vehicles

- Rooms in owner-occupied houses in Wisconsin Rapids, Wisconsin
- 01 room
- 252 rooms
- 793 rooms
- 4634 rooms
- 7025 rooms
- 1,4386 rooms
- 8327 rooms
- 5858 rooms
- 5729+ rooms

- Rooms in renter-occupied apartments in Wisconsin Rapids, Wisconsin
- 1951 room
- 3832 rooms
- 6023 rooms
- 1,0754 rooms
- 7195 rooms
- 5126 rooms
- 1727 rooms
- 908 rooms
- 1899+ rooms


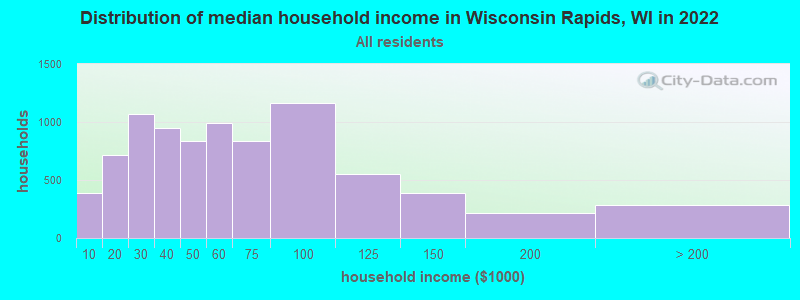
Wisconsin Rapids, WI household income distribution

- 388Less than $10,000
- 718$10,000 to $19,999
- 1,066$20,000 to $29,999
- 952$30,000 to $39,999
- 836$40,000 to $49,999
- 995$50,000 to $59,999
- 835$60,000 to $74,999
- 1,164$75,000 to $99,999
- 549$100,000 to $124,999
- 389$125,000 to $149,999
- 218$150,000 to $199,999
- 283$200,000 or more
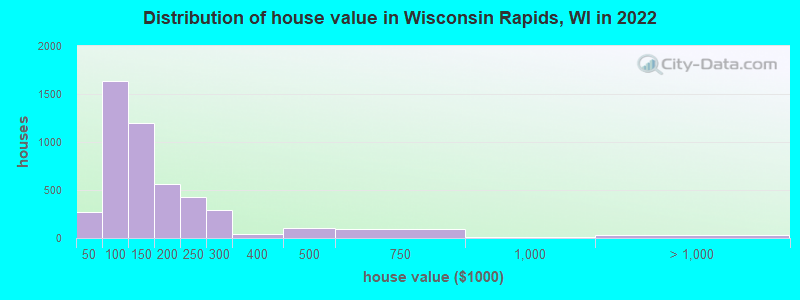
Home value of owner - occupied houses in 2022 in Wisconsin Rapids, WI
-
- 36Less than $10,000
- 22$15,000 to $19,999
- 43$20,000 to $24,999
- 5$25,000 to $29,999
- 17$30,000 to $34,999
- 86$35,000 to $39,999
- 64$40,000 to $49,999
- 89$50,000 to $59,999
- 183$60,000 to $69,999
- 243$70,000 to $79,999
- 581$80,000 to $89,999
- 471$90,000 to $99,999
- 795$100,000 to $124,999
- 403$125,000 to $149,999
- 290$150,000 to $174,999
- 272$175,000 to $199,999
- 423$200,000 to $249,999
- 289$250,000 to $299,999
- 39$300,000 to $399,999
- 100$400,000 to $499,999
- 92$500,000 to $749,999
- 11$750,000 to $999,999
- 35$2,000,000 or more
Rent paid by renters in 2022 in Wisconsin Rapids, WI
-
- 9$100 to $149
- 24$150 to $199
- 6$200 to $249
- 47$250 to $299
- 38$300 to $349
- 75$350 to $399
- 137$400 to $449
- 140$450 to $499
- 297$500 to $549
- 233$550 to $599
- 212$600 to $649
- 326$650 to $699
- 576$700 to $749
- 304$750 to $799
- 352$800 to $899
- 224$900 to $999
- 602$1,000 to $1,249
- 87$1,250 to $1,499
- 24$1,500 to $1,999
- 10$2,000 to $2,499
- 39$2,500 to $2,999
- 92$3,000 to $3,499
- 97$3,500 or more
- 95No cash rent


Percentage of workers working in this county: 68.1%
Number of people working at home: 720 (8.3% of all workers)
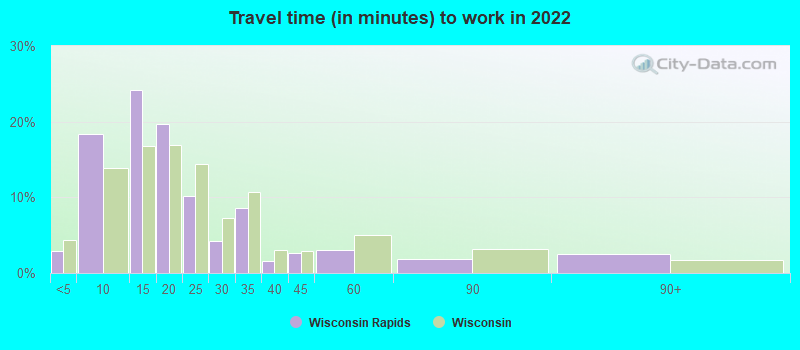
Travel time to work (commute)
- Less than 5 minutes: 217
- 5 to 9 minutes: 1,716
- 10 to 14 minutes: 1,506
- 15 to 19 minutes: 956
- 20 to 24 minutes: 499
- 25 to 29 minutes: 399
- 30 to 34 minutes: 1,698
- 35 to 39 minutes: 148
- 40 to 44 minutes: 466
- 45 to 59 minutes: 217
- 60 to 89 minutes: 306
- 90 or more minutes: 229
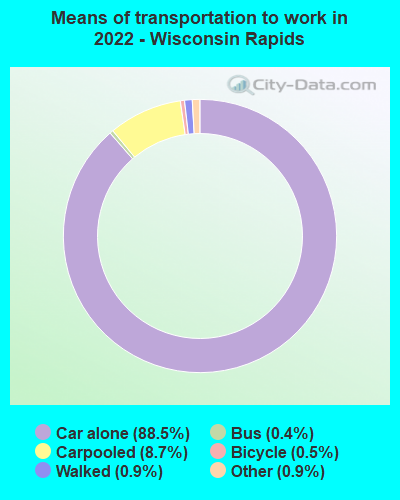
Means of transportation to work:
- Drove a car alone: 9,912 (81.1%)
- Carpooled: 1,000 (8.2%)
- Bus: 51 (0.4%)
- Taxi: 117 (1.0%)
- Bicycle: 127 (1.0%)
- Walked: 84 (0.7%)
- Worked at home: 839 (6.9%)

- Unemployment by race in 2022
- Unemployment rate for White non-Hispanic residents
- 5.3%Males
- 4.0%Females
- Unemployment rate for Black residents
- 48.4%Males
- 32.0%Females
- Unemployment rate for Asian residents
- 25.1%Males
- Unemployment rate for two or more race residents
- 5.4%Males
- 5.4%Females

- Year of entry for the foreign-born population in Wisconsin Rapids, Wisconsin
- 502010 or later
- 632000 to 2009
- 711990 to 1999
- 2021980 to 1989
- 151970 to 1979
- 78Before 1970

First ancestries reported:
- German: 3,054 (35.9%)
- American: 1,059 (12.4%)
- Polish: 873 (10.3%)
- English: 328 (3.9%)
- Dutch: 264 (3.1%)
- Norwegian: 248 (2.9%)
- Irish: 238 (2.8%)
- Italian: 180 (2.1%)
- European: 116 (1.4%)
- French: 68 (0.8%)
- Danish: 39 (0.5%)
- French Canadian: 39 (0.5%)
- Swedish: 28 (0.3%)
- Lebanese: 22 (0.3%)
- Greek: 22 (0.3%)
- Czech: 17 (0.2%)
- Finnish: 13 (0.2%)
- Haitian: 11 (0.1%)
- Belgian: 10 (0.1%)
- British: 10 (0.1%)
- African: 4 (0.05%)
- Portuguese: 2 (0.02%)
Most common places of birth for foreign-born residents (%):
| Wisconsin Rapids: | 29.8% (100) |
| Wisconsin: | 4.3% (12,681) |
| Wisconsin Rapids: | 21.7% (73) |
| Wisconsin: | 3.3% (9,655) |
| Wisconsin Rapids: | 14.3% (48) |
| Wisconsin: | 29.5% (87,182) |
| Wisconsin Rapids: | 10.1% (34) |
| Wisconsin: | 3.1% (9,280) |
| Wisconsin Rapids: | 7.1% (24) |
| Wisconsin: | 0.8% (2,478) |
| Wisconsin Rapids: | 5.4% (18) |
| Wisconsin: | 8.0% (23,594) |
| Wisconsin Rapids: | 4.2% (14) |
| Wisconsin: | 0.8% (2,427) |
Place of birth for U.S.-born residents:
- This state: 15,123
- Other state: 3,119
- Northeast: 145
- Midwest: 1,711
- South: 698
- West: 604
80.0% of Wisconsin Rapids residents lived in the same house 1 years ago.
Out of people who lived in different houses, 38.5% lived in this county.
Out of people who lived in different counties, 68.6% lived in Wisconsin.
| Wisconsin Rapids: | 80.0% |
| State average: | 87.7% |
Education attainment for males 25 years and older:
- No schooling: 100
- Nursery to 4th grade: 0
- 5th and 6th grade: 61
- 7th and 8th grade: 95
- 9th grade: 46
- 10th grade: 26
- 11th grade: 93
- 12th grade, no diploma: 175
- High school graduate (or equivalency): 2,174
- Less than 1 year of college: 420
- Some college more than 1 year, no degree: 741
- Associate degree: 818
- Bachelor's degree: 737
- Master's degree: 202
- Professional school degree: 61
- Doctorate degree: 10

Education attainment for females 25 years and older:
- No schooling: 51
- Nursery to 4th grade: 0
- 5th and 6th grade: 0
- 7th and 8th grade: 32
- 9th grade: 36
- 10th grade: 76
- 11th grade: 86
- 12th grade, no diploma: 95
- High school graduate (or equivalency): 2,544
- Less than 1 year of college: 335
- Some college more than 1 year, no degree: 816
- Associate degree: 1,387
- Bachelor's degree: 1,062
- Master's degree: 294
- Professional school degree: 20
- Doctorate degree: 0


Housing units in structures:
- One, detached: 5,998
- One, attached: 444
- Two: 554
- 3 or 4: 105
- 5 to 9: 605
- 10 to 19: 445
- 20 to 49: 496
- 50 or more: 438
- Mobile homes: 201
Median worth of mobile homes: $29,362
Housing units lacking complete kitchen facilities in 2022: 3.2%
House/condo owner moved in on average 14 years ago
Renter moved in on average 2 years ago

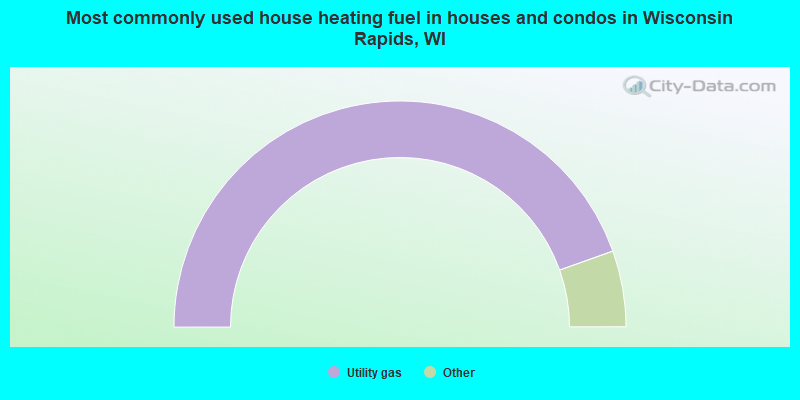
- 89.1%Utility gas
- 3.1%Bottled, tank, or LP gas
- 2.7%Electricity
- 2.7%Fuel oil, kerosene, etc.
- 1.1%No fuel used
- 0.5%Other fuel
- 0.5%Wood
- 0.4%Solar energy
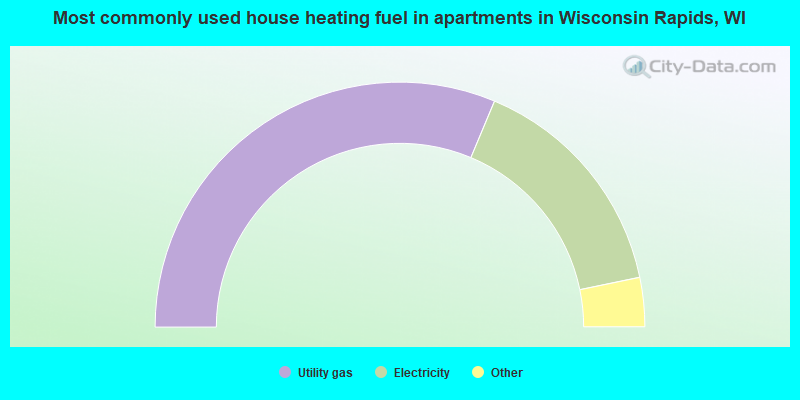
- 62.7%Utility gas
- 30.9%Electricity
- 3.1%Bottled, tank, or LP gas
- 1.6%No fuel used
- 1.0%Other fuel
- 0.7%Wood
Private vs. public school enrollment:
| Here: | 21.4% |
| Wisconsin: | 16.7% |
| Here: | 13.3% |
| Wisconsin: | 12.5% |
| Here: | 11.5% |
| Wisconsin: | 17.5% |


