Housing density: 1,181 houses/condos per square mile
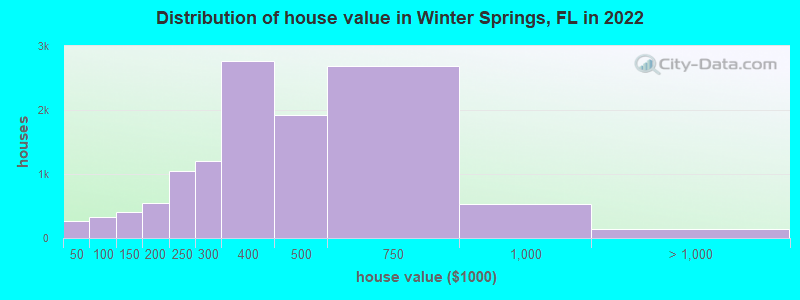
Median price asked for vacant for-sale houses and condos in 2022: $1,244,408.
Median contract rent in 2022: $1,480 (lower quartile is $1,217, upper quartile is $1,820)
Median rent asked for vacant for-rent units in 2022: $1,352
Median gross rent in Winter Springs, FL in 2022: $1,650
Housing units in Winter Springs with a mortgage: 7,865 (839 second mortgage, 0 home equity loan, 626 both second mortgage and home equity loan) Houses without a mortgage: 134
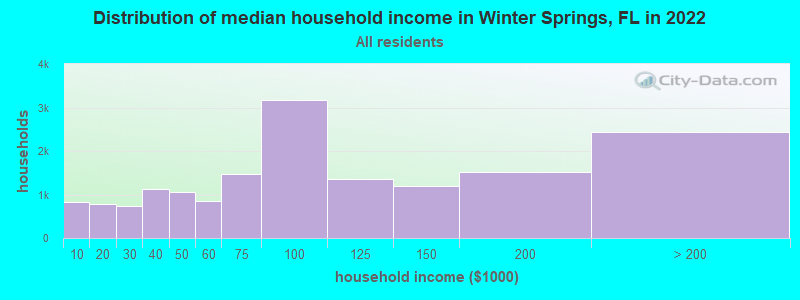
Median household income for houses/condos with a mortgage: $103,542
Median household income for apartments without a mortgage: $85,820
Median monthly housing costs: $1,482
Compare current foreclosures in Winter Springs, FL:
Size of family households: 5,144 2-persons, 2,199 3-persons, 1,891 4-persons, 992 5-persons, 320 6-persons, 35 7-or-more-persons.
Size of nonfamily households: 4,389 1-person, 1,259 2-persons, 88 3-persons.
4,595 married couples with children.
1,540 single-parent households (612 men, 928 women).
78.5% of residents of Winter Springs speak English at home.
12.0% of residents speak Spanish at home (76% speak English very well, 14% speak English well, 10% speak English not well).
5.6% of residents speak other Indo-European language at home (71% speak English very well, 21% speak English well, 6% speak English not well, 2% don't speak English at all).
2.4% of residents speak Asian or Pacific Island language at home (51% speak English very well, 30% speak English well, 17% speak English not well, 2% don't speak English at all).
1.4% of residents speak other language at home (61% speak English very well, 39% speak English well).
Foreign born population: 4,622 (11.9%)
(65.7% of them are naturalized citizens)
Year of entry for the foreign-born population in Winter Springs, Florida
1,1822010 or later
1,0572000 to 2009
8441990 to 1999
6181980 to 1989
3611970 to 1979
699Before 1970
First ancestries reported:
American: 1,779 (9.4%)
English: 1,613 (8.5%)
German: 1,102 (5.8%)
Irish: 1,081 (5.7%)
Italian: 1,022 (5.4%)
European: 584 (3.1%)
Polish: 375 (2.0%)
Scottish: 339 (1.8%)
French: 328 (1.7%)
Swedish: 278 (1.5%)
Jamaican: 269 (1.4%)
Scotch-Irish: 243 (1.3%)
Egyptian: 219 (1.2%)
Haitian: 205 (1.1%)
British: 204 (1.1%)
Russian: 183 (1.0%)
Lebanese: 147 (0.8%)
Dutch: 143 (0.8%)
Eastern European: 119 (0.6%)
French Canadian: 94 (0.5%)
African: 88 (0.5%)
Canadian: 81 (0.4%)
Barbadian: 80 (0.4%)
Greek: 62 (0.3%)
Brazilian: 61 (0.3%)
Iranian: 59 (0.3%)
Hungarian: 54 (0.3%)
Slovene: 40 (0.2%)
Norwegian: 34 (0.2%)
Celtic: 31 (0.2%)
Czechoslovakian: 27 (0.1%)
Lithuanian: 25 (0.1%)
Arab: 25 (0.1%)
Bulgarian: 24 (0.1%)
Slavic: 20 (0.1%)
Finnish: 19 (0.1%)
Slovak: 17 (0.09%)
Portuguese: 16 (0.08%)
Cajun: 16 (0.08%)
Palestinian: 15 (0.08%)
Guyanese: 15 (0.08%)
Austrian: 13 (0.07%)
Welsh: 13 (0.07%)
Scandinavian: 10 (0.05%)
Pennsylvania German: 8 (0.04%)
Most common places of birth for foreign-born residents (%):
Colombia
Winter Springs:
9.7% (435)
Florida:
6.5% (298,669)
Vietnam
Winter Springs:
7.0% (311)
Florida:
1.3% (60,604)
Philippines
Winter Springs:
6.0% (270)
Florida:
1.8% (84,403)
Canada
Winter Springs:
5.5% (248)
Florida:
2.4% (109,132)
India
Winter Springs:
5.2% (231)
Florida:
2.1% (94,349)
Germany
Winter Springs:
5.1% (229)
Florida:
1.2% (54,272)
Haiti
Winter Springs:
4.5% (200)
Florida:
7.5% (342,375)
Cuba
Winter Springs:
4.3% (190)
Florida:
22.0% (1,006,576)
Dominican Republic
Winter Springs:
3.8% (168)
Florida:
3.0% (137,727)
Ecuador
Winter Springs:
3.2% (144)
Florida:
1.2% (54,585)
Bangladesh
Winter Springs:
3.2% (143)
Florida:
0.3% (13,053)
China, excluding Hong Kong and Taiwan
Winter Springs:
2.6% (116)
Florida:
1.2% (56,071)
Other Eastern Africa
Winter Springs:
2.6% (114)
Florida:
0.1% (2,818)
Venezuela
Winter Springs:
2.2% (97)
Florida:
5.7% (262,042)
Iran
Winter Springs:
2.1% (96)
Florida:
0.2% (11,000)
Brazil
Winter Springs:
2.1% (95)
Florida:
2.7% (122,906)
Jamaica
Winter Springs:
2.0% (90)
Florida:
5.0% (227,319)
Taiwan
Winter Springs:
2.0% (88)
Florida:
0.2% (8,002)
El Salvador
Winter Springs:
1.7% (76)
Florida:
1.1% (49,838)
Other Eastern Europe
Winter Springs:
1.7% (75)
Florida:
0.2% (9,990)
Place of birth for U.S.-born residents:
This state: 12,541
Other state: 19,002
Northeast: 8,225
Midwest: 4,520
South: 4,507
West: 1,633
90.2% of Winter Springs residents lived in the same house 1 years ago. Out of people who lived in different houses, 25.1% lived in this county. Out of people who lived in different counties, 65.5% lived in Florida.
Winter Springs:
90.2%
State average:
86.3%
Education attainment for males 25 years and older:
No schooling: 107
Nursery to 4th grade: 118
5th and 6th grade: 96
7th and 8th grade: 47
9th grade: 77
10th grade: 71
11th grade: 0
12th grade, no diploma: 126
High school graduate (or equivalency): 1,950
Less than 1 year of college: 1,039
Some college more than 1 year, no degree: 1,433
Associate degree: 1,735
Bachelor's degree: 5,064
Master's degree: 1,336
Professional school degree: 639
Doctorate degree: 514
Education attainment for females 25 years and older:
No schooling: 35
Nursery to 4th grade: 17
5th and 6th grade: 0
7th and 8th grade: 234
9th grade: 112
10th grade: 87
11th grade: 108
12th grade, no diploma: 57
High school graduate (or equivalency): 2,301
Less than 1 year of college: 2,116
Some college more than 1 year, no degree: 1,357
Associate degree: 1,832
Bachelor's degree: 3,812
Master's degree: 1,928
Professional school degree: 402
Doctorate degree: 239
Housing units in structures:
One, detached: 11,370
One, attached: 1,852
Two: 176
3 or 4: 571
5 to 9: 807
10 to 19: 564
20 to 49: 450
50 or more: 616
Mobile homes: 530
Median worth of mobile homes: $104,574
Housing units lacking complete plumbing facilities in 2022: 0.1%
Housing units lacking complete kitchen facilities in 2022: 0.4%
House/condo owner moved in on average 12 years ago