Winter Garden, FL (Florida) Houses and Residents
| Winter Garden: | $469,819 |
| Florida: | $354,100 |
Mean price in 2022:
Detached houses: $510,620
Here: $510,620 State: $500,941 Townhouses or other attached units: $313,280
Here: $313,280 State: $370,869 In 3-to-4-unit structures: $242,304
Here: $242,304 State: $309,944 In 5-or-more-unit structures: $83,113
Here: $83,113 State: $447,145 Mobile homes: $46,532
Here: $46,532 State: $113,202
Total population: 38,746 (Urban population: 13,517, Rural population: 482 (all nonfarm))
Houses: 16,586 (15,384 occupied: 11,543 owner occupied, 4,879 renter occupied)
| % of renters here: | 30% |
| State: | 33% |
Housing density: 1,376 houses/condos per square mile
Median price asked for vacant for-sale houses and condos in 2022: $633,824.
Median contract rent in 2022: $1,389 (lower quartile is $1,036, upper quartile is over $2,000)
Median rent asked for vacant for-rent units in 2022: $1,934
Median gross rent in Winter Garden, FL in 2022: $1,662
Housing units in Winter Garden with a mortgage: 7,746 (802 second mortgage, 16 home equity loan, 709 both second mortgage and home equity loan)
Houses without a mortgage: 33
Median household income for houses/condos with a mortgage: $131,359
Median household income for apartments without a mortgage: $79,130
Median monthly housing costs: $1,707
Compare current foreclosures in Winter Garden, FL:
| Photo | Address | Area | Beds / Baths | Price | Details |
|---|---|---|---|---|---|

|
#1
Largovista Dr
Winter Garden, FL 34787
|
4,475 sq. feet
|
3 baths 5 beds |
$649,900
|
show details |

|
#2
Eagle Ln
Winter Garden, FL 34787
|
1,260 sq. feet
|
2 baths 3 beds |
show details | |

|
#3
Beamleigh Rd
Winter Garden, FL 34787
|
1,345 sq. feet
|
2 baths 3 beds |
show details | |

|
#4
Hawkslade Ct
Winter Garden, FL 34787
|
1,886 sq. feet
|
3 baths 4 beds |
show details | |

|
#5
Portmoor Way
Winter Garden, FL 34787
|
1,719 sq. feet
|
2 baths 4 beds |
show details | |

|
#6
Country Cottage Ln
Winter Garden, FL 34787
|
3,069 sq. feet
|
2 baths 4 beds |
show details | |

|
#7
Avalon Woods Dr
Winter Garden, FL 34787
|
2,239 sq. feet
|
2 baths 3 beds |
show details | |

|
#8
Lincoln Ter
Winter Garden, FL 34787
|
814 sq. feet
|
1 baths 3 beds |
show details | |

|
#9
Daughtery Dr
Winter Garden, FL 34787
|
1,956 sq. feet
|
2 baths 4 beds |
show details | |

|
#10
N Circle Ct
Winter Garden, FL 34787
|
1,036 sq. feet
|
2 baths 3 beds |
show details |
| Photo | Address | Area | Beds / Baths | Price | Details |
|---|---|---|---|---|---|

|
#11
Doe Run Dr
Winter Garden, FL 34787
|
2,303 sq. feet
|
2 baths 4 beds |
show details | |

|
#12
Desiree Aurora St
Winter Garden, FL 34787
|
2,356 sq. feet
|
2 baths 4 beds |
show details | |

|
#13
Horstfield Dr
Winter Garden, FL 34787
|
1,225 sq. feet
|
2 baths 3 beds |
show details | |

|
#14
Eagle Ln
Winter Garden, FL 34787
|
938 sq. feet
|
2 baths 2 beds |
show details | |

|
#15
Bainbridge Loop
Winter Garden, FL 34787
|
2,256 sq. feet
|
2 baths 3 beds |
show details | |

|
#16
Black Springs Ln
Winter Garden, FL 34787
|
2,238 sq. feet
|
2 baths 3 beds |
show details | |

|
#17
Black Springs Ln
Winter Garden, FL 34787
|
2,238 sq. feet
|
2 baths 3 beds |
show details | |

|
#18
Hartsdale Dr
Winter Garden, FL 34787
|
1,182 sq. feet
|
2 baths 3 beds |
show details | |

|
#19
Scarlett Sage Ct
Winter Garden, FL 34787
|
2,543 sq. feet
|
3 baths 4 beds |
show details | |

|
#20
Balforn Tower Way
Winter Garden, FL 34787
|
1,572 sq. feet
|
2 baths 3 beds |
show details |
| Photo | Address | Area | Beds / Baths | Price | Details |
|---|---|---|---|---|---|

|
#21
Regina Cir
Winter Garden, FL 34787
|
2,360 sq. feet
|
2 baths 4 beds |
show details | |

|
#22
Glynshel Dr
Winter Garden, FL 34787
|
3,867 sq. feet
|
4 baths 4 beds |
show details | |

|
#23
Dharma Cir
Winter Garden, FL 34787
|
1,260 sq. feet
|
2 baths 3 beds |
show details | |

|
#24
Home Grove Dr
Winter Garden, FL 34787
|
3,774 sq. feet
|
4 baths 5 beds |
show details | |

|
#25
Fox Glove St
Winter Garden, FL 34787
|
2,122 sq. feet
|
2 baths 4 beds |
show details | |

|
#26
Daniels Cove Dr
Winter Garden, FL 34787
|
1,038 sq. feet
|
2 baths 3 beds |
show details | |

|
#27
Lindzlu St
Winter Garden, FL 34787
|
2,657 sq. feet
|
3 baths 4 beds |
show details | |

|
#28
Thornbury Ct
Winter Garden, FL 34787
|
2,410 sq. feet
|
3 baths 3 beds |
show details | |

|
#29
W Story Rd
Winter Garden, FL 34787
|
1,014 sq. feet
|
2 baths 3 beds |
show details | |

|
#30
Fox Glove St
Winter Garden, FL 34787
|
3,410 sq. feet
|
2 baths 4 beds |
show details |
| Photo | Address | Area | Beds / Baths | Price | Details |
|---|---|---|---|---|---|

|
#31
Daniels Landing Cir
Winter Garden, FL 34787
|
1,347 sq. feet
|
2 baths 2 beds |
show details | |

|
#32
Seidner Rd
Winter Garden, FL 34787
|
3,851 sq. feet
|
3 baths 4 beds |
show details | |

|
#33
Bahama Swallow Blvd
Winter Garden, FL 34787
|
1,704 sq. feet
|
2 baths 3 beds |
show details | |

|
#34
Setting Sun Dr
Winter Garden, FL 34787
|
1,994 sq. feet
|
2 baths 3 beds |
show details | |

|
#35
Prairie View Dr
Winter Garden, FL 34787
|
2,782 sq. feet
|
4 baths 5 beds |
show details | |

|
#36
Lost Grove Cir
Winter Garden, FL 34787
|
3,382 sq. feet
|
3 baths 5 beds |
show details | |

|
#37
Butter Oaks Ct
Winter Garden, FL 34787
|
2,884 sq. feet
|
2 baths 4 beds |
show details | |

|
#38
Gaulberry Run
Winter Garden, FL 34787
|
3,422 sq. feet
|
4 baths 4 beds |
show details | |

|
#39
Stucki Ter
Winter Garden, FL 34787
|
1,216 sq. feet
|
2 baths 3 beds |
show details | |

|
#40
Masthead Landing Cir
Winter Garden, FL 34787
|
2,027 sq. feet
|
2 baths 4 beds |
show details |
| Photo | Address | Area | Beds / Baths | Price | Details |
|---|---|---|---|---|---|

|
#41
Scarlet Oak Loop
Winter Garden, FL 34787
|
- sq. feet
|
- baths - beds |
show details | |

|
#42
Mclaren Aly
Winter Garden, FL 34787
|
- sq. feet
|
- baths - beds |
show details | |

|
#43
Book Club Rd
Winter Garden, FL 34787
|
- sq. feet
|
- baths - beds |
show details | |

|
#44
Lewis And Clark Ave
Winter Garden, FL 34787
|
- sq. feet
|
- baths - beds |
show details | |

|
#45
Lost Grove Cir
Winter Garden, FL 34787
|
- sq. feet
|
- baths - beds |
show details | |

|
#46
W Plant St
Winter Garden, FL 34787
|
- sq. feet
|
- baths - beds |
show details | |

|
#47
N Fullers Cross Rd
Winter Garden, FL 34787
|
- sq. feet
|
- baths - beds |
show details | |

|
#48
Pebble Ridge St
Winter Garden, FL 34787
|
- sq. feet
|
- baths - beds |
show details | |

|
#49
Waterleigh Cove Dr
Winter Garden, FL 34787
|
- sq. feet
|
- baths - beds |
show details | |

|
Check over 1 million property listings on Foreclosure.com!
|
browse all offers | |||


 | Homes and high schools in Windermere/Winter Garden/Dr.Phillips (9 replies) |
| Rental Homes Windermere/Winter Garden/Dr. Philips (13 replies) |
| Moving to Winter Garden/Windermere Area w/7th & 9th graders (2 replies) |
| apartment homes off of 27 in Clermont 34711 (4 replies) |
| Buying a home (Single, 35f, 2020 Edition) (29 replies) |
| No Fee Homes in Winter Garden (1 reply) |

Median year apartment built: 1998
Household type by relationship:
Households: 47,343- Male householders: 7,230 (898 living alone), Female householders: 7,818 (1,396 living alone)
9,261 spouses (9,150 opposite-sex spouses), 790 unmarried partners, (713 opposite-sex unmarried partners), 14,807 children (14,226 natural, 326 adopted, 253 stepchildren), 1,285 grandchildren, 1,128 brothers or sisters, 1,020 parents, 8 foster children, 1,347 other relatives, 1,992 non-relatives
- In group quarters: 652
Size of family households: 4,798 2-persons, 3,491 3-persons, 3,177 4-persons, 1,047 5-persons, 329 6-persons, 274 7-or-more-persons.
Size of nonfamily households: 2,534 1-person, 498 2-persons, 59 3-persons, 145 4-persons, 95 6-persons.
8,342 married couples with children.
2,482 single-parent households (1,062 men, 1,420 women).
73.4% of residents of Winter Garden speak English at home.
16.7% of residents speak Spanish at home (55% speak English very well, 11% speak English well, 11% speak English not well, 23% don't speak English at all).
6.0% of residents speak other Indo-European language at home (52% speak English very well, 27% speak English well, 21% speak English not well).
3.4% of residents speak Asian or Pacific Island language at home (59% speak English very well, 22% speak English well, 13% speak English not well, 6% don't speak English at all).
0.3% of residents speak other language at home (100% speak English very well).
Foreign born population: 10,944 (23.1%)
(49.6% of them are naturalized citizens)
| Here: | 7.5 |
| State: | 5.9 |
| Here: | 5.0 |
| State: | 4.2 |

- Bedrooms in owner-occupied houses and condos in Winter Garden, Florida
- 24no bedroom
- 831 bedroom
- 9922 bedrooms
- 3,6003 bedrooms
- 5,2064 bedrooms
- 1,6385+ bedrooms

- Bedrooms in renter-occupied apartments in Winter Garden, Florida
- 120no bedroom
- 3111 bedroom
- 1,6762 bedrooms
- 1,5883 bedrooms
- 1,0484 bedrooms
- 1365+ bedrooms

- Cars and other vehicles available in Winter Garden in owner-occupied houses/condos
- 108no vehicle
- 2,6181 vehicle
- 6,0242 vehicles
- 2,0163 vehicles
- 5444 vehicles
- 2335+ vehicles

- Cars and other vehicles available in Winter Garden in renter-occupied apartments
- 413no vehicle
- 2,0431 vehicle
- 1,3492 vehicles
- 3883 vehicles
- 6864 vehicles
- 05+ vehicles

- Rooms in owner-occupied houses in Winter Garden, Florida
- 01 room
- 292 rooms
- 1593 rooms
- 8674 rooms
- 1,2265 rooms
- 1,8076 rooms
- 1,7047 rooms
- 2,4018 rooms
- 3,3509+ rooms

- Rooms in renter-occupied apartments in Winter Garden, Florida
- 1201 room
- 1552 rooms
- 6063 rooms
- 1,1374 rooms
- 8765 rooms
- 8126 rooms
- 5117 rooms
- 1888 rooms
- 4739+ rooms


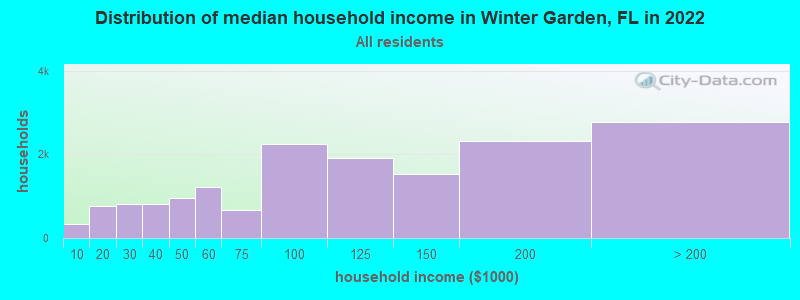
Winter Garden, FL household income distribution

- 340Less than $10,000
- 777$10,000 to $19,999
- 821$20,000 to $29,999
- 822$30,000 to $39,999
- 963$40,000 to $49,999
- 1,216$50,000 to $59,999
- 662$60,000 to $74,999
- 2,240$75,000 to $99,999
- 1,919$100,000 to $124,999
- 1,527$125,000 to $149,999
- 2,327$150,000 to $199,999
- 2,778$200,000 or more
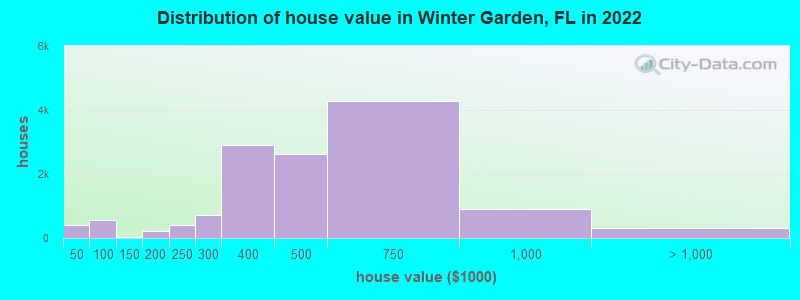
Home value of owner - occupied houses in 2022 in Winter Garden, FL
-
- 31Less than $10,000
- 82$20,000 to $24,999
- 35$30,000 to $34,999
- 115$35,000 to $39,999
- 155$40,000 to $49,999
- 66$50,000 to $59,999
- 236$60,000 to $69,999
- 6$70,000 to $79,999
- 51$80,000 to $89,999
- 58$90,000 to $99,999
- 15$100,000 to $124,999
- 4$125,000 to $149,999
- 108$150,000 to $174,999
- 115$175,000 to $199,999
- 393$200,000 to $249,999
- 721$250,000 to $299,999
- 2,892$300,000 to $399,999
- 2,620$400,000 to $499,999
- 4,280$500,000 to $749,999
- 894$750,000 to $999,999
- 248$1,000,000 to $1,499,999
- 58$1,500,000 to $1,999,999
- 6$2,000,000 or more
Rent paid by renters in 2022 in Winter Garden, FL
-
- 19Less than $100
- 43$150 to $199
- 87$300 to $349
- 65$500 to $549
- 46$550 to $599
- 14$600 to $649
- 28$650 to $699
- 7$700 to $749
- 47$750 to $799
- 305$800 to $899
- 334$900 to $999
- 901$1,000 to $1,249
- 269$1,250 to $1,499
- 1,087$1,500 to $1,999
- 820$2,000 to $2,499
- 551$2,500 to $2,999
- 67$3,000 to $3,499
- 47$3,500 or more
- 403No cash rent


Percentage of workers working in this county: 87.3%
Number of people working at home: 5,053 (21.2% of all workers)
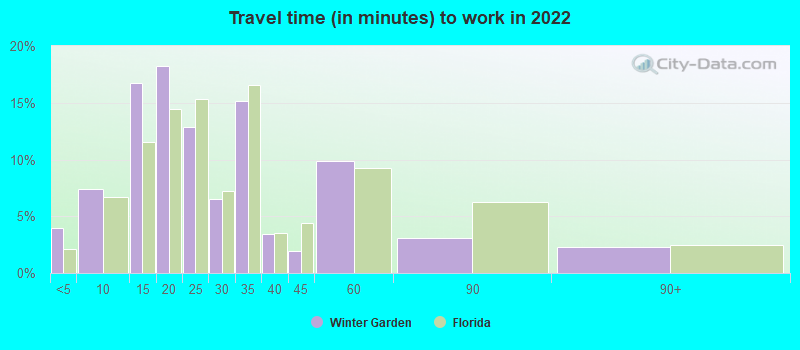
Travel time to work (commute)
- Less than 5 minutes: 642
- 5 to 9 minutes: 1,125
- 10 to 14 minutes: 2,762
- 15 to 19 minutes: 1,868
- 20 to 24 minutes: 1,704
- 25 to 29 minutes: 1,742
- 30 to 34 minutes: 4,738
- 35 to 39 minutes: 765
- 40 to 44 minutes: 1,001
- 45 to 59 minutes: 1,614
- 60 to 89 minutes: 500
- 90 or more minutes: 416
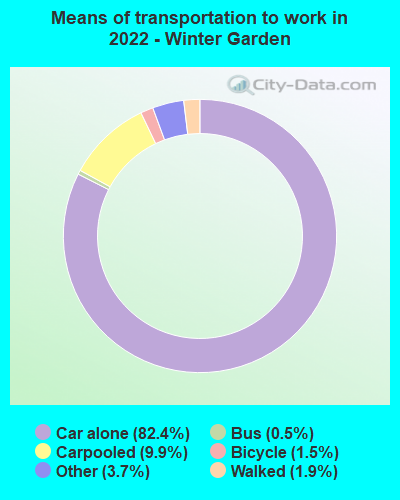
Means of transportation to work:
- Drove a car alone: 14,162 (64.8%)
- Carpooled: 1,813 (8.3%)
- Bus: 91 (0.4%)
- Taxi: 695 (3.2%)
- Bicycle: 178 (0.8%)
- Walked: 440 (2.0%)
- Worked at home: 5,053 (23.1%)

- Unemployment by race in 2022
- Unemployment rate for White non-Hispanic residents
- 5.3%Males
- 2.8%Females
- Unemployment rate for Black residents
- 9.2%Males
- 8.4%Females
- Unemployment rate for Asian residents
- 18.8%Males
- 13.3%Females
- Unemployment rate for other race residents
- 6.1%Females
- Unemployment rate for two or more race residents
- 3.4%Males
- 1.3%Females
- Unemployment rate for Hispanic or Latino residents
- 1.4%Males
- 4.0%Females

- Year of entry for the foreign-born population in Winter Garden, Florida
- 4,4202010 or later
- 2,5082000 to 2009
- 1,7151990 to 1999
- 2891980 to 1989
- 1161970 to 1979
- 153Before 1970

First ancestries reported:
- American: 7,454 (24.8%)
- English: 1,417 (4.7%)
- German: 1,030 (3.4%)
- Irish: 816 (2.7%)
- European: 770 (2.6%)
- African: 691 (2.3%)
- Italian: 622 (2.1%)
- Eastern European: 479 (1.6%)
- Brazilian: 401 (1.3%)
- Jamaican: 333 (1.1%)
- British: 329 (1.1%)
- Swiss: 227 (0.8%)
- Scottish: 223 (0.7%)
- Polish: 192 (0.6%)
- Guyanese: 187 (0.6%)
- Haitian: 177 (0.6%)
- Russian: 137 (0.5%)
- Norwegian: 115 (0.4%)
- West Indian: 111 (0.4%)
- Turkish: 102 (0.3%)
- Swedish: 81 (0.3%)
- Scotch-Irish: 61 (0.2%)
- Albanian: 55 (0.2%)
- Hungarian: 55 (0.2%)
- Slovak: 54 (0.2%)
- Dutch: 49 (0.2%)
- Yugoslavian: 42 (0.1%)
- Barbadian: 35 (0.1%)
- Bahamian: 34 (0.1%)
- Palestinian: 33 (0.1%)
- Belgian: 33 (0.1%)
- Ukrainian: 33 (0.1%)
- Czechoslovakian: 30 (0.10%)
- Scandinavian: 28 (0.09%)
- U.S. Virgin Islander: 25 (0.08%)
- Canadian: 23 (0.08%)
- Greek: 22 (0.07%)
- Portuguese: 19 (0.06%)
- Afghan: 16 (0.05%)
- Israeli: 15 (0.05%)
- Nigerian: 14 (0.05%)
- French Canadian: 13 (0.04%)
- Liberian: 13 (0.04%)
- Welsh: 10 (0.03%)
Most common places of birth for foreign-born residents (%):
| Winter Garden: | 11.7% (1,264) |
| Florida: | 0.7% (33,556) |
| Winter Garden: | 11.5% (1,244) |
| Florida: | 6.5% (298,669) |
| Winter Garden: | 11.5% (1,243) |
| Florida: | 5.6% (257,152) |
| Winter Garden: | 10.8% (1,164) |
| Florida: | 2.7% (122,906) |
| Winter Garden: | 7.5% (811) |
| Florida: | 5.7% (262,042) |
| Winter Garden: | 6.2% (666) |
| Florida: | 1.3% (60,604) |
| Winter Garden: | 6.0% (644) |
| Florida: | 5.0% (227,319) |
| Winter Garden: | 3.5% (372) |
| Florida: | 2.1% (94,349) |
| Winter Garden: | 3.2% (340) |
| Florida: | 1.2% (54,585) |
| Winter Garden: | 3.0% (319) |
| Florida: | 2.1% (97,632) |
| Winter Garden: | 2.3% (244) |
| Florida: | 1.2% (56,071) |
| Winter Garden: | 1.9% (209) |
| Florida: | 1.1% (49,838) |
| Winter Garden: | 1.8% (199) |
| Florida: | 2.1% (96,693) |
| Winter Garden: | 1.8% (196) |
| Florida: | 1.3% (57,263) |
| Winter Garden: | 1.7% (183) |
| Florida: | 0.1% (4,585) |
| Winter Garden: | 1.5% (167) |
| Florida: | 0.5% (22,972) |
Place of birth for U.S.-born residents:
- This state: 17,887
- Other state: 17,222
- Northeast: 6,800
- Midwest: 4,536
- South: 3,885
- West: 1,964
90.7% of Winter Garden residents lived in the same house 1 years ago.
Out of people who lived in different houses, 35.5% lived in this county.
Out of people who lived in different counties, 40.2% lived in Florida.
| Winter Garden: | 90.7% |
| State average: | 86.3% |
Education attainment for males 25 years and older:
- No schooling: 459
- Nursery to 4th grade: 54
- 5th and 6th grade: 173
- 7th and 8th grade: 486
- 9th grade: 60
- 10th grade: 106
- 11th grade: 133
- 12th grade, no diploma: 523
- High school graduate (or equivalency): 3,246
- Less than 1 year of college: 851
- Some college more than 1 year, no degree: 1,543
- Associate degree: 1,170
- Bachelor's degree: 4,280
- Master's degree: 1,758
- Professional school degree: 634
- Doctorate degree: 316

Education attainment for females 25 years and older:
- No schooling: 179
- Nursery to 4th grade: 171
- 5th and 6th grade: 30
- 7th and 8th grade: 252
- 9th grade: 14
- 10th grade: 163
- 11th grade: 73
- 12th grade, no diploma: 173
- High school graduate (or equivalency): 3,909
- Less than 1 year of college: 411
- Some college more than 1 year, no degree: 1,860
- Associate degree: 1,383
- Bachelor's degree: 4,848
- Master's degree: 2,085
- Professional school degree: 624
- Doctorate degree: 359


Housing units in structures:
- One, detached: 12,409
- One, attached: 1,563
- Two: 328
- 3 or 4: 327
- 5 to 9: 731
- 10 to 19: 373
- 20 to 49: 116
- 50 or more: 173
- Mobile homes: 544
- Boats, RVs, vans, etc.: 16
Median worth of mobile homes: $75,782
Housing units lacking complete kitchen facilities in 2022: 1.4%
House/condo owner moved in on average 7 years ago
Renter moved in on average 4 years ago

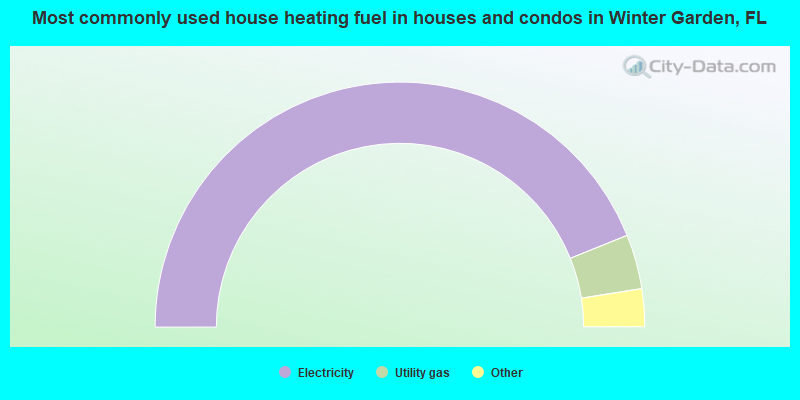
- 87.8%Electricity
- 7.2%Utility gas
- 2.0%Solar energy
- 2.0%No fuel used
- 1.1%Wood
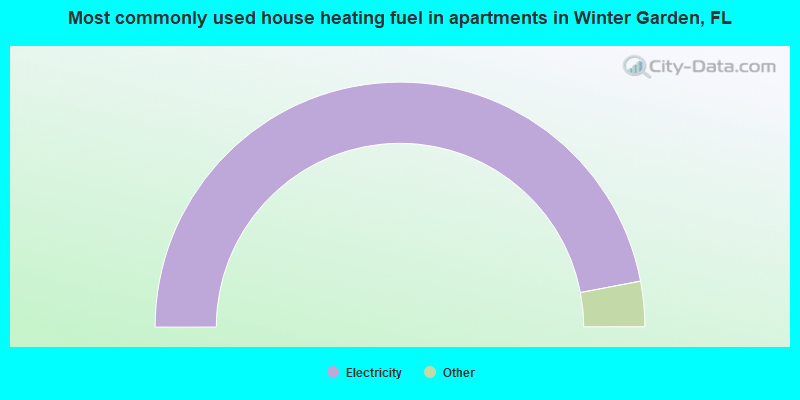
- 94.0%Electricity
- 2.5%Utility gas
- 2.1%No fuel used
- 1.4%Bottled, tank, or LP gas
Private vs. public school enrollment:
| Here: | 9.9% |
| Florida: | 15.8% |
| Here: | 11.5% |
| Florida: | 12.9% |
| Here: | 24.7% |
| Florida: | 23.6% |


