Windsor, VA (Virginia) Houses and Residents
| Windsor: | $242,688 |
| Virginia: | $365,700 |
Mean price in 2022:
Detached houses: $382,778
Here: $382,778 State: $472,865 Mobile homes: $32,877
Here: $32,877 State: $100,736
Total population: 2,654 (Urban population: 0, Rural population: 933 (all nonfarm))
Houses: 1,144 (1,093 occupied: 928 owner occupied, 176 renter occupied)
| % of renters here: | 16% |
| State: | 33% |
Housing density: 1,345 houses/condos per square mile
Median price asked for vacant for-sale houses and condos in 2022 in this county: $251,001.
Median gross rent in Windsor, VA in 2022: $-667,129,628
Housing units in Windsor with a mortgage: 504 (44 second mortgage, 0 home equity loan, 37 both second mortgage and home equity loan)
Houses without a mortgage: 23
Median household income for houses/condos with a mortgage: $85,617
Median household income for apartments without a mortgage: $54,370
Median monthly housing costs: $973
Compare current foreclosures near Windsor, VA:
| Photo | Address | Area | Beds / Baths | Price | Details |
|---|---|---|---|---|---|

|
#1
Collosse Rd
Windsor, VA 23487
|
1,782 sq. feet
|
2 baths 3 beds |
show details | |

|
#2
Old Mill Rd W
Windsor, VA 23487
|
1,036 sq. feet
|
1 baths 2 beds |
show details | |

|
#3
Trump Town Rd
Windsor, VA 23487
|
2,584 sq. feet
|
2 baths 3 beds |
show details | |

|
#4
Beale Dr
Windsor, VA 23487
|
- sq. feet
|
- baths - beds |
show details | |

|
#5
John Henry St
Windsor, VA 23487
|
- sq. feet
|
- baths - beds |
show details | |

|
#6
Dinky Cir
Windsor, VA 23487
|
- sq. feet
|
- baths - beds |
show details | |

|
#7
N Court St
Windsor, VA 23487
|
- sq. feet
|
- baths - beds |
show details | |

|
#8
N Court St
Windsor, VA 23487
|
- sq. feet
|
- baths - beds |
show details | |

|
#9
Chickadee Ln
Windsor, VA 23487
|
- sq. feet
|
- baths - beds |
show details | |

|
#10
Liberty Ave
Windsor, VA 23487
|
- sq. feet
|
- baths - beds |
show details |
| Photo | Address | Area | Beds / Baths | Price | Details |
|---|---|---|---|---|---|

|
#11
Bob White Rd
Windsor, VA 23487
|
- sq. feet
|
- baths - beds |
show details | |

|
#12
Vicksville Rd
Franklin, VA 23851
|
3,660 sq. feet
|
3 baths 5 beds |
$610,000
|
show details |

|
#13
White Marsh Rd
Suffolk, VA 23434
|
2,147 sq. feet
|
4 baths 4 beds |
show details | |

|
#14
Schooner Blvd
Suffolk, VA 23435
|
2,141 sq. feet
|
2 baths 3 beds |
show details | |

|
#15
Lipton Cir
Suffolk, VA 23434
|
2,789 sq. feet
|
2 baths 3 beds |
show details | |

|
#16
Robinhood Rd
Franklin, VA 23851
|
1,490 sq. feet
|
2 baths 3 beds |
show details | |

|
#17
Chestnut St
Suffolk, VA 23434
|
1,516 sq. feet
|
1 baths 3 beds |
show details | |

|
#18
Patricks Ct
Carrollton, VA 23314
|
3,263 sq. feet
|
3 baths 4 beds |
show details | |

|
#19
Meadowlot Ln
Suffolk, VA 23432
|
3,292 sq. feet
|
3 baths 4 beds |
show details | |

|
#20
Meadowlot Lane
Suffolk, VA 23432
|
3,292 sq. feet
|
2 baths 4 beds |
show details |
| Photo | Address | Area | Beds / Baths | Price | Details |
|---|---|---|---|---|---|

|
#21
Olde Mill Creek Dr
Suffolk, VA 23434
|
2,012 sq. feet
|
2 baths 4 beds |
show details | |

|
#22
Great Spring Rd
Smithfield, VA 23430
|
1,072 sq. feet
|
1 baths 3 beds |
show details | |

|
#23
Waterwheel Cres
Suffolk, VA 23434
|
2,088 sq. feet
|
2 baths 4 beds |
show details | |

|
#24
Goodman St
Suffolk, VA 23434
|
858 sq. feet
|
1 baths 2 beds |
show details | |

|
#25
Camero Ct
Suffolk, VA 23434
|
960 sq. feet
|
1 baths 4 beds |
show details | |

|
#26
Goodlin Dr
Suffolk, VA 23434
|
960 sq. feet
|
1 baths 3 beds |
show details | |

|
#27
Woods Trl
Franklin, VA 23851
|
2,030 sq. feet
|
2 baths 3 beds |
show details | |

|
#28
Barnes Rd
Suffolk, VA 23437
|
1,568 sq. feet
|
2 baths 4 beds |
show details | |

|
#29
Benns Church Blvd
Smithfield, VA 23430
|
1,334 sq. feet
|
1 baths 3 beds |
show details | |

|
#30
Haskins Dr
Suffolk, VA 23434
|
1,638 sq. feet
|
2 baths 4 beds |
show details |
| Photo | Address | Area | Beds / Baths | Price | Details |
|---|---|---|---|---|---|

|
#31
N Lloyd St
Suffolk, VA 23434
|
866 sq. feet
|
1 baths 3 beds |
show details | |

|
#32
Ferguson Pl
Suffolk, VA 23435
|
3,184 sq. feet
|
3 baths 5 beds |
show details | |

|
#33
Nansemond Pkwy
Suffolk, VA 23434
|
2,252 sq. feet
|
1 baths 3 beds |
show details | |

|
#34
Okelly Dr
Suffolk, VA 23437
|
2,000 sq. feet
|
2 baths 3 beds |
show details | |

|
#35
Scotts Factory Rd
Smithfield, VA 23430
|
960 sq. feet
|
1 baths 3 beds |
show details | |

|
#36
Winchester Pl
Smithfield, VA 23430
|
2,712 sq. feet
|
3 baths 4 beds |
show details | |

|
#37
Blythewood Ln
Suffolk, VA 23434
|
1,056 sq. feet
|
1 baths 4 beds |
show details | |

|
#38
Nansemond River Dr
Suffolk, VA 23435
|
3,171 sq. feet
|
3 baths 4 beds |
show details | |

|
#39
Ashwood Dr
Suffolk, VA 23434
|
3,154 sq. feet
|
3 baths 5 beds |
show details | |

|
#40
Quail Run Ct
Suffolk, VA 23434
|
2,459 sq. feet
|
2 baths 4 beds |
show details |
| Photo | Address | Area | Beds / Baths | Price | Details |
|---|---|---|---|---|---|

|
#41
Hosier Rd
Suffolk, VA 23434
|
1,096 sq. feet
|
1 baths 2 beds |
show details | |

|
#42
Ashwood Dr
Suffolk, VA 23434
|
3,014 sq. feet
|
3 baths 5 beds |
show details | |

|
#43
Bunch Ave
Suffolk, VA 23434
|
1,351 sq. feet
|
1 baths 3 beds |
show details | |

|
#44
Freeney Ave
Suffolk, VA 23434
|
952 sq. feet
|
1 baths 3 beds |
show details | |

|
#45
Word Ter
Suffolk, VA 23434
|
1,277 sq. feet
|
2 baths 3 beds |
show details | |

|
#46
Walnut St
Suffolk, VA 23434
|
1,422 sq. feet
|
1 baths 3 beds |
show details | |

|
#47
Riddick Cir
Suffolk, VA 23434
|
1,380 sq. feet
|
1 baths 3 beds |
show details | |

|
#48
Lake Kennedy Dr
Suffolk, VA 23434
|
1,136 sq. feet
|
1 baths 4 beds |
show details | |

|
#49
Truman Rd
Suffolk, VA 23434
|
1,277 sq. feet
|
1 baths 3 beds |
show details | |

|
Check over 1 million property listings on Foreclosure.com!
|
browse all offers | |||

Latest news about housing in Windsor, VA collected exclusively by city-data.com from local newspapers, TV, and radio stations

 | Single story stone houses (3 replies) |
| Alexandria Apartments - Cityside or Windsor (9 replies) |
| Where to find Tudor Style homes in Northern Virginia (26 replies) |
| Advice on Family Friendly Apartments in Fairfax City (18 replies) |
| Windsor Estates Alexandria? (9 replies) |
| Apartment information in Roanoke, VA ? (33 replies) |

Median year apartment built: 1971
Household type by relationship:
Households: 2,783- Male householders: 471 (138 living alone), Female householders: 612 (154 living alone)
506 spouses (506 opposite-sex spouses), 57 unmarried partners, (57 opposite-sex unmarried partners), 713 children (660 natural, 17 adopted, 36 stepchildren), 35 grandchildren, 84 brothers or sisters, 93 parents, 0 foster children, 6 other relatives, 80 non-relatives
- In group quarters: 122
Size of family households: 349 2-persons, 142 3-persons, 95 4-persons, 71 5-persons, 59 6-persons.
Size of nonfamily households: 301 1-person, 91 2-persons.
407 married couples with children.
182 single-parent households (2 men, 180 women).
92.6% of residents of Windsor speak English at home.
6.7% of residents speak Spanish at home (70% speak English very well, 16% speak English well, 14% speak English not well).
0.2% of residents speak other Indo-European language at home (100% speak English well).
0.4% of residents speak Asian or Pacific Island language at home (67% speak English well, 33% speak English not well).
Foreign born population: 98 (3.5%)
(26.5% of them are naturalized citizens)
| Here: | 6.5 |
| State: | 7.0 |
| Here: | 4.1 |
| State: | 4.3 |

- Bedrooms in owner-occupied houses and condos in Windsor, Virginia
- 0no bedroom
- 01 bedroom
- 1492 bedrooms
- 5483 bedrooms
- 1624 bedrooms
- 705+ bedrooms

- Bedrooms in renter-occupied apartments in Windsor, Virginia
- 0no bedroom
- 491 bedroom
- 862 bedrooms
- 343 bedrooms
- 34 bedrooms
- 45+ bedrooms

- Cars and other vehicles available in Windsor in owner-occupied houses/condos
- 16no vehicle
- 3031 vehicle
- 2932 vehicles
- 1913 vehicles
- 1174 vehicles
- 85+ vehicles

- Cars and other vehicles available in Windsor in renter-occupied apartments
- 17no vehicle
- 1151 vehicle
- 352 vehicles
- 03 vehicles
- 64 vehicles
- 35+ vehicles

- Rooms in owner-occupied houses in Windsor, Virginia
- 01 room
- 02 rooms
- 03 rooms
- 1134 rooms
- 1595 rooms
- 1896 rooms
- 1747 rooms
- 1098 rooms
- 1859+ rooms

- Rooms in renter-occupied apartments in Windsor, Virginia
- 01 room
- 262 rooms
- 93 rooms
- 754 rooms
- 365 rooms
- 06 rooms
- 207 rooms
- 118 rooms
- 09+ rooms


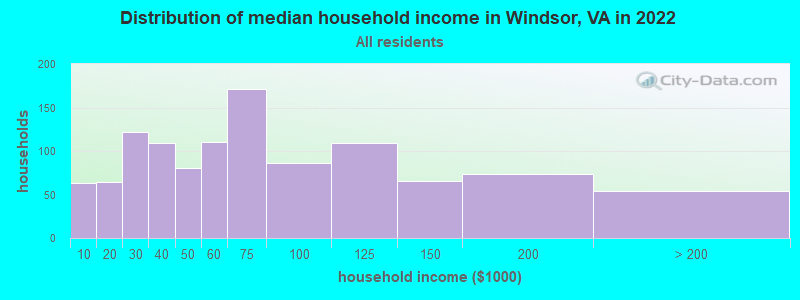
Windsor, VA household income distribution

- 63Less than $10,000
- 64$10,000 to $19,999
- 122$20,000 to $29,999
- 109$30,000 to $39,999
- 81$40,000 to $49,999
- 110$50,000 to $59,999
- 171$60,000 to $74,999
- 86$75,000 to $99,999
- 109$100,000 to $124,999
- 65$125,000 to $149,999
- 74$150,000 to $199,999
- 54$200,000 or more
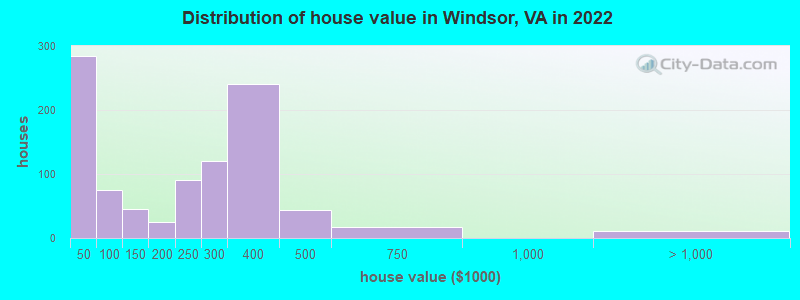
Home value of owner - occupied houses in 2022 in Windsor, VA
-
- 98Less than $10,000
- 52$10,000 to $14,999
- 4$15,000 to $19,999
- 24$20,000 to $24,999
- 53$25,000 to $29,999
- 17$30,000 to $34,999
- 8$35,000 to $39,999
- 24$40,000 to $49,999
- 19$50,000 to $59,999
- 11$70,000 to $79,999
- 19$80,000 to $89,999
- 38$100,000 to $124,999
- 6$125,000 to $149,999
- 24$175,000 to $199,999
- 89$200,000 to $249,999
- 121$250,000 to $299,999
- 240$300,000 to $399,999
- 42$400,000 to $499,999
- 17$500,000 to $749,999
- 11$2,000,000 or more
Rent paid by renters in 2022 in Windsor, VA
-
- 41Less than $100
- 3$100 to $149
- 17$150 to $199
- 2$250 to $299
- 3$550 to $599
- 0$700 to $749
- 19$750 to $799
- 6$800 to $899
- 27$900 to $999
- 9$1,000 to $1,249
- 2$1,250 to $1,499
- 28No cash rent

Percentage of workers working in this county: 33.2%
Number of people working at home: 52 (4.4% of all workers)
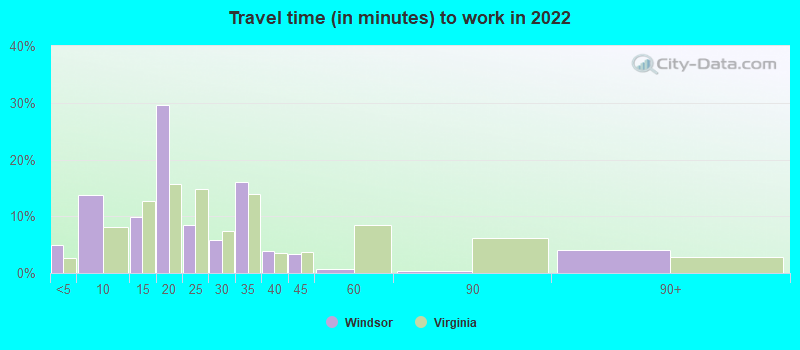
Travel time to work (commute)
- Less than 5 minutes: 55
- 5 to 9 minutes: 132
- 10 to 14 minutes: 26
- 15 to 19 minutes: 157
- 20 to 24 minutes: 94
- 25 to 29 minutes: 116
- 30 to 34 minutes: 91
- 35 to 39 minutes: 27
- 40 to 44 minutes: 52
- 45 to 59 minutes: 191
- 60 to 89 minutes: 102
- 90 or more minutes: 24
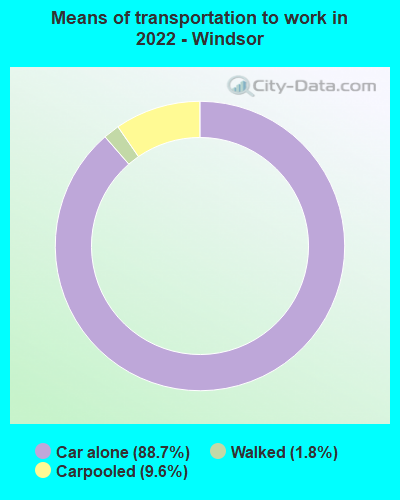
Means of transportation to work:
- Drove a car alone: 779 (80.8%)
- Carpooled: 85 (8.8%)
- Walked: 16 (1.7%)
- Worked at home: 52 (5.4%)
- Unemployment by race in 2022
- Unemployment rate for White non-Hispanic residents
- 1.8%Males
- Unemployment rate for Black residents
- 16.3%Males
- 19.9%Females
- Unemployment rate for two or more race residents
- 5.0%Females
- Unemployment rate for Hispanic or Latino residents
- 9.7%Females

- Year of entry for the foreign-born population in Windsor, Virginia
- 02010 or later
- 422000 to 2009
- 281990 to 1999
- 11980 to 1989
- 01970 to 1979
- 3Before 1970
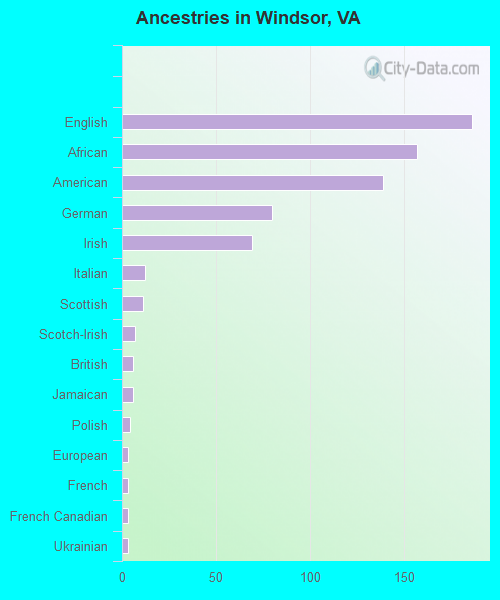
First ancestries reported:
- English: 186 (17.5%)
- African: 157 (14.8%)
- American: 139 (13.1%)
- German: 80 (7.5%)
- Irish: 69 (6.5%)
- Italian: 12 (1.1%)
- Scottish: 11 (1.0%)
- Scotch-Irish: 7 (0.7%)
- British: 6 (0.6%)
- Jamaican: 6 (0.6%)
- Polish: 4 (0.4%)
- European: 3 (0.3%)
- French: 3 (0.3%)
- French Canadian: 3 (0.3%)
- Ukrainian: 3 (0.3%)
Most common places of birth for foreign-born residents (%):
| Windsor: | 76.5% (75) |
| Virginia: | 5.3% (57,498) |
| Windsor: | 6.1% (6) |
| Virginia: | 3.9% (42,989) |
| Windsor: | 6.1% (6) |
| Virginia: | 1.0% (10,734) |
| Windsor: | 3.1% (3) |
| Virginia: | 2.4% (26,366) |
Place of birth for U.S.-born residents:
- This state: 1,772
- Other state: 849
- Northeast: 301
- Midwest: 82
- South: 396
- West: 68
84.9% of Windsor residents lived in the same house 1 years ago.
Out of people who lived in different houses, 25.9% lived in this county.
Out of people who lived in different counties, 97.0% lived in Virginia.
| Windsor: | 84.9% |
| State average: | 86.6% |
Education attainment for males 25 years and older:
- No schooling: 0
- Nursery to 4th grade: 0
- 5th and 6th grade: 4
- 7th and 8th grade: 3
- 9th grade: 21
- 10th grade: 5
- 11th grade: 8
- 12th grade, no diploma: 40
- High school graduate (or equivalency): 348
- Less than 1 year of college: 57
- Some college more than 1 year, no degree: 121
- Associate degree: 126
- Bachelor's degree: 74
- Master's degree: 21
- Professional school degree: 0
- Doctorate degree: 20

Education attainment for females 25 years and older:
- No schooling: 9
- Nursery to 4th grade: 0
- 5th and 6th grade: 0
- 7th and 8th grade: 8
- 9th grade: 21
- 10th grade: 2
- 11th grade: 26
- 12th grade, no diploma: 8
- High school graduate (or equivalency): 401
- Less than 1 year of college: 57
- Some college more than 1 year, no degree: 139
- Associate degree: 159
- Bachelor's degree: 153
- Master's degree: 28
- Professional school degree: 5
- Doctorate degree: 0


Housing units in structures:
- One, detached: 669
- Two: 19
- 5 to 9: 50
- 10 to 19: 22
- 20 to 49: 4
- Mobile homes: 378
Median worth of mobile homes: $25,951
House/condo owner moved in on average 8 years ago
Renter moved in on average 1 years ago

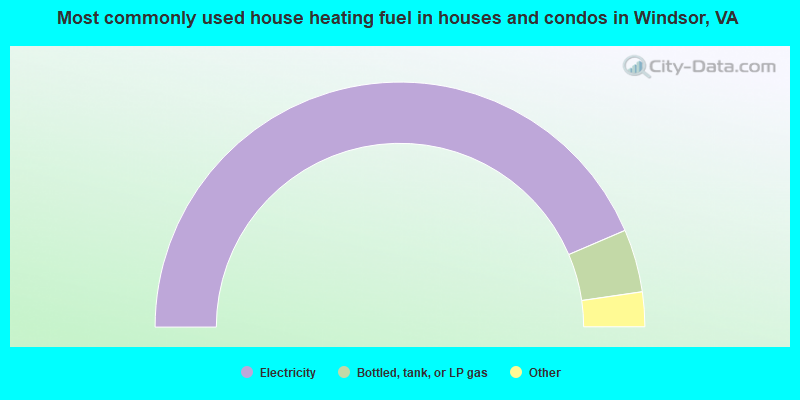
- 87.2%Electricity
- 8.3%Bottled, tank, or LP gas
- 3.4%Fuel oil, kerosene, etc.
- 1.1%No fuel used
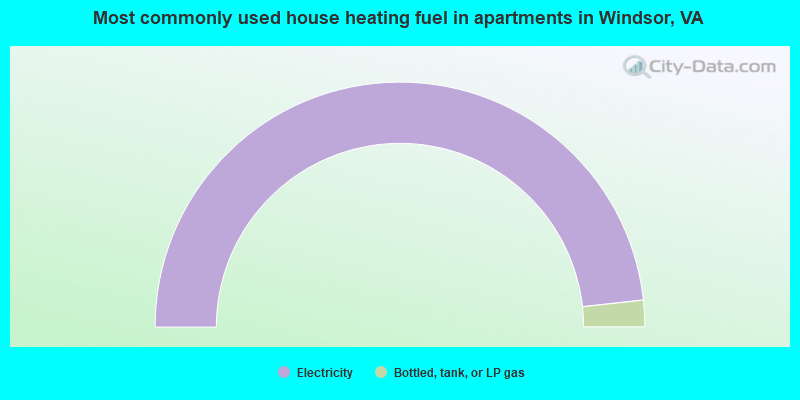
- 96.5%Electricity
- 3.5%Bottled, tank, or LP gas
Private vs. public school enrollment:
| Here: | 4.0% |
| Virginia: | 13.2% |
| Here: | 9.3% |
| Virginia: | 10.2% |
| Here: | 42.0% |
| Virginia: | 18.7% |


