Windsor, PA (Pennsylvania) Houses and Residents
| Windsor: | $167,636 |
| Pennsylvania: | $245,500 |
Mean price in 2022:
Detached houses: $176,222
Here: $176,222 State: $317,202 Townhouses or other attached units: $187,086
Here: $187,086 State: $254,369 Mobile homes: $50,432
Here: $50,432 State: $92,414
Total population: 1,474 (Urban population: 1,331, Rural population: 0)
Houses: 534 (465 occupied: 234 owner occupied, 239 renter occupied)
| % of renters here: | 51% |
| State: | 31% |
Housing density: 1,074 houses/condos per square mile
Median price asked for vacant for-sale houses and condos in 2022: $320,557.
Median contract rent in 2022: $891 (lower quartile is $687, upper quartile is $1,160)
Median rent asked for vacant for-rent units in 2022: $767
Median gross rent in Windsor, PA in 2022: $1,197
Housing units in Windsor with a mortgage: 170 (9 second mortgage, 0 home equity loan, 9 both second mortgage and home equity loan)
Houses without a mortgage: 14
Median household income for houses/condos with a mortgage: $88,503
Median household income for apartments without a mortgage: $50,842
Median monthly housing costs: $1,144
Compare current foreclosures near Windsor, PA:
| Photo | Address | Area | Beds / Baths | Price | Details |
|---|---|---|---|---|---|

|
#1
Thomas Armor Dr
Windsor, PA 17366
|
2,245 sq. feet
|
2 baths 4 beds |
show details | |

|
#2
Thomas Armor Dr
Windsor, PA 17366
|
2,385 sq. feet
|
2 baths 4 beds |
show details | |

|
#3
Craley Rd
Windsor, PA 17366
|
1,899 sq. feet
|
1 baths 3 beds |
show details | |

|
#4
E Main St
Windsor, PA 17366
|
- sq. feet
|
- baths - beds |
show details | |

|
#5
Gardenia Dr
Windsor, PA 17366
|
- sq. feet
|
- baths - beds |
show details | |

|
#6
Jasmine Rd
Delta, PA 17314
|
1,478 sq. feet
|
2 baths 3 beds |
show details | |

|
#7
Hudson Blvd
Red Lion, PA 17356
|
1,696 sq. feet
|
2 baths 3 beds |
show details | |

|
#8
Hub Ct
Dover, PA 17315
|
874 sq. feet
|
1 baths 2 beds |
show details | |

|
#9
Margate Rd
York, PA 17408
|
1,680 sq. feet
|
2 baths 3 beds |
show details | |

|
#10
Crossing Way
Manchester, PA 17345
|
1,094 sq. feet
|
1 baths 3 beds |
show details |
| Photo | Address | Area | Beds / Baths | Price | Details |
|---|---|---|---|---|---|

|
#11
Carea Rd
New Park, PA 17352
|
1,600 sq. feet
|
1 baths 3 beds |
show details | |

|
#12
Farmview Dr
York, PA 17408
|
1,680 sq. feet
|
1 baths 3 beds |
show details | |

|
#13
San Gabriel Dr
York, PA 17406
|
1,393 sq. feet
|
1 baths 3 beds |
show details | |

|
#14
Conewago Ave
Manchester, PA 17345
|
768 sq. feet
|
1 baths 2 beds |
show details | |

|
#15
Wolfs Church Rd
York, PA 17408
|
1,248 sq. feet
|
1 baths 3 beds |
show details | |

|
#16
S Salem Church Rd
York, PA 17408
|
2,256 sq. feet
|
2 baths 4 beds |
show details | |

|
#17
Manheim St
Mount Joy, PA 17552
|
1,100 sq. feet
|
1 baths 2 beds |
show details | |

|
#18
Grandview Cir
Mount Joy, PA 17552
|
1,060 sq. feet
|
1 baths 2 beds |
show details | |

|
#19
Meadow Cross Way
York, PA 17402
|
6,348 sq. feet
|
4 baths 5 beds |
show details | |

|
#20
Waltersdorff Rd
Spring Grove, PA 17362
|
1,937 sq. feet
|
2 baths 3 beds |
show details |
| Photo | Address | Area | Beds / Baths | Price | Details |
|---|---|---|---|---|---|

|
#21
Green Valley Rd
York, PA 17403
|
1,890 sq. feet
|
2 baths 4 beds |
show details | |

|
#22
Woodcrest Dr
Conestoga, PA 17516
|
1,624 sq. feet
|
1 baths 3 beds |
show details | |

|
#23
Main St
Felton, PA 17322
|
1,373 sq. feet
|
1 baths 3 beds |
show details | |

|
#24
Majestic Cir
Dallastown, PA 17313
|
2,140 sq. feet
|
2 baths 4 beds |
show details | |

|
#25
Park St
Dover, PA 17315
|
1,280 sq. feet
|
1 baths 3 beds |
show details | |

|
#26
Reservoir Dr
Dover, PA 17315
|
2,064 sq. feet
|
3 baths 3 beds |
show details | |

|
#27
Pulaski Pl
Dallastown, PA 17313
|
2,486 sq. feet
|
3 baths 4 beds |
show details | |

|
#28
School Ln
Landisville, PA 17538
|
1,560 sq. feet
|
2 baths 4 beds |
show details | |

|
#29
Cape Horn Rd
Red Lion, PA 17356
|
1,189 sq. feet
|
1 baths 3 beds |
show details | |

|
#30
Trout School Rd
Felton, PA 17322
|
1,920 sq. feet
|
1 baths 3 beds |
show details |
| Photo | Address | Area | Beds / Baths | Price | Details |
|---|---|---|---|---|---|

|
#31
Olde Field Dr
York, PA 17408
|
1,931 sq. feet
|
2 baths 4 beds |
show details | |

|
#32
Eagleton Dr
York, PA 17407
|
2,128 sq. feet
|
2 baths 4 beds |
show details | |

|
#33
N 3rd St
Columbia, PA 17512
|
1,449 sq. feet
|
1 baths 3 beds |
show details | |

|
#34
Cloverton Dr
Columbia, PA 17512
|
922 sq. feet
|
1 baths 2 beds |
show details | |

|
#35
Devers Rd
York, PA 17404
|
1,036 sq. feet
|
1 baths 3 beds |
show details | |

|
#36
Asbury Ct
Mount Wolf, PA 17347
|
1,904 sq. feet
|
2 baths 3 beds |
show details | |

|
#37
N Sherman Street Ext
Mount Wolf, PA 17347
|
1,813 sq. feet
|
2 baths 4 beds |
show details | |

|
#38
N George St
Emigsville, PA 17318
|
1,742 sq. feet
|
1 baths 5 beds |
show details | |

|
#39
Gatewood Dr
Shrewsbury, PA 17361
|
1,726 sq. feet
|
2 baths 3 beds |
show details | |

|
#40
Tanger St
Marietta, PA 17547
|
1,352 sq. feet
|
1 baths 3 beds |
show details |
| Photo | Address | Area | Beds / Baths | Price | Details |
|---|---|---|---|---|---|

|
#41
Cedar Ter
Columbia, PA 17512
|
1,065 sq. feet
|
1 baths 4 beds |
show details | |

|
#42
Liverpool Turnpike
Emigsville, PA 17318
|
1,776 sq. feet
|
2 baths 3 beds |
show details | |

|
#43
Carl St
York, PA 17404
|
1,042 sq. feet
|
1 baths 3 beds |
show details | |

|
#44
Madison Ave
York, PA 17404
|
1,612 sq. feet
|
1 baths 5 beds |
show details | |

|
#45
S Main St
York, PA 17408
|
- sq. feet
|
1 baths 4 beds |
show details | |

|
#46
Parkside Ct
Mount Joy, PA 17552
|
1,540 sq. feet
|
2 baths 3 beds |
show details | |

|
#47
S Royal St
York, PA 17401
|
968 sq. feet
|
1 baths 3 beds |
show details | |

|
#48
West George Street
York New Salem, PA 17371
|
1,128 sq. feet
|
3 baths 3 beds |
show details | |

|
#49
Winding Rd
York, PA 17408
|
1,340 sq. feet
|
1 baths 3 beds |
show details | |

|
Check over 1 million property listings on Foreclosure.com!
|
browse all offers | |||

Latest news about housing in Windsor, PA collected exclusively by city-data.com from local newspapers, TV, and radio stations

 | How different is Brooklyn from Philly? (184 replies) |
| Is Sewickley the most walkable small town near Pittsburgh? (68 replies) |
| Requesting Advice on Apartments in Bucks County (0 replies) |
| Pittsburgh Metro Automotive Manufacturing History (48 replies) |
| Best suburb of Pittsburgh (56 replies) |
| Main Line or West chester Townhomes (3 replies) |

Median year apartment built: 1940
Household type by relationship:
Households: 1,341- Male householders: 247 (76 living alone), Female householders: 216 (34 living alone)
155 spouses (155 opposite-sex spouses), 36 unmarried partners, (36 opposite-sex unmarried partners), 572 children (480 natural, 3 adopted, 89 stepchildren), 3 grandchildren, 3 brothers or sisters, 17 parents, 0 foster children, 19 other relatives, 59 non-relatives
- In group quarters: 11
Size of family households: 97 2-persons, 64 3-persons, 57 4-persons, 87 5-persons, 10 6-persons, 30 7-or-more-persons.
Size of nonfamily households: 112 1-person, 12 2-persons, 2 4-persons, 9 5-persons.
283 married couples with children.
128 single-parent households (21 men, 107 women).
96.3% of residents of Windsor speak English at home.
0.8% of residents speak Spanish at home (30% speak English very well, 70% speak English well).
1.4% of residents speak other Indo-European language at home (100% speak English very well).
Foreign born population: 11 (0.8%)
(0.0% of them are naturalized citizens)
| Here: | 6.4 |
| State: | 6.8 |
| Here: | 5.7 |
| State: | 4.3 |

- Bedrooms in owner-occupied houses and condos in Windsor, Pennsylvania
- 0no bedroom
- 61 bedroom
- 432 bedrooms
- 1233 bedrooms
- 604 bedrooms
- 35+ bedrooms

- Bedrooms in renter-occupied apartments in Windsor, Pennsylvania
- 0no bedroom
- 311 bedroom
- 642 bedrooms
- 653 bedrooms
- 774 bedrooms
- 25+ bedrooms

- Cars and other vehicles available in Windsor in owner-occupied houses/condos
- 3no vehicle
- 551 vehicle
- 902 vehicles
- 413 vehicles
- 154 vehicles
- 315+ vehicles

- Cars and other vehicles available in Windsor in renter-occupied apartments
- 20no vehicle
- 1861 vehicle
- 202 vehicles
- 93 vehicles
- 04 vehicles
- 55+ vehicles

- Rooms in owner-occupied houses in Windsor, Pennsylvania
- 01 room
- 02 rooms
- 33 rooms
- 154 rooms
- 485 rooms
- 586 rooms
- 437 rooms
- 288 rooms
- 399+ rooms

- Rooms in renter-occupied apartments in Windsor, Pennsylvania
- 01 room
- 02 rooms
- 293 rooms
- 354 rooms
- 495 rooms
- 306 rooms
- 867 rooms
- 28 rooms
- 89+ rooms


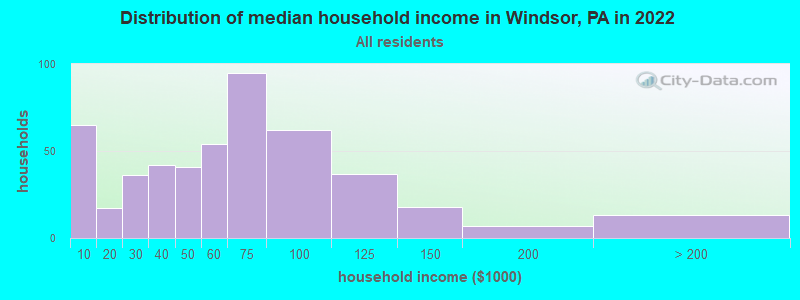
Windsor, PA household income distribution

- 65Less than $10,000
- 17$10,000 to $19,999
- 36$20,000 to $29,999
- 42$30,000 to $39,999
- 41$40,000 to $49,999
- 54$50,000 to $59,999
- 95$60,000 to $74,999
- 62$75,000 to $99,999
- 37$100,000 to $124,999
- 18$125,000 to $149,999
- 7$150,000 to $199,999
- 13$200,000 or more
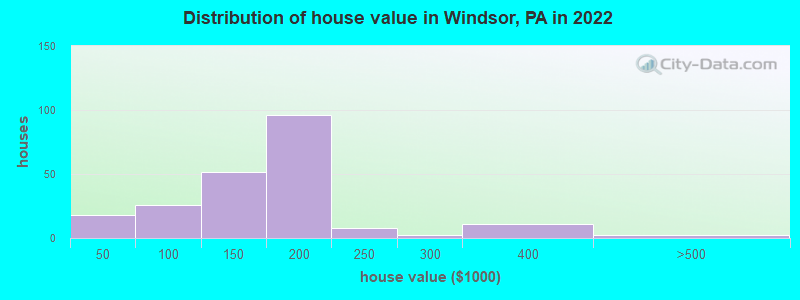
Home value of owner - occupied houses in 2022 in Windsor, PA
-
- 14$10,000 to $14,999
- 3$40,000 to $49,999
- 4$50,000 to $59,999
- 8$70,000 to $79,999
- 6$80,000 to $89,999
- 3$90,000 to $99,999
- 20$100,000 to $124,999
- 30$125,000 to $149,999
- 58$150,000 to $174,999
- 37$175,000 to $199,999
- 8$200,000 to $249,999
- 2$250,000 to $299,999
- 10$300,000 to $399,999
- 2$400,000 to $499,999
Rent paid by renters in 2022 in Windsor, PA
-
- 1$450 to $499
- 5$550 to $599
- 57$600 to $649
- 26$700 to $749
- 4$750 to $799
- 34$800 to $899
- 6$900 to $999
- 83$1,000 to $1,249
- 12$1,500 to $1,999


Percentage of workers working in this county: 84.6%
Number of people working at home: 17 (3.0% of all workers)
Travel time to work (commute)
- Less than 5 minutes: 7
- 5 to 9 minutes: 34
- 10 to 14 minutes: 90
- 15 to 19 minutes: 69
- 20 to 24 minutes: 149
- 25 to 29 minutes: 56
- 30 to 34 minutes: 35
- 35 to 39 minutes: 6
- 40 to 44 minutes: 12
- 45 to 59 minutes: 37
- 60 to 89 minutes: 32
- 90 or more minutes: 0
Means of transportation to work:
- Drove a car alone: 512 (79.9%)
- Carpooled: 91 (14.2%)
- Bus or trolley bus: 8 (1.2%)
- Bicycle: 7 (1.1%)
- Walked: 5 (0.8%)
- Other means: 8 (1.2%)
- Worked at home: 10 (1.6%)

- Unemployment by race in 2022
- Unemployment rate for White non-Hispanic residents
- 8.0%Males
- 7.0%Females
- Unemployment rate for Black residents
- 100.0%Females
- Unemployment rate for two or more race residents
- 39.3%Females

- Year of entry for the foreign-born population in Windsor, Pennsylvania
- 122010 or later
- 02000 to 2009
- 01990 to 1999
- 01980 to 1989
- 31970 to 1979
- 5Before 1970

First ancestries reported:
- American: 161 (22.6%)
- German: 111 (15.6%)
- Italian: 41 (5.8%)
- Russian: 33 (4.6%)
- Irish: 28 (3.9%)
- English: 21 (2.9%)
- Scottish: 21 (2.9%)
- Polish: 16 (2.2%)
- European: 13 (1.8%)
- French: 7 (1.0%)
- Scandinavian: 5 (0.7%)
- Dutch: 3 (0.4%)
- Ukrainian: 2 (0.3%)
- Swiss: 1 (0.1%)
Most common places of birth for foreign-born residents (%):
| Windsor: | 100.0% (10) |
| Pennsylvania: | 5.8% (54,190) |
Place of birth for U.S.-born residents:
- This state: 875
- Other state: 434
- Northeast: 95
- Midwest: 124
- South: 193
- West: 12
89.3% of Windsor residents lived in the same house 1 years ago.
Out of people who lived in different houses, 41.4% lived in this county.
Out of people who lived in different counties, 28.6% lived in Pennsylvania.
| Windsor: | 89.3% |
| State average: | 89.3% |
Education attainment for males 25 years and older:
- No schooling: 3
- Nursery to 4th grade: 0
- 5th and 6th grade: 0
- 7th and 8th grade: 41
- 9th grade: 6
- 10th grade: 4
- 11th grade: 4
- 12th grade, no diploma: 13
- High school graduate (or equivalency): 118
- Less than 1 year of college: 7
- Some college more than 1 year, no degree: 67
- Associate degree: 34
- Bachelor's degree: 42
- Master's degree: 30
- Professional school degree: 2
- Doctorate degree: 0

Education attainment for females 25 years and older:
- No schooling: 0
- Nursery to 4th grade: 0
- 5th and 6th grade: 0
- 7th and 8th grade: 10
- 9th grade: 12
- 10th grade: 6
- 11th grade: 5
- 12th grade, no diploma: 15
- High school graduate (or equivalency): 131
- Less than 1 year of college: 23
- Some college more than 1 year, no degree: 57
- Associate degree: 68
- Bachelor's degree: 14
- Master's degree: 13
- Professional school degree: 2
- Doctorate degree: 8


Housing units in structures:
- One, detached: 231
- One, attached: 167
- Two: 36
- 3 or 4: 34
- 5 to 9: 46
- 10 to 19: 13
- Mobile homes: 5
Housing units lacking complete kitchen facilities in 2022: 5.3%
House/condo owner moved in on average 13 years ago
Renter moved in on average 1 years ago

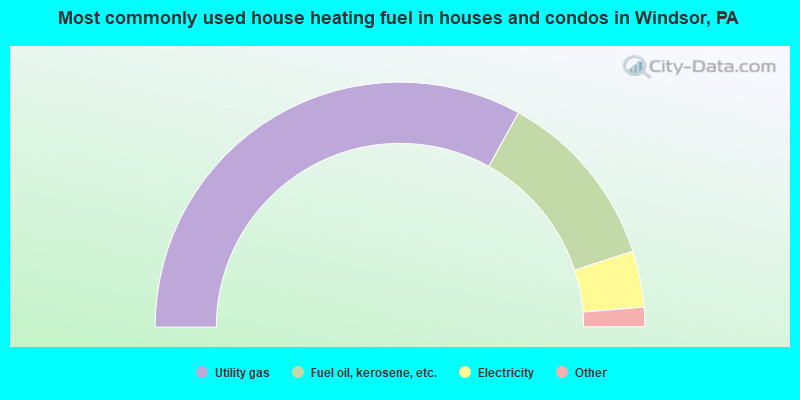
- 66.7%Utility gas
- 24.1%Fuel oil, kerosene, etc.
- 7.5%Electricity
- 0.9%Bottled, tank, or LP gas
- 0.9%Wood
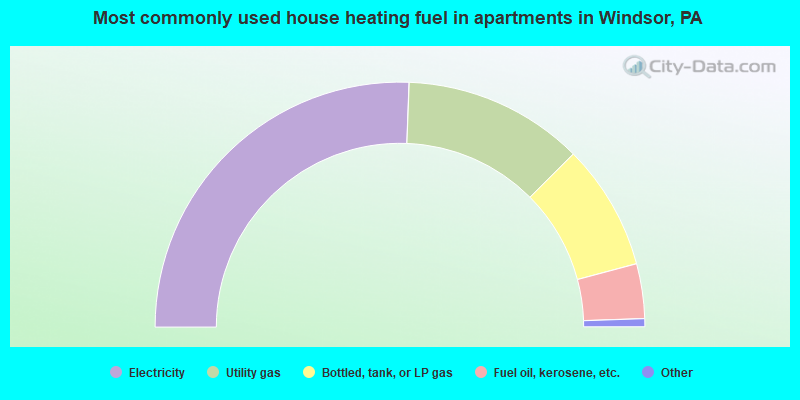
- 51.7%Electricity
- 24.1%Utility gas
- 16.8%Bottled, tank, or LP gas
- 7.3%Fuel oil, kerosene, etc.
Private vs. public school enrollment:
| Here: | 17.5% |
| Pennsylvania: | 15.7% |
| Here: | 2.6% |
| Pennsylvania: | 13.4% |
| Here: | 26.5% |
| Pennsylvania: | 39.8% |


