Wilsonville, OR (Oregon) Houses and Residents
| Wilsonville: | $633,085 |
| Oregon: | $475,600 |
Mean price in 2022:
Detached houses: $731,186
Here: $731,186 State: $562,872 Townhouses or other attached units: $528,700
Here: $528,700 State: $463,029 In 2-unit structures: $257,929
Here: $257,929 State: $505,105 In 3-to-4-unit structures: $692,084
Here: $692,084 State: $419,673 In 5-or-more-unit structures: $289,791
Here: $289,791 State: $420,389 Mobile homes: $18,051
Here: $18,051 State: $214,044
Total population: 22,026 (Urban population: 13,885, Rural population: 20 (all farm))
Houses: 11,231 (10,839 occupied: 5,468 owner occupied, 5,331 renter occupied)
| % of renters here: | 49% |
| State: | 37% |
Housing density: 1,674 houses/condos per square mile
Median price asked for vacant for-sale houses and condos in 2022: $942,517.
Median contract rent in 2022: $1,557 (lower quartile is $1,300, upper quartile is $1,928)
Median rent asked for vacant for-rent units in 2022: $2,151
Median gross rent in Wilsonville, OR in 2022: $1,716
Housing units in Wilsonville with a mortgage: 3,903 (402 second mortgage, 0 home equity loan, 370 both second mortgage and home equity loan)
Houses without a mortgage: 26
Median household income for houses/condos with a mortgage: $139,034
Median household income for apartments without a mortgage: $104,130
Median monthly housing costs: $1,745
Compare current foreclosures in Wilsonville, OR:
| Photo | Address | Area | Beds / Baths | Price | Details |
|---|---|---|---|---|---|

|
#1
SW Courtside Dr Apt 26
Wilsonville, OR 97070
|
- sq. feet
|
1 baths 1 beds |
show details | |

|
#2
SW Fallen Leaf St
Wilsonville, OR 97070
|
3,340 sq. feet
|
3 baths 4 beds |
show details | |

|
#3
SW Grahams Ferry Rd
Wilsonville, OR 97070
|
2,496 sq. feet
|
2 baths 3 beds |
show details | |

|
#4
SW Rose Ln
Wilsonville, OR 97070
|
3,685 sq. feet
|
2 baths 3 beds |
show details | |

|
#5
SW Elligsen Rd # 56
Wilsonville, OR 97070
|
1,350 sq. feet
|
2 baths 2 beds |
show details | |

|
#6
SW Edgewood Ct
Wilsonville, OR 97070
|
2,747 sq. feet
|
2 baths 4 beds |
show details | |

|
#7
SW Ash Meadows Blvd Apt 7
Wilsonville, OR 97070
|
1,240 sq. feet
|
1 baths 2 beds |
show details | |

|
#8
SW Vlahos Dr
Wilsonville, OR 97070
|
1,425 sq. feet
|
2 baths 3 beds |
show details | |

|
#9
SW Teton Way
Wilsonville, OR 97070
|
1,592 sq. feet
|
2 baths 3 beds |
show details | |

|
#10
SW Charbonneau Dr
Wilsonville, OR 97070
|
1,119 sq. feet
|
1 baths 2 beds |
show details |
| Photo | Address | Area | Beds / Baths | Price | Details |
|---|---|---|---|---|---|

|
#11
SW Rogue Ln Unit 4902
Wilsonville, OR 97070
|
- sq. feet
|
- baths - beds |
show details | |

|
#12
SW Wilsonville Rd Apt 138
Wilsonville, OR 97070
|
- sq. feet
|
- baths - beds |
show details | |

|
#13
SW Ash Meadows Rd Apt 218
Wilsonville, OR 97070
|
- sq. feet
|
- baths - beds |
show details | |

|
#14
SW Bailey St Apt 45
Wilsonville, OR 97070
|
- sq. feet
|
- baths - beds |
show details | |

|
#15
SW Ashland Dr, Apt 283
Wilsonville, OR 97070
|
- sq. feet
|
- baths - beds |
show details | |

|
#16
SW Rebekah St Unit 3209
Wilsonville, OR 97070
|
- sq. feet
|
- baths - beds |
show details | |

|
#17
SW Montebello Dr Apt 5
Wilsonville, OR 97070
|
- sq. feet
|
- baths - beds |
show details | |

|
#18
SW Wilsonville Rd Apt 8
Wilsonville, OR 97070
|
- sq. feet
|
- baths - beds |
show details | |

|
#19
SW Ash Meadows Cir Unit 834
Wilsonville, OR 97070
|
- sq. feet
|
- baths - beds |
show details | |

|
#20
SW Canyon Creek Rd N Apt I-103
Wilsonville, OR 97070
|
- sq. feet
|
- baths - beds |
show details |
| Photo | Address | Area | Beds / Baths | Price | Details |
|---|---|---|---|---|---|

|
#21
SW Brown Rd Apt 2
Wilsonville, OR 97070
|
- sq. feet
|
- baths - beds |
show details | |

|
#22
SW Villebois Dr N Apt 303
Wilsonville, OR 97070
|
- sq. feet
|
- baths - beds |
show details | |

|
#23
SW Rogue Ln Unit 5305
Wilsonville, OR 97070
|
- sq. feet
|
- baths - beds |
show details | |

|
#24
SW Berlin Ave
Wilsonville, OR 97070
|
- sq. feet
|
- baths - beds |
show details | |

|
#25
SW Canyon Creek Rd N Apt 103
Wilsonville, OR 97070
|
- sq. feet
|
- baths - beds |
show details | |

|
#26
SW Ashland Loop Apt 126
Wilsonville, OR 97070
|
- sq. feet
|
- baths - beds |
show details | |

|
#27
SW Boones Ferry Rd Unit 7
Wilsonville, OR 97070
|
- sq. feet
|
- baths - beds |
show details | |

|
#28
SW Ash Meadows Cir Unit 421
Wilsonville, OR 97070
|
- sq. feet
|
- baths - beds |
show details | |

|
#29
SW Alta Ct
Wilsonville, OR 97070
|
- sq. feet
|
- baths - beds |
show details | |

|
#30
SW Canyon Creek Rd N Apt Z203
Wilsonville, OR 97070
|
- sq. feet
|
- baths - beds |
show details |
| Photo | Address | Area | Beds / Baths | Price | Details |
|---|---|---|---|---|---|

|
#31
SW Berlin Ave
Wilsonville, OR 97070
|
- sq. feet
|
- baths - beds |
show details | |

|
#32
SW Vlahos Dr Apt 302
Wilsonville, OR 97070
|
- sq. feet
|
- baths - beds |
show details | |

|
#33
SW Ash Meadows Rd Apt 432
Wilsonville, OR 97070
|
- sq. feet
|
- baths - beds |
show details | |

|
#34
SW Ladd Hill Rd
Wilsonville, OR 97070
|
- sq. feet
|
- baths - beds |
show details | |

|
Check over 1 million property listings on Foreclosure.com!
|
browse all offers | |||

Latest news about housing in Wilsonville, OR collected exclusively by city-data.com from local newspapers, TV, and radio stations


Median year apartment built: 2000
Household type by relationship:
Households: 26,131- Male householders: 5,751 (1,077 living alone), Female householders: 4,919 (1,910 living alone)
4,890 spouses (4,790 opposite-sex spouses), 762 unmarried partners, (720 opposite-sex unmarried partners), 6,203 children (5,737 natural, 142 adopted, 322 stepchildren), 521 grandchildren, 299 brothers or sisters, 364 parents, 0 foster children, 223 other relatives, 920 non-relatives
- In group quarters: 1,274
Size of family households: 3,312 2-persons, 1,677 3-persons, 1,483 4-persons, 330 5-persons, 69 6-persons, 41 7-or-more-persons.
Size of nonfamily households: 2,977 1-person, 831 2-persons, 42 3-persons, 16 4-persons, 7 5-persons.
3,230 married couples with children.
1,150 single-parent households (345 men, 805 women).
86.1% of residents of Wilsonville speak English at home.
7.1% of residents speak Spanish at home (74% speak English very well, 18% speak English well, 7% speak English not well).
2.4% of residents speak other Indo-European language at home (58% speak English very well, 26% speak English well, 14% speak English not well, 2% don't speak English at all).
2.5% of residents speak Asian or Pacific Island language at home (49% speak English very well, 32% speak English well, 18% speak English not well, 1% don't speak English at all).
1.6% of residents speak other language at home (81% speak English very well, 1% speak English well, 17% speak English not well).
Foreign born population: 2,689 (10.3%)
(58.7% of them are naturalized citizens)
| Here: | 6.3 |
| State: | 6.2 |
| Here: | 3.9 |
| State: | 4.0 |

- Bedrooms in owner-occupied houses and condos in Wilsonville, Oregon
- 0no bedroom
- 401 bedroom
- 1,0072 bedrooms
- 2,5343 bedrooms
- 1,7454 bedrooms
- 1425+ bedrooms

- Bedrooms in renter-occupied apartments in Wilsonville, Oregon
- 280no bedroom
- 1,4061 bedroom
- 2,6282 bedrooms
- 8313 bedrooms
- 1634 bedrooms
- 235+ bedrooms

- Cars and other vehicles available in Wilsonville in owner-occupied houses/condos
- 28no vehicle
- 1,4261 vehicle
- 2,5772 vehicles
- 1,0763 vehicles
- 2674 vehicles
- 955+ vehicles

- Cars and other vehicles available in Wilsonville in renter-occupied apartments
- 620no vehicle
- 2,3481 vehicle
- 1,9802 vehicles
- 3223 vehicles
- 454 vehicles
- 175+ vehicles

- Rooms in owner-occupied houses in Wilsonville, Oregon
- 01 room
- 02 rooms
- 613 rooms
- 8684 rooms
- 9475 rooms
- 1,0586 rooms
- 9317 rooms
- 9908 rooms
- 6139+ rooms

- Rooms in renter-occupied apartments in Wilsonville, Oregon
- 2801 room
- 6652 rooms
- 1,1303 rooms
- 1,5664 rooms
- 9545 rooms
- 4096 rooms
- 1177 rooms
- 348 rooms
- 1769+ rooms


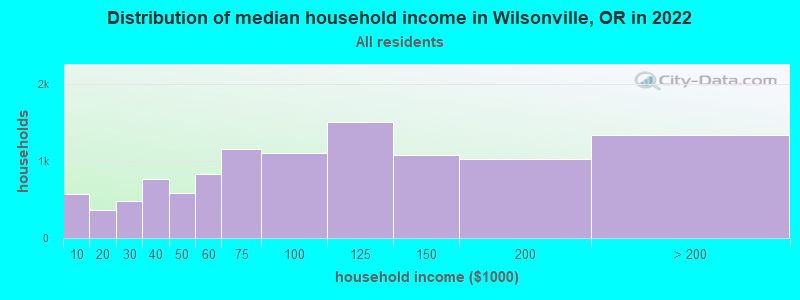
Wilsonville, OR household income distribution

- 570Less than $10,000
- 362$10,000 to $19,999
- 479$20,000 to $29,999
- 770$30,000 to $39,999
- 585$40,000 to $49,999
- 837$50,000 to $59,999
- 1,155$60,000 to $74,999
- 1,107$75,000 to $99,999
- 1,507$100,000 to $124,999
- 1,083$125,000 to $149,999
- 1,020$150,000 to $199,999
- 1,342$200,000 or more
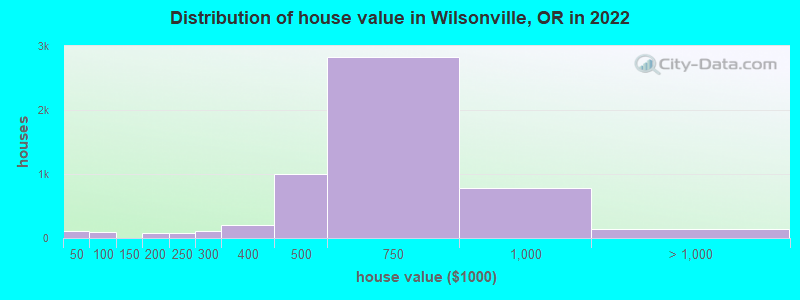
Home value of owner - occupied houses in 2022 in Wilsonville, OR
-
- 24Less than $10,000
- 30$10,000 to $14,999
- 19$20,000 to $24,999
- 12$25,000 to $29,999
- 24$30,000 to $34,999
- 6$35,000 to $39,999
- 29$50,000 to $59,999
- 35$70,000 to $79,999
- 18$80,000 to $89,999
- 15$90,000 to $99,999
- 32$150,000 to $174,999
- 50$175,000 to $199,999
- 80$200,000 to $249,999
- 108$250,000 to $299,999
- 209$300,000 to $399,999
- 998$400,000 to $499,999
- 2,834$500,000 to $749,999
- 788$750,000 to $999,999
- 102$1,000,000 to $1,499,999
- 41$2,000,000 or more
Rent paid by renters in 2022 in Wilsonville, OR
-
- 17$150 to $199
- 44$200 to $249
- 11$300 to $349
- 53$350 to $399
- 14$400 to $449
- 26$550 to $599
- 113$600 to $649
- 21$650 to $699
- 77$700 to $749
- 75$800 to $899
- 57$900 to $999
- 362$1,000 to $1,249
- 1,464$1,250 to $1,499
- 1,789$1,500 to $1,999
- 714$2,000 to $2,499
- 59$2,500 to $2,999
- 95$3,000 to $3,499
- 98$3,500 or more
- 106No cash rent


Percentage of workers working in this county: 56.8%
Number of people working at home: 2,112 (16.0% of all workers)
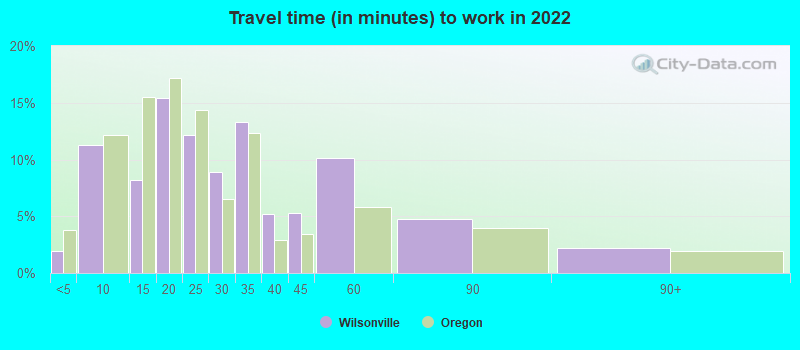
Travel time to work (commute)
- Less than 5 minutes: 256
- 5 to 9 minutes: 1,498
- 10 to 14 minutes: 1,026
- 15 to 19 minutes: 1,386
- 20 to 24 minutes: 1,874
- 25 to 29 minutes: 771
- 30 to 34 minutes: 1,501
- 35 to 39 minutes: 328
- 40 to 44 minutes: 752
- 45 to 59 minutes: 870
- 60 to 89 minutes: 442
- 90 or more minutes: 98
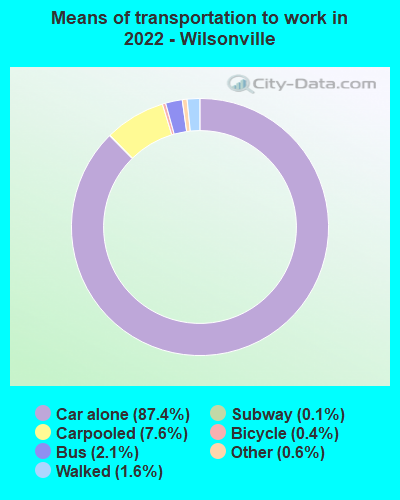
Means of transportation to work:
- Drove a car alone: 15,207 (74.2%)
- Carpooled: 1,277 (6.2%)
- Bus: 411 (2.0%)
- Long-distance train or commuter rail: 25 (0.1%)
- Light rail, streetcar or trolley: 26 (0.1%)
- Taxi: 102 (0.5%)
- Bicycle: 98 (0.5%)
- Walked: 361 (1.8%)
- Worked at home: 2,112 (10.3%)

- Unemployment by race in 2022
- Unemployment rate for White non-Hispanic residents
- 4.9%Males
- 2.2%Females
- Unemployment rate for Black residents
- 36.0%Males
- 37.7%Females
- Unemployment rate for Asian residents
- 1.7%Males
- 5.7%Females
- Unemployment rate for other race residents
- 15.8%Males
- Unemployment rate for two or more race residents
- 2.9%Males
- 3.7%Females
- Unemployment rate for Hispanic or Latino residents
- 2.4%Males
- 4.3%Females

- Year of entry for the foreign-born population in Wilsonville, Oregon
- 1,0352010 or later
- 9702000 to 2009
- 1911990 to 1999
- 2351980 to 1989
- 1171970 to 1979
- 191Before 1970

First ancestries reported:
- English: 1,548 (13.1%)
- German: 1,158 (9.8%)
- American: 852 (7.2%)
- Irish: 848 (7.2%)
- European: 620 (5.2%)
- Norwegian: 379 (3.2%)
- Italian: 237 (2.0%)
- Scandinavian: 211 (1.8%)
- Arab: 174 (1.5%)
- Dutch: 158 (1.3%)
- Scottish: 140 (1.2%)
- Swedish: 112 (0.9%)
- Polish: 108 (0.9%)
- French Canadian: 98 (0.8%)
- French: 75 (0.6%)
- Iranian: 73 (0.6%)
- Ukrainian: 68 (0.6%)
- Ethiopian: 59 (0.5%)
- Danish: 57 (0.5%)
- Czech: 56 (0.5%)
- British: 55 (0.5%)
- Russian: 47 (0.4%)
- Slovak: 28 (0.2%)
- Swiss: 23 (0.2%)
- Croatian: 21 (0.2%)
- Slavic: 21 (0.2%)
- Lithuanian: 20 (0.2%)
- Scotch-Irish: 20 (0.2%)
- Hungarian: 19 (0.2%)
- Finnish: 15 (0.1%)
- Lebanese: 14 (0.1%)
- Canadian: 11 (0.09%)
- New Zealander: 11 (0.09%)
- Eastern European: 9 (0.08%)
- Northern European: 8 (0.07%)
- Portuguese: 8 (0.07%)
- South African: 6 (0.05%)
- Romanian: 5 (0.04%)
- African: 3 (0.03%)
Most common places of birth for foreign-born residents (%):
| Wilsonville: | 20.7% (604) |
| Oregon: | 33.9% (140,109) |
| Wilsonville: | 8.0% (235) |
| Oregon: | 0.4% (1,562) |
| Wilsonville: | 6.3% (185) |
| Oregon: | 3.7% (15,229) |
| Wilsonville: | 5.6% (165) |
| Oregon: | 5.2% (21,429) |
| Wilsonville: | 5.4% (158) |
| Oregon: | 2.8% (11,450) |
| Wilsonville: | 4.9% (144) |
| Oregon: | 0.7% (2,927) |
| Wilsonville: | 4.5% (131) |
| Oregon: | 0.7% (3,094) |
| Wilsonville: | 3.3% (97) |
| Oregon: | 0.4% (1,690) |
| Wilsonville: | 3.3% (95) |
| Oregon: | 0.5% (1,921) |
| Wilsonville: | 3.1% (92) |
| Oregon: | 5.5% (22,563) |
| Wilsonville: | 3.0% (89) |
| Oregon: | 0.2% (640) |
| Wilsonville: | 2.7% (78) |
| Oregon: | 0.1% (306) |
| Wilsonville: | 2.5% (73) |
| Oregon: | 1.0% (4,122) |
| Wilsonville: | 2.4% (71) |
| Oregon: | 2.1% (8,469) |
| Wilsonville: | 2.2% (65) |
| Oregon: | 0.2% (866) |
| Wilsonville: | 2.1% (61) |
| Oregon: | 0.9% (3,555) |
| Wilsonville: | 2.0% (58) |
| Oregon: | 1.5% (6,259) |
| Wilsonville: | 1.9% (56) |
| Oregon: | 1.2% (5,082) |
| Wilsonville: | 1.8% (54) |
| Oregon: | 1.9% (8,005) |
Place of birth for U.S.-born residents:
- This state: 10,606
- Other state: 12,472
- Northeast: 899
- Midwest: 2,686
- South: 1,272
- West: 7,608
81.8% of Wilsonville residents lived in the same house 1 years ago.
Out of people who lived in different houses, 16.9% lived in this county.
Out of people who lived in different counties, 84.5% lived in Oregon.
| Wilsonville: | 81.8% |
| State average: | 85.5% |
Education attainment for males 25 years and older:
- No schooling: 73
- Nursery to 4th grade: 0
- 5th and 6th grade: 12
- 7th and 8th grade: 0
- 9th grade: 0
- 10th grade: 63
- 11th grade: 66
- 12th grade, no diploma: 124
- High school graduate (or equivalency): 1,838
- Less than 1 year of college: 712
- Some college more than 1 year, no degree: 900
- Associate degree: 496
- Bachelor's degree: 2,920
- Master's degree: 887
- Professional school degree: 477
- Doctorate degree: 169

Education attainment for females 25 years and older:
- No schooling: 199
- Nursery to 4th grade: 0
- 5th and 6th grade: 0
- 7th and 8th grade: 143
- 9th grade: 18
- 10th grade: 88
- 11th grade: 81
- 12th grade, no diploma: 80
- High school graduate (or equivalency): 2,137
- Less than 1 year of college: 748
- Some college more than 1 year, no degree: 1,506
- Associate degree: 909
- Bachelor's degree: 2,936
- Master's degree: 1,081
- Professional school degree: 249
- Doctorate degree: 199


Housing units in structures:
- One, detached: 4,611
- One, attached: 1,140
- Two: 115
- 3 or 4: 557
- 5 to 9: 1,369
- 10 to 19: 1,187
- 20 to 49: 489
- 50 or more: 1,607
- Mobile homes: 152
Housing units lacking complete kitchen facilities in 2022: 2.3%
House/condo owner moved in on average 7 years ago
Renter moved in on average 2 years ago

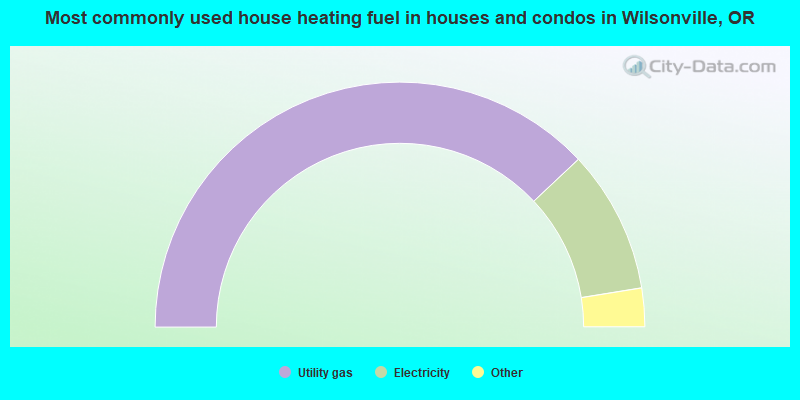
- 76.0%Utility gas
- 18.9%Electricity
- 2.3%Bottled, tank, or LP gas
- 1.5%Wood
- 1.0%Solar energy
- 0.3%Other fuel
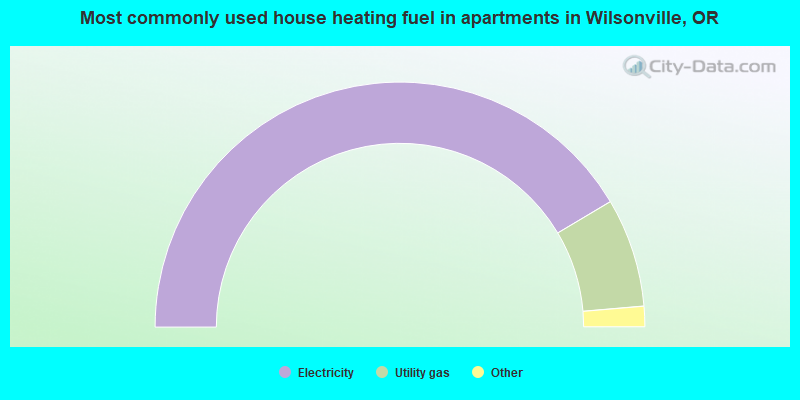
- 82.9%Electricity
- 14.4%Utility gas
- 2.4%Bottled, tank, or LP gas
- 0.2%No fuel used
Private vs. public school enrollment:
| Here: | 14.7% |
| Oregon: | 13.7% |
| Here: | 14.6% |
| Oregon: | 8.8% |
| Here: | 10.6% |
| Oregon: | 17.7% |


