Wichita Falls, TX (Texas) Houses and Residents
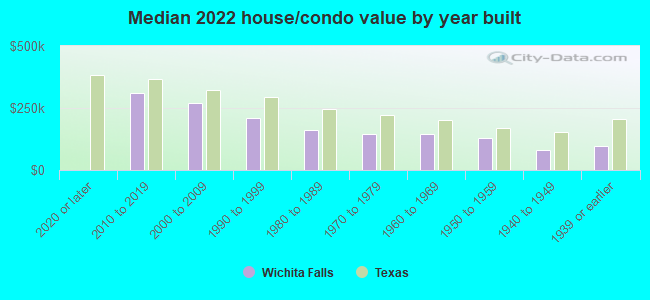
| Wichita Falls: | $148,900 |
| Texas: | $275,400 |
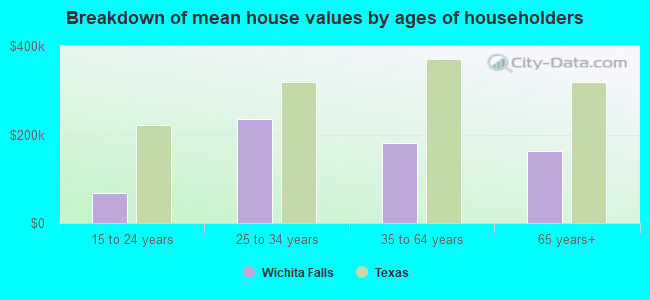
Mean price in 2022:
Detached houses: $211,338
Here: $211,338 State: $369,058 Townhouses or other attached units: $250,320
Here: $250,320 State: $327,631 In 2-unit structures: $127,797
Here: $127,797 State: $374,947 In 3-to-4-unit structures: $168,164
Here: $168,164 State: $209,652 In 5-or-more-unit structures: $204,957
Here: $204,957 State: $413,944 Mobile homes: $512,312
Here: $512,312 State: $124,413
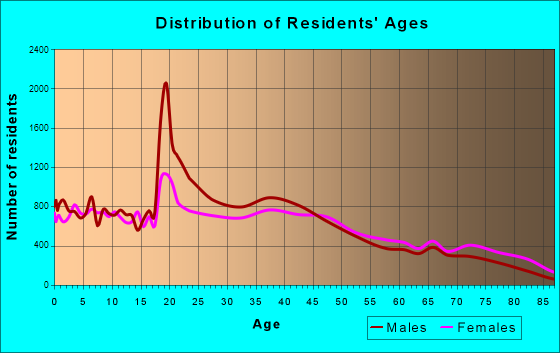
Total population: 105,114 (Urban population: 101,548 (97,922 inside urbanized areas, 3,626 inside urban clusters), Rural population: 2,373 (39 farm, 2,334 nonfarm))
Houses: 42,641 (38,057 occupied: 20,742 owner occupied, 17,315 renter occupied)
| % of renters here: | 45% |
| State: | 38% |
Housing density: 603 houses/condos per square mile
Median price asked for vacant for-sale houses and condos in 2022: $267,950.
Median contract rent in 2022: $761 (lower quartile is $617, upper quartile is $960)
Median rent asked for vacant for-rent units in 2022: $797
Median gross rent in Wichita Falls, TX in 2022: $965
Housing units in Wichita Falls with a mortgage: 11,431 (449 second mortgage, 0 home equity loan, 432 both second mortgage and home equity loan)
Houses without a mortgage: 227
Median household income for houses/condos with a mortgage: $97,471
Median household income for apartments without a mortgage: $59,864
Median monthly housing costs: $969
Compare current foreclosures in Wichita Falls, TX:
| Photo | Address | Area | Beds / Baths | Price | Details |
|---|---|---|---|---|---|

|
#1
Country Holw
Wichita Falls, TX 76310
|
1,918 sq. feet
|
2 baths 3 beds |
$184,900
|
show details |

|
#2
Garfield St
Wichita Falls, TX 76308
|
970 sq. feet
|
1 baths 2 beds |
show details | |

|
#3
Deer Park Way
Wichita Falls, TX 76306
|
1,198 sq. feet
|
2 baths 3 beds |
show details | |

|
#4
Gladiolus St
Wichita Falls, TX 76301
|
1,974 sq. feet
|
3 baths 4 beds |
show details | |

|
#5
Hursh Ave
Wichita Falls, TX 76302
|
1,674 sq. feet
|
2 baths 3 beds |
show details | |

|
#6
Seymour Rd
Wichita Falls, TX 76309
|
4,227 sq. feet
|
4 baths 4 beds |
show details | |

|
#7
Ecleto Blvd
Wichita Falls, TX 76308
|
1,563 sq. feet
|
2 baths 3 beds |
show details | |

|
#8
K Mart Dr
Wichita Falls, TX 76308
|
1,443 sq. feet
|
2 baths 3 beds |
show details | |

|
#9
Taylor St
Wichita Falls, TX 76309
|
925 sq. feet
|
1 baths 2 beds |
show details | |

|
#10
Amherst Dr
Wichita Falls, TX 76308
|
2,465 sq. feet
|
3 baths 4 beds |
show details |
| Photo | Address | Area | Beds / Baths | Price | Details |
|---|---|---|---|---|---|

|
#11
Westward Dr
Wichita Falls, TX 76308
|
1,428 sq. feet
|
1 baths 3 beds |
show details | |

|
#12
Geronimo Dr
Wichita Falls, TX 76310
|
1,675 sq. feet
|
2 baths 3 beds |
show details | |

|
#13
Elizabeth Ave
Wichita Falls, TX 76301
|
1,304 sq. feet
|
1 baths 2 beds |
show details | |

|
#14
El Capitan Dr
Wichita Falls, TX 76310
|
2,052 sq. feet
|
2 baths 3 beds |
show details | |

|
#15
Jenney Lee Dr
Wichita Falls, TX 76302
|
1,761 sq. feet
|
2 baths 3 beds |
show details | |

|
#16
Fillmore St
Wichita Falls, TX 76309
|
1,512 sq. feet
|
2 baths 4 beds |
show details | |

|
#17
Colquit Rd
Wichita Falls, TX 76309
|
720 sq. feet
|
1 baths 2 beds |
show details | |

|
#18
Buchanan St
Wichita Falls, TX 76308
|
1,484 sq. feet
|
1 baths 3 beds |
show details | |

|
#19
Kingston Dr
Wichita Falls, TX 76310
|
1,650 sq. feet
|
2 baths 3 beds |
show details | |

|
#20
Reilly Rd
Wichita Falls, TX 76306
|
1,452 sq. feet
|
2 baths 3 beds |
show details |
| Photo | Address | Area | Beds / Baths | Price | Details |
|---|---|---|---|---|---|

|
#21
Grandview W
Wichita Falls, TX 76306
|
2,755 sq. feet
|
2 baths 4 beds |
show details | |

|
#22
Smoke Rise Cir
Wichita Falls, TX 76306
|
1,211 sq. feet
|
2 baths 3 beds |
show details | |

|
#23
Canberra Dr
Wichita Falls, TX 76308
|
1,904 sq. feet
|
2 baths 3 beds |
show details | |

|
#24
Mcniel Ave
Wichita Falls, TX 76308
|
1,499 sq. feet
|
2 baths 3 beds |
show details | |

|
#25
Bullington St
Wichita Falls, TX 76301
|
1,698 sq. feet
|
2 baths 3 beds |
show details | |

|
#26
Glenhaven Dr
Wichita Falls, TX 76306
|
1,075 sq. feet
|
2 baths 3 beds |
show details | |

|
#27
Lavell Ave
Wichita Falls, TX 76308
|
886 sq. feet
|
1 baths 2 beds |
show details | |

|
#28
Misty Vly W
Wichita Falls, TX 76310
|
1,704 sq. feet
|
2 baths 4 beds |
show details | |

|
#29
Hanover Rd
Wichita Falls, TX 76302
|
1,790 sq. feet
|
2 baths 3 beds |
show details | |

|
#30
Glendale Dr
Wichita Falls, TX 76302
|
1,500 sq. feet
|
2 baths 3 beds |
show details |
| Photo | Address | Area | Beds / Baths | Price | Details |
|---|---|---|---|---|---|

|
#31
Stanford Ave
Wichita Falls, TX 76308
|
1,503 sq. feet
|
2 baths 3 beds |
show details | |

|
#32
Blazing Star Ct
Wichita Falls, TX 76310
|
1,292 sq. feet
|
2 baths 3 beds |
show details | |

|
#33
Seabury Dr
Wichita Falls, TX 76308
|
1,232 sq. feet
|
2 baths 2 beds |
show details | |

|
#34
Belmount Dr
Wichita Falls, TX 76308
|
1,558 sq. feet
|
2 baths 3 beds |
show details | |

|
#35
Sabota Ave
Wichita Falls, TX 76310
|
1,658 sq. feet
|
2 baths 3 beds |
show details | |

|
#36
Fm 1177
Wichita Falls, TX 76305
|
1,943 sq. feet
|
2 baths 4 beds |
show details | |

|
#37
Avenue J
Wichita Falls, TX 76309
|
1,010 sq. feet
|
1 baths 2 beds |
show details | |

|
#38
Seymour Rd
Wichita Falls, TX 76309
|
1,598 sq. feet
|
2 baths 4 beds |
show details | |

|
#39
Mesquite St
Wichita Falls, TX 76302
|
2,572 sq. feet
|
2 baths 3 beds |
show details | |

|
#40
Dayton Ave
Wichita Falls, TX 76301
|
1,202 sq. feet
|
1 baths 2 beds |
show details |
| Photo | Address | Area | Beds / Baths | Price | Details |
|---|---|---|---|---|---|

|
#41
Ardath Ave
Wichita Falls, TX 76301
|
1,411 sq. feet
|
3 baths 3 beds |
show details | |

|
#42
Ardath Ave
Wichita Falls, TX 76301
|
1,330 sq. feet
|
2 baths 3 beds |
show details | |

|
#43
Hughes Dr
Wichita Falls, TX 76308
|
1,425 sq. feet
|
2 baths 4 beds |
show details | |

|
#44
Cape Cod Dr
Wichita Falls, TX 76310
|
1,080 sq. feet
|
2 baths 3 beds |
show details | |

|
#45
Mcgaha Ave
Wichita Falls, TX 76308
|
840 sq. feet
|
1 baths 2 beds |
show details | |

|
#46
Newsom Cir
Wichita Falls, TX 76308
|
1,125 sq. feet
|
1 baths 2 beds |
show details | |

|
#47
Crescent Ln
Wichita Falls, TX 76306
|
1,261 sq. feet
|
2 baths 3 beds |
show details | |

|
#48
Avalon Pl
Wichita Falls, TX 76306
|
1,538 sq. feet
|
2 baths 3 beds |
show details | |

|
#49
Sheridan Rd
Wichita Falls, TX 76302
|
1,868 sq. feet
|
2 baths 2 beds |
show details | |

|
Check over 1 million property listings on Foreclosure.com!
|
browse all offers | |||


 | Wichita Falls Apartments (4 replies) |
| Wichita Falls Welcome Package (11 replies) |
| If Celina is 'next Frisco' (35 replies) |
| Wichita Falls TX Real Estate (3 replies) |
| Coronavirus in Texas (main thread) (428 replies) |
| Am I being realistic? On the great home hunt for McKinney/Allen/Frisco etc (75 replies) |
Median year apartment built: 1977
Household type by relationship:
Households: 102,659- Male householders: 19,084 (6,995 living alone), Female householders: 18,973 (5,202 living alone)
15,209 spouses (14,881 opposite-sex spouses), 2,687 unmarried partners, (2,239 opposite-sex unmarried partners), 26,226 children (23,170 natural, 889 adopted, 2,167 stepchildren), 1,494 grandchildren, 1,141 brothers or sisters, 1,052 parents, 0 foster children, 1,956 other relatives, 3,005 non-relatives
- In group quarters: 11,832
Size of family households: 11,490 2-persons, 5,651 3-persons, 3,564 4-persons, 2,142 5-persons, 546 6-persons, 384 7-or-more-persons.
Size of nonfamily households: 12,197 1-person, 2,010 2-persons, 50 3-persons, 23 4-persons.
10,414 married couples with children.
9,836 single-parent households (1,963 men, 7,873 women).
85.0% of residents of Wichita Falls speak English at home.
11.0% of residents speak Spanish at home (70% speak English very well, 19% speak English well, 9% speak English not well, 2% don't speak English at all).
1.2% of residents speak other Indo-European language at home (76% speak English very well, 13% speak English well, 12% speak English not well).
1.9% of residents speak Asian or Pacific Island language at home (67% speak English very well, 19% speak English well, 13% speak English not well, 1% don't speak English at all).
0.8% of residents speak other language at home (90% speak English very well, 10% speak English well).
Foreign born population: 6,121 (6.0%)
(44.0% of them are naturalized citizens)
| Here: | 6.1 |
| State: | 6.3 |
| Here: | 4.1 |
| State: | 4.0 |
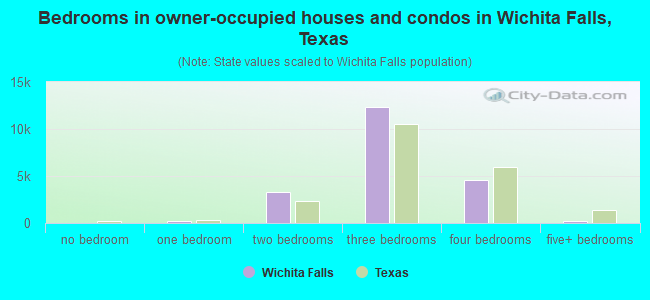
- Bedrooms in owner-occupied houses and condos in Wichita Falls, Texas
- 36no bedroom
- 2361 bedroom
- 3,2902 bedrooms
- 12,3813 bedrooms
- 4,5954 bedrooms
- 2045+ bedrooms
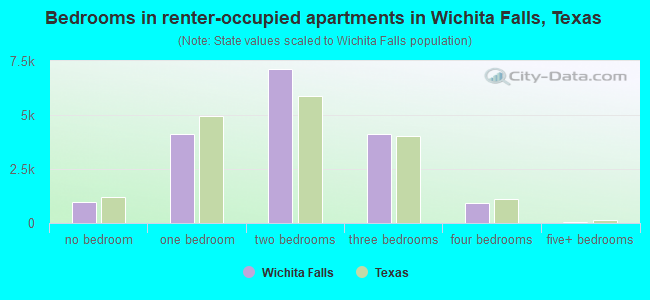
- Bedrooms in renter-occupied apartments in Wichita Falls, Texas
- 975no bedroom
- 4,1031 bedroom
- 7,1282 bedrooms
- 4,1383 bedrooms
- 9394 bedrooms
- 325+ bedrooms
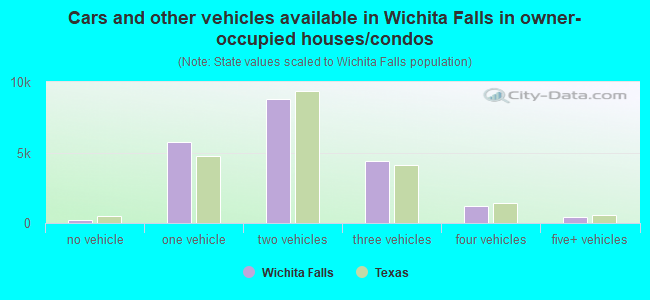
- Cars and other vehicles available in Wichita Falls in owner-occupied houses/condos
- 230no vehicle
- 5,7491 vehicle
- 8,7782 vehicles
- 4,3773 vehicles
- 1,1994 vehicles
- 4095+ vehicles
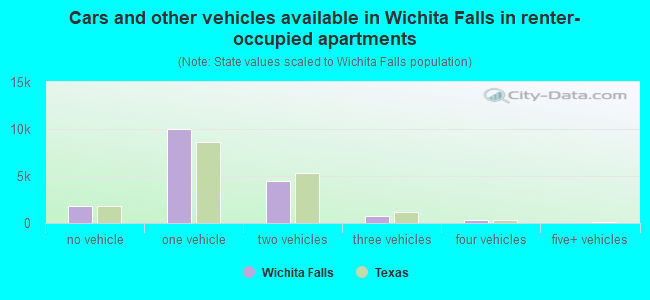
- Cars and other vehicles available in Wichita Falls in renter-occupied apartments
- 1,784no vehicle
- 10,0131 vehicle
- 4,4412 vehicles
- 7883 vehicles
- 2894 vehicles
- 05+ vehicles
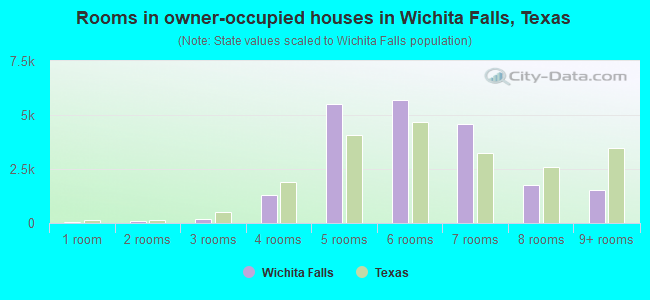
- Rooms in owner-occupied houses in Wichita Falls, Texas
- 361 room
- 982 rooms
- 2073 rooms
- 1,2884 rooms
- 5,5095 rooms
- 5,7106 rooms
- 4,6067 rooms
- 1,7578 rooms
- 1,5319+ rooms
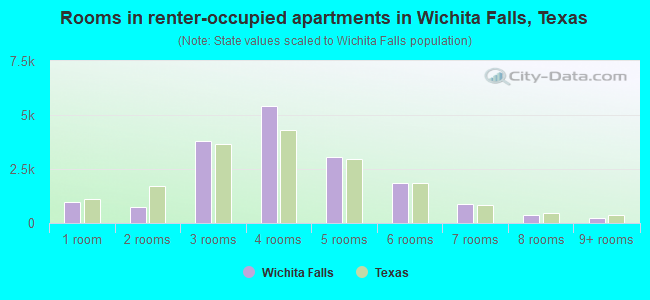
- Rooms in renter-occupied apartments in Wichita Falls, Texas
- 9751 room
- 7582 rooms
- 3,7783 rooms
- 5,4004 rooms
- 3,0715 rooms
- 1,8686 rooms
- 8597 rooms
- 3658 rooms
- 2419+ rooms
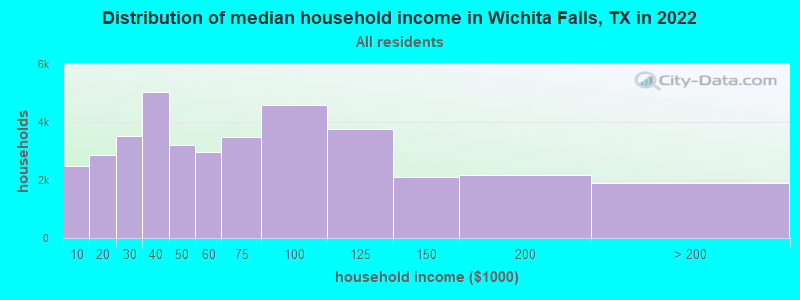
Wichita Falls, TX household income distribution

- 2,482Less than $10,000
- 2,873$10,000 to $19,999
- 3,517$20,000 to $29,999
- 5,027$30,000 to $39,999
- 3,203$40,000 to $49,999
- 2,973$50,000 to $59,999
- 3,495$60,000 to $74,999
- 4,571$75,000 to $99,999
- 3,746$100,000 to $124,999
- 2,116$125,000 to $149,999
- 2,173$150,000 to $199,999
- 1,881$200,000 or more
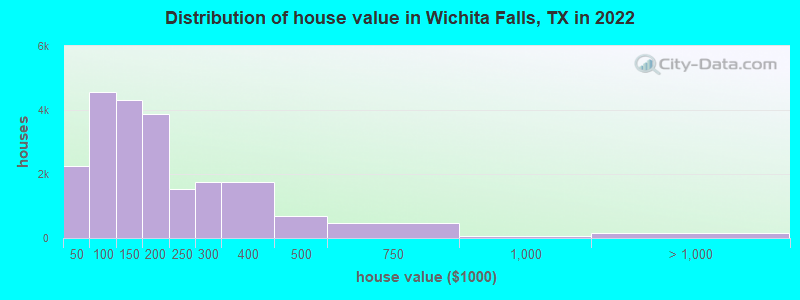
Home value of owner - occupied houses in 2022 in Wichita Falls, TX
-
- 327Less than $10,000
- 180$10,000 to $14,999
- 283$15,000 to $19,999
- 76$20,000 to $24,999
- 208$25,000 to $29,999
- 385$30,000 to $34,999
- 164$35,000 to $39,999
- 625$40,000 to $49,999
- 415$50,000 to $59,999
- 425$60,000 to $69,999
- 1,163$70,000 to $79,999
- 1,097$80,000 to $89,999
- 839$90,000 to $99,999
- 1,281$100,000 to $124,999
- 3,031$125,000 to $149,999
- 2,203$150,000 to $174,999
- 1,671$175,000 to $199,999
- 1,530$200,000 to $249,999
- 1,739$250,000 to $299,999
- 1,738$300,000 to $399,999
- 695$400,000 to $499,999
- 459$500,000 to $749,999
- 56$750,000 to $999,999
- 152$1,000,000 to $1,499,999
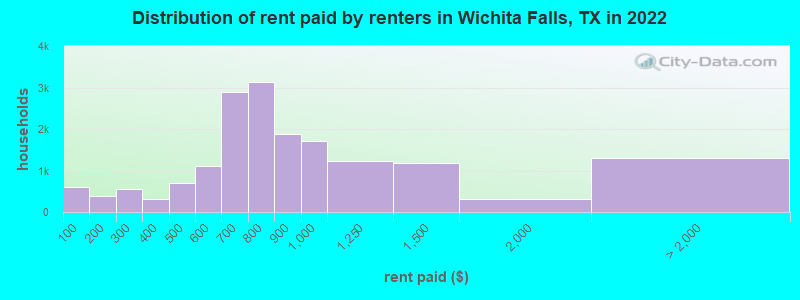
Rent paid by renters in 2022 in Wichita Falls, TX
-
- 608Less than $100
- 396$150 to $199
- 558$200 to $249
- 207$300 to $349
- 107$350 to $399
- 242$400 to $449
- 461$450 to $499
- 475$500 to $549
- 639$550 to $599
- 1,494$600 to $649
- 1,391$650 to $699
- 1,453$700 to $749
- 1,676$750 to $799
- 1,886$800 to $899
- 1,707$900 to $999
- 1,231$1,000 to $1,249
- 1,181$1,250 to $1,499
- 305$1,500 to $1,999
- 631$2,000 to $2,499
- 43$2,500 to $2,999
- 134$3,000 to $3,499
- 490No cash rent
Percentage of workers working in this county: 94.7%
Number of people working at home: 3,312 (6.6% of all workers)
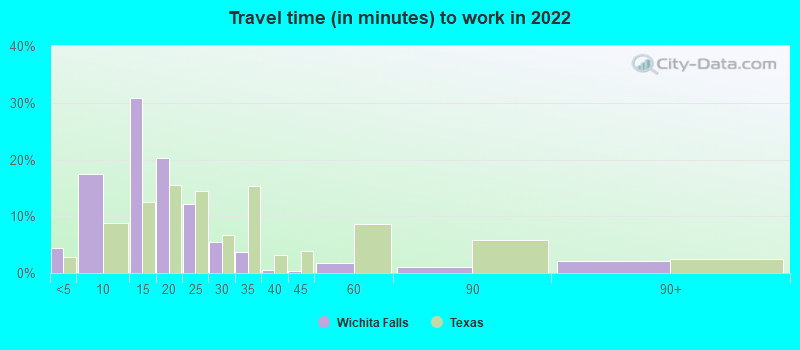
Travel time to work (commute)
- Less than 5 minutes: 2,487
- 5 to 9 minutes: 9,940
- 10 to 14 minutes: 16,798
- 15 to 19 minutes: 9,265
- 20 to 24 minutes: 4,251
- 25 to 29 minutes: 1,454
- 30 to 34 minutes: 1,200
- 35 to 39 minutes: 127
- 40 to 44 minutes: 101
- 45 to 59 minutes: 337
- 60 to 89 minutes: 687
- 90 or more minutes: 1,175
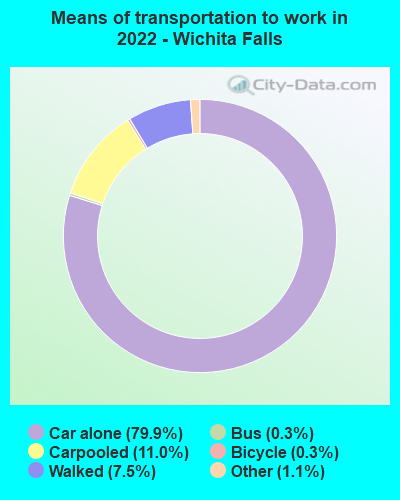
Means of transportation to work:
- Drove a car alone: 43,182 (71.5%)
- Carpooled: 6,454 (10.7%)
- Bus: 121 (0.2%)
- Taxi: 743 (1.2%)
- Bicycle: 161 (0.3%)
- Walked: 4,329 (7.2%)
- Worked at home: 4,474 (7.4%)
- Unemployment by race in 2022
- Unemployment rate for White non-Hispanic residents
- 3.2%Males
- 2.4%Females
- Unemployment rate for Black residents
- 9.7%Females
- Unemployment rate for American Indian and Alaska Native residents
- 1.6%Females
- Unemployment rate for Asian residents
- 1.4%Females
- Unemployment rate for other race residents
- 6.0%Males
- 7.2%Females
- Unemployment rate for two or more race residents
- 4.2%Males
- 16.0%Females
- Unemployment rate for Hispanic or Latino residents
- 2.3%Males
- 5.8%Females
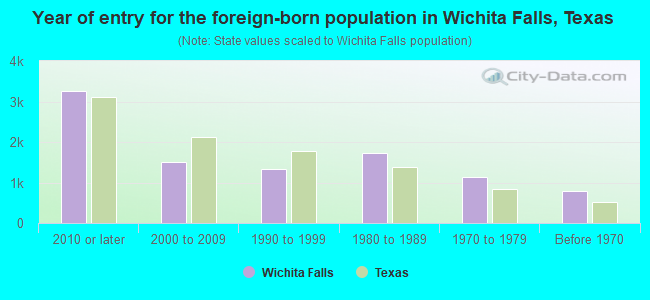
- Year of entry for the foreign-born population in Wichita Falls, Texas
- 3,2672010 or later
- 1,5122000 to 2009
- 1,3371990 to 1999
- 1,7201980 to 1989
- 1,1331970 to 1979
- 789Before 1970
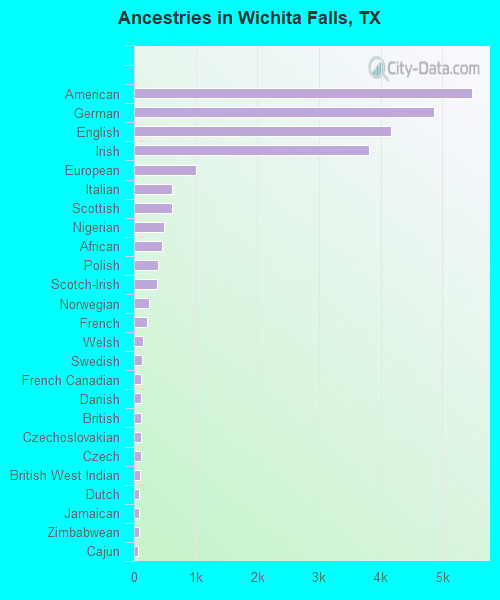
First ancestries reported:
- American: 5,484 (10.8%)
- German: 4,870 (9.6%)
- English: 4,175 (8.2%)
- Irish: 3,819 (7.5%)
- European: 1,009 (2.0%)
- Italian: 611 (1.2%)
- Scottish: 609 (1.2%)
- Nigerian: 482 (0.9%)
- African: 450 (0.9%)
- Polish: 392 (0.8%)
- Scotch-Irish: 381 (0.7%)
- Norwegian: 250 (0.5%)
- French: 206 (0.4%)
- Welsh: 143 (0.3%)
- Swedish: 137 (0.3%)
- French Canadian: 121 (0.2%)
- Danish: 117 (0.2%)
- British: 113 (0.2%)
- Czechoslovakian: 111 (0.2%)
- Czech: 106 (0.2%)
- British West Indian: 103 (0.2%)
- Dutch: 87 (0.2%)
- Jamaican: 77 (0.2%)
- Zimbabwean: 77 (0.2%)
- Cajun: 72 (0.1%)
- Portuguese: 60 (0.1%)
- Scandinavian: 49 (0.10%)
- Lebanese: 48 (0.09%)
- Greek: 48 (0.09%)
- Slavic: 29 (0.06%)
- Bahamian: 26 (0.05%)
- Canadian: 24 (0.05%)
- Lithuanian: 24 (0.05%)
- West Indian: 23 (0.05%)
- Ghanaian: 23 (0.05%)
- Eastern European: 20 (0.04%)
- Serbian: 17 (0.03%)
- Swiss: 16 (0.03%)
- Assyrian: 15 (0.03%)
- Northern European: 13 (0.03%)
- Austrian: 13 (0.03%)
- Russian: 12 (0.02%)
- Brazilian: 12 (0.02%)
- Belgian: 12 (0.02%)
- Finnish: 10 (0.02%)
- Romanian: 10 (0.02%)
- Yugoslavian: 10 (0.02%)
- Croatian: 8 (0.02%)
- Iranian: 7 (0.01%)
- Slovak: 6 (0.01%)
- Somali: 5 (0.01%)
- Dutch West Indian: 4 (0.01%)
Most common places of birth for foreign-born residents (%):
| Wichita Falls: | 38.3% (2,868) |
| Texas: | 48.4% (2,411,723) |
| Wichita Falls: | 5.3% (400) |
| Texas: | 1.9% (96,110) |
| Wichita Falls: | 4.8% (362) |
| Texas: | 3.7% (184,770) |
| Wichita Falls: | 4.7% (348) |
| Texas: | 2.1% (103,148) |
| Wichita Falls: | 3.3% (250) |
| Texas: | 0.8% (37,989) |
| Wichita Falls: | 2.9% (217) |
| Texas: | 6.1% (306,347) |
| Wichita Falls: | 2.8% (209) |
| Texas: | 0.3% (15,833) |
| Wichita Falls: | 2.6% (195) |
| Texas: | 0.2% (9,997) |
| Wichita Falls: | 2.4% (176) |
| Texas: | 1.8% (87,382) |
| Wichita Falls: | 2.2% (164) |
| Texas: | 2.3% (115,558) |
| Wichita Falls: | 2.1% (160) |
| Texas: | 0.2% (9,294) |
| Wichita Falls: | 1.9% (139) |
| Texas: | 0.3% (15,368) |
| Wichita Falls: | 1.7% (130) |
| Texas: | 0.1% (5,111) |
Place of birth for U.S.-born residents:
- This state: 60,023
- Other state: 34,825
- Northeast: 4,266
- Midwest: 8,850
- South: 13,019
- West: 8,690
77.9% of Wichita Falls residents lived in the same house 1 years ago.
Out of people who lived in different houses, 29.9% lived in this county.
Out of people who lived in different counties, 48.7% lived in Texas.
| Wichita Falls: | 77.9% |
| State average: | 85.7% |
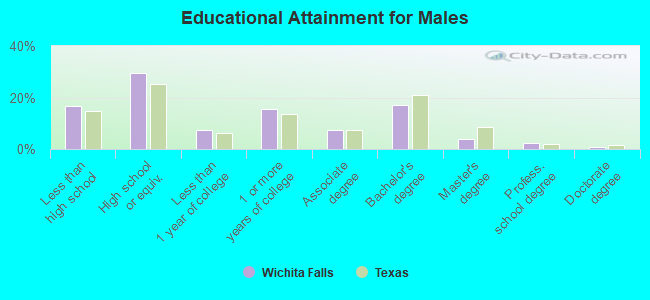
Education attainment for males 25 years and older:
- No schooling: 743
- Nursery to 4th grade: 1,137
- 5th and 6th grade: 1,308
- 7th and 8th grade: 693
- 9th grade: 434
- 10th grade: 800
- 11th grade: 362
- 12th grade, no diploma: 128
- High school graduate (or equivalency): 10,041
- Less than 1 year of college: 2,452
- Some college more than 1 year, no degree: 5,226
- Associate degree: 2,481
- Bachelor's degree: 5,771
- Master's degree: 1,379
- Professional school degree: 731
- Doctorate degree: 234
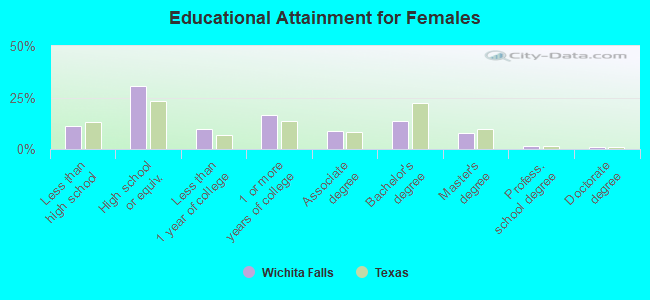
Education attainment for females 25 years and older:
- No schooling: 602
- Nursery to 4th grade: 96
- 5th and 6th grade: 227
- 7th and 8th grade: 182
- 9th grade: 940
- 10th grade: 756
- 11th grade: 428
- 12th grade, no diploma: 182
- High school graduate (or equivalency): 9,506
- Less than 1 year of college: 2,990
- Some college more than 1 year, no degree: 5,144
- Associate degree: 2,754
- Bachelor's degree: 4,163
- Master's degree: 2,351
- Professional school degree: 377
- Doctorate degree: 257
Housing units in structures:
- One, detached: 29,318
- One, attached: 688
- Two: 1,476
- 3 or 4: 3,049
- 5 to 9: 3,072
- 10 to 19: 2,316
- 20 to 49: 514
- 50 or more: 1,533
- Mobile homes: 654
- Boats, RVs, vans, etc.: 21
Median worth of mobile homes: $15,300
Housing units lacking complete kitchen facilities in 2022: 3.4%
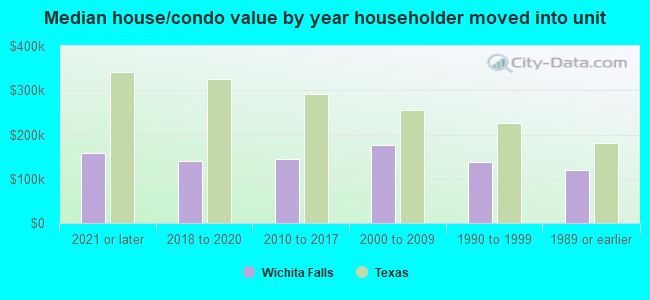
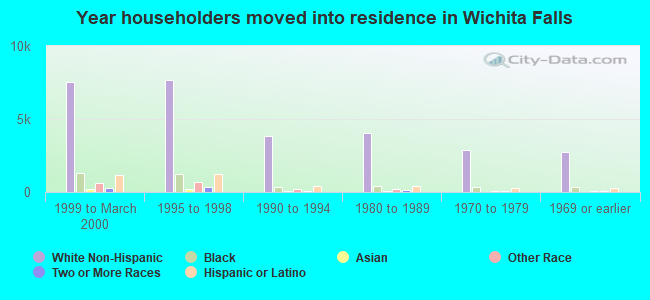
House/condo owner moved in on average 11 years ago
Renter moved in on average 1 years ago
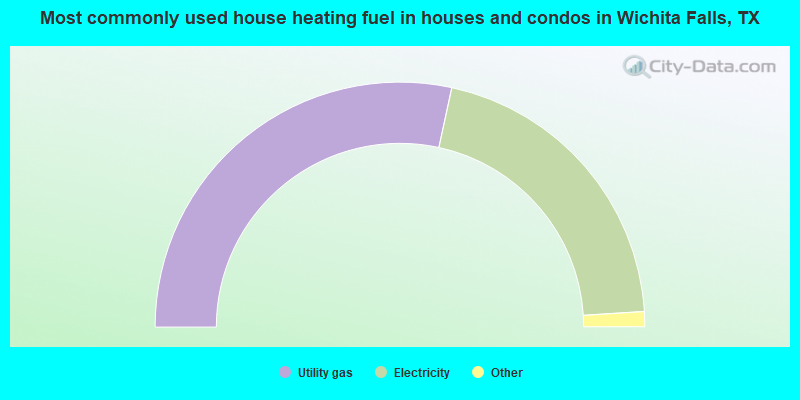
- 56.8%Utility gas
- 41.2%Electricity
- 1.3%Bottled, tank, or LP gas
- 0.3%No fuel used
- 0.1%Other fuel
- 0.1%Wood
- 0.1%Fuel oil, kerosene, etc.
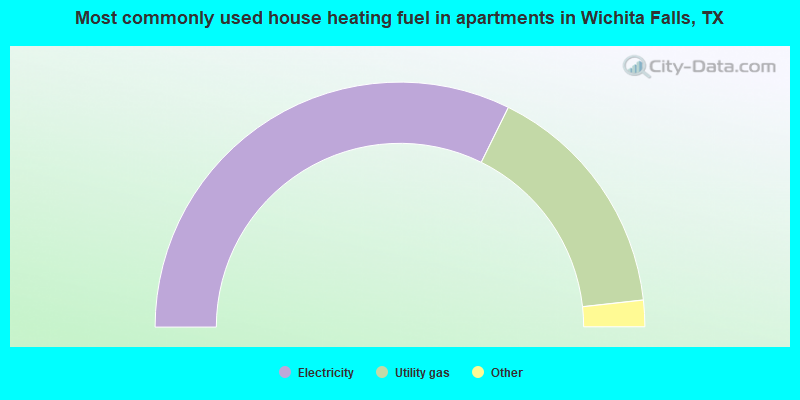
- 64.6%Electricity
- 31.9%Utility gas
- 2.4%Bottled, tank, or LP gas
- 0.7%No fuel used
- 0.2%Other fuel
- 0.1%Solar energy
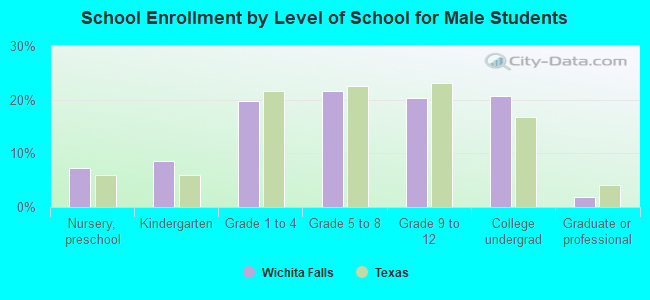
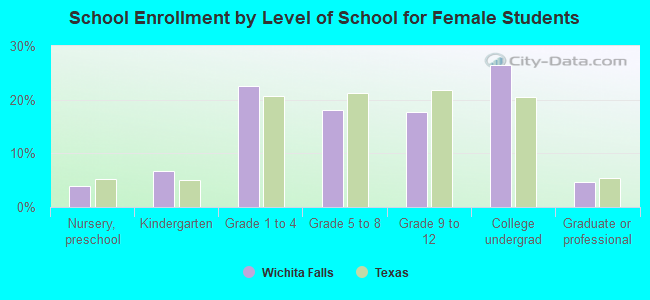
Private vs. public school enrollment:
| Here: | 3.4% |
| Texas: | 8.8% |
| Here: | 5.5% |
| Texas: | 8.0% |
| Here: | 9.5% |
| Texas: | 16.2% |