Jump to a detailed profile or search site with Google Custom Search

Whittier, CA (California) Houses and Residents

Estimated median house or condo value in 2022: $763,900 (it was $209,800 in 2000)
Whittier:

$763,900
California:

$715,900
Lower value quartile - upper value quartile: $579,800 - $941,700

Mean price in 2022:

Detached houses: $975,045
Here:

$975,045
State:

$988,808

Townhouses or other attached units: $837,219
Here:

$837,219
State:

$838,546

In 2-unit structures: $853,900
Here:

$853,900
State:

$1,138,100

In 3-to-4-unit structures: $1,001,984
Here:

$1,001,984
State:

$824,253

In 5-or-more-unit structures: $518,565
Here:

$518,565
State:

$730,996

Mobile homes: $97,048
Here:

$97,048
State:

$184,506

Total population: 87,318 (Urban population: 83,838, Rural population: 0)

Houses: 29,928 (28,151 occupied: 16,715 owner occupied, 11,436 renter occupied)

% of renters here:

41%
State:

44%

Housing density: 2,046 houses/condos per square mile

Median price asked for vacant for-sale houses and condos in 2022: $959,351.

Median contract rent in 2022: $1,636 (lower quartile is $1,236, upper quartile is over $2,000)


Median rent asked for vacant for-rent units in 2022: $2,805


Median gross rent in Whittier, CA in 2022: $1,713

Housing units in Whittier with a mortgage: 12,356 (528 second mortgage, 0 home equity loan, 437 both second mortgage and home equity loan)
Houses without a mortgage: 172

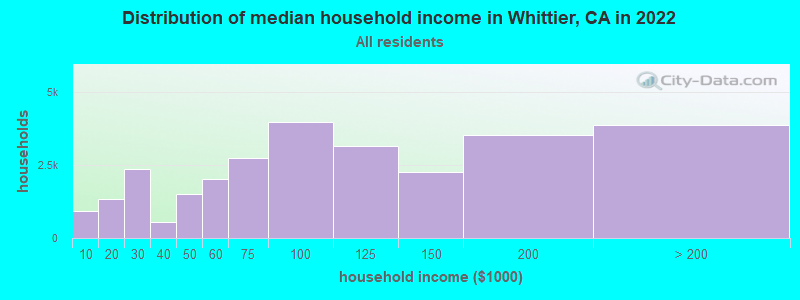
Median household income for houses/condos with a mortgage: $122,130

Median household income for apartments without a mortgage: $78,515

Median monthly housing costs: $1,874

Compare current foreclosures in Whittier, CA:

Check out more offers in Whittier, CA.
Powered by Foreclosure.com

Settings
X
Data:
Loading data...
Based on 2000-2022 data
Loading data...

123
Hide US histogram

Latest news about housing in Whittier, CA collected exclusively by city-data.com from local newspapers, TV, and radio stations

Whittier, California Age and Sex of Residents
Median year house/condo built: 1955

Median year apartment built: 1958

Household type by relationship:

Households: 84,503
  • Male householders: 14,867 (3,049 living alone), Female householders: 13,284 (2,852 living alone)
  • 14,278 spouses (14,151 opposite-sex spouses), 2,916 unmarried partners, (2,916 opposite-sex unmarried partners), 26,267 children (24,898 natural, 646 adopted, 723 stepchildren), 3,676 grandchildren, 1,383 brothers or sisters, 1,951 parents, 0 foster children, 2,460 other relatives, 2,057 non-relatives
  • In group quarters: 1,364

Size of family households: 5,671 2-persons, 6,342 3-persons, 5,142 4-persons, 2,005 5-persons, 1,067 6-persons, 622 7-or-more-persons.

Size of nonfamily households: 5,901 1-person, 1,275 2-persons, 44 3-persons, 23 4-persons, 59 5-persons.

9,884 married couples with children.
3,392 single-parent households (1,829 men, 1,563 women).

59.9% of residents of Whittier speak English at home.
34.8% of residents speak Spanish at home (74% speak English very well, 12% speak English well, 9% speak English not well, 4% don't speak English at all).
2.5% of residents speak other Indo-European language at home (77% speak English very well, 16% speak English well, 7% speak English not well).
2.8% of residents speak Asian or Pacific Island language at home (61% speak English very well, 21% speak English well, 13% speak English not well, 5% don't speak English at all).
0.3% of residents speak other language at home (71% speak English very well, 24% speak English well, 4% speak English not well).

Foreign born population: 16,949 (20.1%)
(73.4% of them are naturalized citizens)

Median number of rooms in houses and condos:
Here:

5.8
State:

6.0

Median number of rooms in apartments
Here:

3.8
State:

3.9

Owner-occupied Renter-occupied
Bedrooms in owner-occupied houses and condos in Whittier, California
  • Bedrooms in owner-occupied houses and condos in Whittier, California
  • 0no bedroom
  • 2831 bedroom
  • 2,7262 bedrooms
  • 10,3283 bedrooms
  • 2,9724 bedrooms
  • 4065+ bedrooms
Bedrooms in renter-occupied apartments in Whittier, California
  • Bedrooms in renter-occupied apartments in Whittier, California
  • 1,357no bedroom
  • 3,4211 bedroom
  • 4,0582 bedrooms
  • 2,4283 bedrooms
  • 1254 bedrooms
  • 475+ bedrooms
Owner-occupied Renter-occupied
Cars and other vehicles available in Whittier in owner-occupied houses/condos
  • Cars and other vehicles available in Whittier in owner-occupied houses/condos
  • 405no vehicle
  • 3,3341 vehicle
  • 6,2812 vehicles
  • 4,0523 vehicles
  • 1,8634 vehicles
  • 7805+ vehicles
Cars and other vehicles available in Whittier in renter-occupied apartments
  • Cars and other vehicles available in Whittier in renter-occupied apartments
  • 1,290no vehicle
  • 3,5591 vehicle
  • 4,5362 vehicles
  • 1,4333 vehicles
  • 4454 vehicles
  • 1735+ vehicles
Owner-occupied Renter-occupied
Rooms in owner-occupied houses in Whittier, California
  • Rooms in owner-occupied houses in Whittier, California
  • 01 room
  • 1112 rooms
  • 3883 rooms
  • 2,4634 rooms
  • 3,9655 rooms
  • 4,7766 rooms
  • 3,0287 rooms
  • 9228 rooms
  • 1,0629+ rooms
Rooms in renter-occupied apartments in Whittier, California
  • Rooms in renter-occupied apartments in Whittier, California
  • 1,3141 room
  • 7762 rooms
  • 2,6013 rooms
  • 3,5774 rooms
  • 1,8695 rooms
  • 7116 rooms
  • 3057 rooms
  • 08 rooms
  • 2839+ rooms
Year house built
Median 2022 house/condo value by year built
Median house/condo value by year householder moved into unit
Breakdown of mean house values by ages of householders
Owners and renters by unit type in Whittier, CA
  • Whittier, CA household income distribution

  • Distribution of median household income in Whittier, CA in 2022
  • 916Less than $10,000
  • 1,331$10,000 to $19,999
  • 2,370$20,000 to $29,999
  • 554$30,000 to $39,999
  • 1,494$40,000 to $49,999
  • 2,002$50,000 to $59,999
  • 2,742$60,000 to $74,999
  • 3,963$75,000 to $99,999
  • 3,131$100,000 to $124,999
  • 2,257$125,000 to $149,999
  • 3,529$150,000 to $199,999
  • 3,862$200,000 or more
  • Home value of owner - occupied houses in 2022 in Whittier, CA

  • Distribution of house value in Whittier, CA in 2022
  • 208Less than $10,000
  • 3$10,000 to $14,999
  • 7$15,000 to $19,999
  • 8$20,000 to $24,999
  • 29$35,000 to $39,999
  • 4$40,000 to $49,999
  • 3$50,000 to $59,999
  • 46$60,000 to $69,999
  • 32$70,000 to $79,999
  • 32$80,000 to $89,999
  • 33$90,000 to $99,999
  • 155$100,000 to $124,999
  • 67$150,000 to $174,999
  • 84$200,000 to $249,999
  • 75$250,000 to $299,999
  • 248$300,000 to $399,999
  • 614$400,000 to $499,999
  • 6,239$500,000 to $749,999
  • 5,089$750,000 to $999,999
  • 1,953$1,000,000 to $1,499,999
  • 312$1,500,000 to $1,999,999
  • 211$2,000,000 or more
  • Rent paid by renters in 2022 in Whittier, CA

  • Distribution of rent paid by renters in Whittier, CA in 2022
  • 32$100 to $149
  • 59$150 to $199
  • 55$200 to $249
  • 91$250 to $299
  • 72$300 to $349
  • 38$350 to $399
  • 54$400 to $449
  • 8$450 to $499
  • 29$500 to $549
  • 21$550 to $599
  • 122$600 to $649
  • 37$650 to $699
  • 138$700 to $749
  • 50$750 to $799
  • 123$800 to $899
  • 504$900 to $999
  • 1,455$1,000 to $1,249
  • 2,001$1,250 to $1,499
  • 4,316$1,500 to $1,999
  • 1,716$2,000 to $2,499
  • 638$2,500 to $2,999
  • 181$3,000 to $3,499
  • 165$3,500 or more
  • 289No cash rent
Time Leaving Home To Go To Work in 2022

Percentage of workers working in this county: 82.6%
Number of people working at home: 4,378 (10.9% of all workers)

Travel time (in minutes) to work in 2022

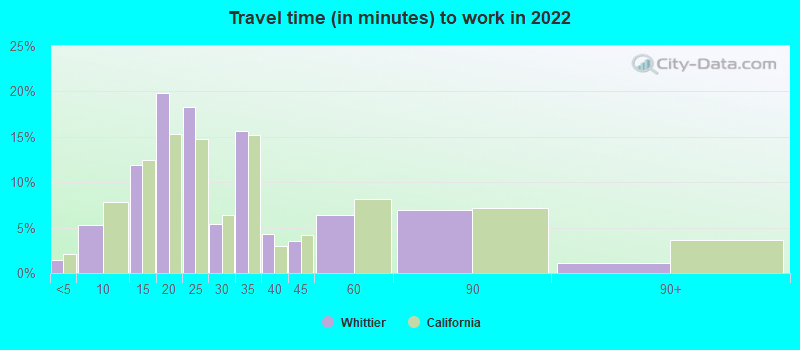
Travel time to work (commute)

  • Less than 5 minutes: 557
  • 5 to 9 minutes: 1,556
  • 10 to 14 minutes: 3,769
  • 15 to 19 minutes: 4,875
  • 20 to 24 minutes: 4,096
  • 25 to 29 minutes: 2,137
  • 30 to 34 minutes: 6,012
  • 35 to 39 minutes: 1,621
  • 40 to 44 minutes: 1,292
  • 45 to 59 minutes: 2,848
  • 60 to 89 minutes: 4,335
  • 90 or more minutes: 2,226
Means of transportation to work in 2022 - Whittier

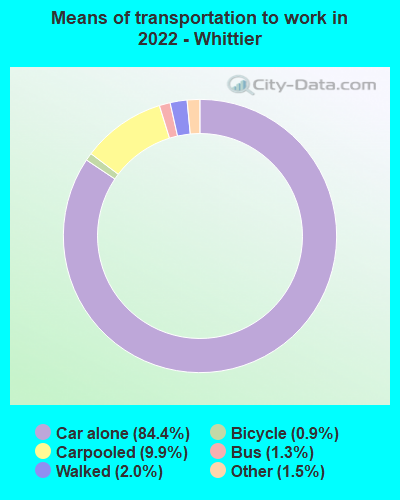
Means of transportation to work:

  • Drove a car alone: 27,378 (72.8%)
  • Carpooled: 3,559 (9.5%)
  • Bus: 372 (1.0%)
  • Subway or elevated rail: 13 (0.0%)
  • Long-distance train or commuter rail: 4 (0.0%)
  • Taxi: 530 (1.4%)
  • Bicycle: 302 (0.8%)
  • Walked: 688 (1.8%)
  • Worked at home: 4,378 (11.6%)
Class of Workers in 2022
  • Unemployment by race in 2022
  • Unemployment rate for White non-Hispanic residents
  • 1.9%Males
  • 3.2%Females
  • Unemployment rate for Black residents
  • 8.6%Males
  • 12.1%Females
  • Unemployment rate for American Indian and Alaska Native residents
  • 3.0%Males
  • 21.6%Females
  • Unemployment rate for Asian residents
  • 2.5%Males
  • 2.9%Females
  • Unemployment rate for other race residents
  • 3.4%Males
  • Unemployment rate for two or more race residents
  • 5.3%Males
  • 18.2%Females
  • Unemployment rate for Hispanic or Latino residents
  • 3.4%Males
  • 8.0%Females
Year of entry for the foreign-born population in Whittier, California
  • Year of entry for the foreign-born population in Whittier, California
  • 1,6382010 or later
  • 2,0812000 to 2009
  • 2,1491990 to 1999
  • 4,7701980 to 1989
  • 3,6651970 to 1979
  • 2,995Before 1970
Ancestries in Whittier, CA

First ancestries reported:

  • American: 3,704 (6.7%)
  • English: 1,293 (2.3%)
  • German: 911 (1.6%)
  • Italian: 909 (1.6%)
  • Armenian: 613 (1.1%)
  • Irish: 427 (0.8%)
  • European: 395 (0.7%)
  • Russian: 381 (0.7%)
  • Scottish: 339 (0.6%)
  • Dutch: 252 (0.5%)
  • Polish: 160 (0.3%)
  • Eastern European: 114 (0.2%)
  • Swedish: 107 (0.2%)
  • French: 101 (0.2%)
  • Portuguese: 98 (0.2%)
  • Bulgarian: 74 (0.1%)
  • African: 72 (0.1%)
  • Canadian: 71 (0.1%)
  • Scotch-Irish: 68 (0.1%)
  • Arab: 59 (0.1%)
  • Scandinavian: 59 (0.1%)
  • British: 57 (0.1%)
  • Lebanese: 54 (0.10%)
  • Norwegian: 52 (0.09%)
  • Greek: 51 (0.09%)
  • Finnish: 46 (0.08%)
  • Ukrainian: 42 (0.08%)
  • Danish: 35 (0.06%)
  • Iranian: 33 (0.06%)
  • Welsh: 32 (0.06%)
  • Egyptian: 25 (0.05%)
  • Jamaican: 25 (0.05%)
  • Basque: 21 (0.04%)
  • Estonian: 16 (0.03%)
  • Northern European: 16 (0.03%)
  • Czechoslovakian: 12 (0.02%)
  • Croatian: 11 (0.02%)
  • Slovene: 9 (0.02%)
  • Kenyan: 9 (0.02%)
  • Lithuanian: 9 (0.02%)
  • Swiss: 9 (0.02%)
  • Yugoslavian: 9 (0.02%)
  • Hungarian: 8 (0.01%)
  • Romanian: 7 (0.01%)
  • Israeli: 7 (0.01%)
  • Brazilian: 4 (0.01%)
  • Nigerian: 4 (0.01%)

Most common places of birth for foreign-born residents (%):

Mexico
Whittier:

50.2% (7,046)
California:

37.2% (3,881,193)

El Salvador
Whittier:

8.7% (1,223)
California:

4.2% (440,287)

Guatemala
Whittier:

4.2% (586)
California:

2.8% (290,436)

Philippines
Whittier:

3.6% (504)
California:

7.8% (818,297)

China, excluding Hong Kong and Taiwan
Whittier:

2.5% (352)
California:

6.6% (684,672)

Korea
Whittier:

1.9% (265)
California:

3.0% (315,248)

Nicaragua
Whittier:

1.8% (258)
California:

0.6% (58,161)

India
Whittier:

1.7% (235)
California:

5.2% (539,184)

Russia
Whittier:

1.6% (222)
California:

0.7% (71,932)

Place of birth for U.S.-born residents:

  • This state: 61,100
  • Other state: 5,535
  • Northeast: 1,263
  • Midwest: 1,049
  • South: 1,733
  • West: 1,490

93.3% of Whittier residents lived in the same house 1 years ago.
   Out of people who lived in different houses, 44.3% lived in this county.
   Out of people who lived in different counties, 72.8% lived in California.


Whittier:

93.3%
State average:

88.9%

Education attainment for males 25 years and older:

  • No schooling: 422
  • Nursery to 4th grade: 510
  • 5th and 6th grade: 451
  • 7th and 8th grade: 410
  • 9th grade: 33
  • 10th grade: 356
  • 11th grade: 374
  • 12th grade, no diploma: 779
  • High school graduate (or equivalency): 7,947
  • Less than 1 year of college: 2,241
  • Some college more than 1 year, no degree: 5,808
  • Associate degree: 2,632
  • Bachelor's degree: 5,042
  • Master's degree: 2,109
  • Professional school degree: 227
  • Doctorate degree: 327
Educational Attainment for Males

Education attainment for females 25 years and older:

  • No schooling: 786
  • Nursery to 4th grade: 400
  • 5th and 6th grade: 513
  • 7th and 8th grade: 335
  • 9th grade: 89
  • 10th grade: 0
  • 11th grade: 787
  • 12th grade, no diploma: 777
  • High school graduate (or equivalency): 7,867
  • Less than 1 year of college: 1,696
  • Some college more than 1 year, no degree: 3,761
  • Associate degree: 3,196
  • Bachelor's degree: 6,488
  • Master's degree: 2,787
  • Professional school degree: 138
  • Doctorate degree: 521
Educational Attainment for Females
Whittier marital status for males
Whittier marital status for females

Housing units in structures:

  • One, detached: 19,202
  • One, attached: 1,549
  • Two: 608
  • 3 or 4: 1,705
  • 5 to 9: 2,319
  • 10 to 19: 1,649
  • 20 to 49: 1,393
  • 50 or more: 986
  • Mobile homes: 517
Housing units lacking complete kitchen facilities in 2022: 3.6%

House/condo owner moved in on average 15 years ago

Renter moved in on average 6 years ago

Year householders moved into residence in Whittier
Houses and condos Apartments
Most commonly used house heating fuel in houses and condos in Whittier, CA
  • 82.3%Utility gas
  • 14.2%Electricity
  • 1.3%Solar energy
  • 1.1%Bottled, tank, or LP gas
  • 0.9%No fuel used
  • 0.2%Wood
Most commonly used house heating fuel in apartments in Whittier, CA
  • 63.4%Utility gas
  • 29.0%Electricity
  • 5.4%No fuel used
  • 2.0%Bottled, tank, or LP gas
  • 0.2%Solar energy
  • 0.1%Wood

Private vs. public school enrollment:

Students in private schools in grades 1 to 8 (elementary and middle school): 776
Here:

8.8%
California:

10.5%

Students in private schools in grades 9 to 12 (high school): 252
Here:

8.3%
California:

8.5%

Students in private undergraduate colleges: 827
Here:

14.5%
California:

15.9%
School Enrollment by Level of School for Male Students
School Enrollment by Level of School for Female Students
Age and Sex of Sensory-Disabled Noninstitutionalized Residents
Age and Sex of Physically-Disabled Noninstitutionalized Residents
Age and Sex of Mentally-Disabled Noninstitutionalized Residents
Age and Sex of Self-Care Disabled Noninstitutionalized Residents
Age and Sex of Go-Outside-Home Disabled Noninstitutionalized Residents
Age and Sex of Noninstitutionalized Residents with Employment Disability