Whitman, MA (Massachusetts) Houses and Residents
| Whitman: | $492,984 |
| Massachusetts: | $534,700 |
Total population: 14,489 (Urban population: 13,882, Rural population: 0)
Houses: 5,104 (4,999 occupied: 3,602 owner occupied, 1,397 renter occupied)
| % of renters here: | 28% |
| State: | 38% |
Housing density: 734 houses/condos per square mile
Median price asked for vacant for-sale houses and condos in 2022 in this county: $446,078.
Median contract rent in 2022: $1,498 (lower quartile is $1,038, upper quartile is $1,985)
Median rent asked for vacant for-rent units in 2022: $1,414
Median gross rent in Whitman, MA in 2022: $1,694
Housing units in Whitman with a mortgage: 2,392 (177 second mortgage, 355 home equity loan, 0 both second mortgage and home equity loan)
Houses without a mortgage: 739
Compare current foreclosures near Whitman, MA:
| Photo | Address | Area | Beds / Baths | Price | Details |
|---|---|---|---|---|---|

|
#1
Hogg Memorial Dr
Whitman, MA 02382
|
1,129 sq. feet
|
1 baths 3 beds |
show details | |

|
#2
Old Coach Rd
Whitman, MA 02382
|
2,082 sq. feet
|
2 baths 4 beds |
show details | |

|
#3
Martin St
Whitman, MA 02382
|
2,039 sq. feet
|
1 baths 4 beds |
show details | |

|
#4
Auburn St
Whitman, MA 02382
|
2,267 sq. feet
|
1 baths 4 beds |
show details | |

|
#5
Raynor Ave # 2
Whitman, MA 02382
|
1,484 sq. feet
|
2 baths 4 beds |
show details | |

|
#6
Harvard St
Whitman, MA 02382
|
1,659 sq. feet
|
1 baths 4 beds |
show details | |

|
#7
Valley Rd
Whitman, MA 02382
|
1,632 sq. feet
|
3 baths 4 beds |
show details | |

|
#8
English Pl
Whitman, MA 02382
|
2,011 sq. feet
|
2 baths 5 beds |
show details | |

|
#9
Beal Ave
Whitman, MA 02382
|
1,283 sq. feet
|
1 baths 5 beds |
show details | |

|
#10
Loring Ave
Whitman, MA 02382
|
888 sq. feet
|
1 baths 3 beds |
show details |
| Photo | Address | Area | Beds / Baths | Price | Details |
|---|---|---|---|---|---|

|
#11
School St
Whitman, MA 02382
|
2,526 sq. feet
|
2 baths 5 beds |
show details | |

|
#12
Whidden Ave
Whitman, MA 02382
|
2,884 sq. feet
|
1 baths 4 beds |
show details | |

|
#13
Walnut St
Whitman, MA 02382
|
2,457 sq. feet
|
3 baths 4 beds |
show details | |

|
#14
Plymouth St
Whitman, MA 02382
|
1,392 sq. feet
|
1 baths 3 beds |
show details | |

|
#15
Myrtle Ave Apt 520
Whitman, MA 02382
|
- sq. feet
|
- baths - beds |
show details | |

|
#16
Washington St
Whitman, MA 02382
|
- sq. feet
|
- baths - beds |
show details | |

|
#17
Plymouth St # A5
Whitman, MA 02382
|
- sq. feet
|
- baths - beds |
show details | |

|
#18
Ct St Unit 1
Whitman, MA 02382
|
- sq. feet
|
- baths - beds |
show details | |

|
#19
Boyd St
Boston, MA 02124
|
3,970 sq. feet
|
3 baths 9 beds |
$650,000
|
show details |

|
#20
Heritage Ln
Duxbury, MA 02332
|
5,508 sq. feet
|
2 baths 5 beds |
$759,900
|
show details |
| Photo | Address | Area | Beds / Baths | Price | Details |
|---|---|---|---|---|---|

|
#21
Prospect St
Norwell, MA 02061
|
5,483 sq. feet
|
5 baths 5 beds |
$1,800,000
|
show details |

|
#22
Johnson Rd
North Weymouth, MA 02191
|
748 sq. feet
|
1 baths 2 beds |
$365,000
|
show details |

|
#23
County St
East Taunton, MA 02718
|
1,157 sq. feet
|
1 baths 1 beds |
$219,900
|
show details |

|
#24
Tall Oaks Dr Unit 508
South Weymouth, MA 02190
|
1,300 sq. feet
|
2 baths 2 beds |
$285,000
|
show details |

|
#25
Kendrick Ave Apt 307
Quincy, MA 02169
|
1,234 sq. feet
|
2 baths 2 beds |
show details | |

|
#26
Church St
Boston, MA 02122
|
3,663 sq. feet
|
3 baths 6 beds |
show details | |

|
#27
Bittersweet Ln
Randolph, MA 02368
|
882 sq. feet
|
1 baths 2 beds |
show details | |

|
#28
Dwinell Rd
Taunton, MA 02780
|
1,632 sq. feet
|
2 baths 4 beds |
show details | |

|
#29
S Franklin St
Holbrook, MA 02343
|
940 sq. feet
|
2 baths 2 beds |
show details | |

|
#30
Congress Pl
Dedham, MA 02026
|
1,966 sq. feet
|
2 baths 4 beds |
show details |
| Photo | Address | Area | Beds / Baths | Price | Details |
|---|---|---|---|---|---|

|
#31
Richmond St
Boston, MA 02124
|
2,516 sq. feet
|
2 baths 4 beds |
show details | |

|
#32
Berkshire Ave
Sharon, MA 02067
|
1,289 sq. feet
|
2 baths 3 beds |
show details | |

|
#33
Powhattan Dr
East Taunton, MA 02718
|
1,632 sq. feet
|
1 baths 3 beds |
show details | |

|
#34
Oak St
Hanson, MA 02341
|
1,058 sq. feet
|
1 baths 2 beds |
show details | |

|
#35
Webster St
Randolph, MA 02368
|
1,080 sq. feet
|
1 baths 3 beds |
show details | |

|
#36
Melville Ct
Brockton, MA 02301
|
1,140 sq. feet
|
2 baths 3 beds |
show details | |

|
#37
Neponset St
Canton, MA 02021
|
1,053 sq. feet
|
1 baths 2 beds |
show details | |

|
#38
Tamarack Ln
Abington, MA 02351
|
1,495 sq. feet
|
2 baths 2 beds |
show details | |

|
#39
Marcy Rd
Mattapan, MA 02126
|
1,168 sq. feet
|
1 baths 3 beds |
show details | |

|
#40
Cappys Way
Brockton, MA 02302
|
2,128 sq. feet
|
2 baths 4 beds |
show details |
| Photo | Address | Area | Beds / Baths | Price | Details |
|---|---|---|---|---|---|

|
#41
Ashland St
Taunton, MA 02780
|
1,680 sq. feet
|
2 baths 4 beds |
show details | |

|
#42
N Main St
Middleboro, MA 02346
|
1,898 sq. feet
|
2 baths 4 beds |
show details | |

|
#43
Tremont St
Brockton, MA 02301
|
1,470 sq. feet
|
2 baths 4 beds |
show details | |

|
#44
Littlefield St
Quincy, MA 02169
|
1,274 sq. feet
|
1 baths 4 beds |
show details | |

|
#45
Ballou St
Quincy, MA 02169
|
1,758 sq. feet
|
1 baths 3 beds |
show details | |

|
#46
Great Cedar Dr # 4
Hanson, MA 02341
|
- sq. feet
|
1 baths 2 beds |
show details | |

|
#47
Ridgehill Rd
Canton, MA 02021
|
1,196 sq. feet
|
1 baths 3 beds |
show details | |

|
#48
Emily Jeffers Rd # L
Randolph, MA 02368
|
1,350 sq. feet
|
1 baths 3 beds |
show details | |

|
#49
Rockland St
Abington, MA 02351
|
1,700 sq. feet
|
1 baths 4 beds |
show details | |

|
Check over 1 million property listings on Foreclosure.com!
|
browse all offers | |||
Latest news about housing in Whitman, MA collected exclusively by city-data.com from local newspapers, TV, and radio stations

 | How Much Massachusetts Households Make Per Year: Census Data (37 replies) |
| $250K Houses With the Closest Proximity to Boston That Are Also Safe? (65 replies) |
| 2023 Real Estate Observations (5278 replies) |
| MA Real Estate Question OTD (83 replies) |
| 2022 Real Estate Observations (1122 replies) |
| Home Prices By Town for 2022 (190 replies) |

Household type by relationship:
Households: 483,098- In family households: 417,329 (86,307 male householders, 41,618 female householders)
97,089 spouses, 154,870 children (146,729 natural, 3,391 adopted, 4,750 stepchildren), 8,780 grandchildren, 4,455 brothers or sisters, 5,200 parents, foster children, 5,123 other relatives, 10,196 non-relatives
- In nonfamily households: 65,769 (22,929 male householders (17,306 living alone)), 30,272 female householders (25,724 living alone)), 12,568 nonrelatives
- In group quarters: 11,821 (7,645 institutionalized population)
92,167 married couples with children.
24,193 single-parent households (4,628 men, 19,565 women).
96.7% of residents of Whitman speak English at home.
0.7% of residents speak Spanish at home (80% speak English very well, 20% speak English not well).
2.0% of residents speak other Indo-European language at home (80% speak English very well, 14% speak English well, 5% speak English not well).
0.2% of residents speak Asian or Pacific Island language at home (27% speak English very well, 55% speak English well, 18% speak English not well).
0.4% of residents speak other language at home (56% speak English very well, 44% speak English well).
Foreign born population: 618 (3.9%)
(71.4% of them are naturalized citizens)
| Here: | 6.8 |
| State: | 6.5 |
| Here: | 3.0 |
| State: | 4.0 |

- Bedrooms in owner-occupied houses and condos in Whitman, Massachusetts
- 0no bedroom
- 951 bedroom
- 6612 bedrooms
- 1,9923 bedrooms
- 7184 bedrooms
- 1365+ bedrooms

- Bedrooms in renter-occupied apartments in Whitman, Massachusetts
- 55no bedroom
- 5371 bedroom
- 4562 bedrooms
- 2993 bedrooms
- 504 bedrooms
- 05+ bedrooms

- Cars and other vehicles available in Whitman in owner-occupied houses/condos
- 88no vehicle
- 9061 vehicle
- 1,8682 vehicles
- 4593 vehicles
- 2204 vehicles
- 615+ vehicles

- Cars and other vehicles available in Whitman in renter-occupied apartments
- 153no vehicle
- 7221 vehicle
- 4562 vehicles
- 483 vehicles
- 114 vehicles
- 75+ vehicles

- Rooms in owner-occupied houses in Whitman, Massachusetts
- 01 room
- 62 rooms
- 443 rooms
- 1654 rooms
- 6915 rooms
- 1,1336 rooms
- 7497 rooms
- 5048 rooms
- 3109+ rooms

- Rooms in renter-occupied apartments in Whitman, Massachusetts
- 551 room
- 682 rooms
- 4383 rooms
- 3104 rooms
- 2535 rooms
- 1996 rooms
- 407 rooms
- 198 rooms
- 159+ rooms


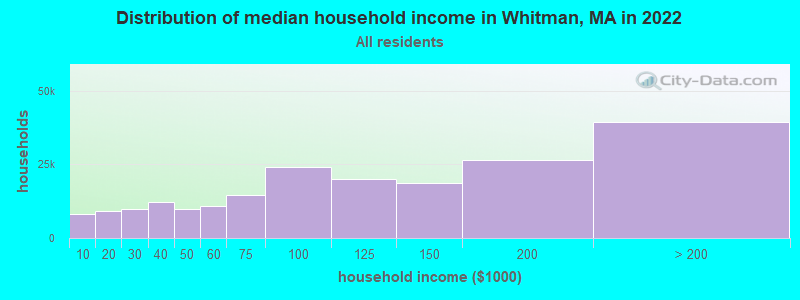
Whitman, MA household income distribution

- 8,217Less than $10,000
- 9,237$10,000 to $19,999
- 9,967$20,000 to $29,999
- 12,249$30,000 to $39,999
- 9,719$40,000 to $49,999
- 11,011$50,000 to $59,999
- 14,527$60,000 to $74,999
- 24,178$75,000 to $99,999
- 20,194$100,000 to $124,999
- 18,736$125,000 to $149,999
- 26,633$150,000 to $199,999
- 39,398$200,000 or more
Percentage of workers working in this county: 59.7%
Number of people working at home: 1,465 (17.0% of all workers)
Travel time to work (commute)
- Less than 5 minutes: 198
- 5 to 9 minutes: 765
- 10 to 14 minutes: 726
- 15 to 19 minutes: 750
- 20 to 24 minutes: 1,117
- 25 to 29 minutes: 474
- 30 to 34 minutes: 1,005
- 35 to 39 minutes: 223
- 40 to 44 minutes: 282
- 45 to 59 minutes: 734
- 60 to 89 minutes: 788
- 90 or more minutes: 222
Means of transportation to work:
- Drove a car alone: 5,960 (80.5%)
- Carpooled: 815 (11.0%)
- Bus or trolley bus: 16 (0.2%)
- Streetcar or trolley car: 5 (0.1%)
- Subway or elevated: 115 (1.6%)
- Railroad: 229 (3.1%)
- Ferryboat: 7 (0.1%)
- Taxi: 7 (0.1%)
- Motorcycle: 19 (0.3%)
- Walked: 104 (1.4%)
- Other means: 7 (0.1%)
- Worked at home: 123 (1.7%)


- Year of entry for the foreign-born population in Whitman, Massachusetts
- 751995 to March 2000
- 01990 to 1994
- 391985 to 1989
- 61980 to 1984
- 51975 to 1979
- 121970 to 1974
- 141965 to 1969
- 157Before 1965
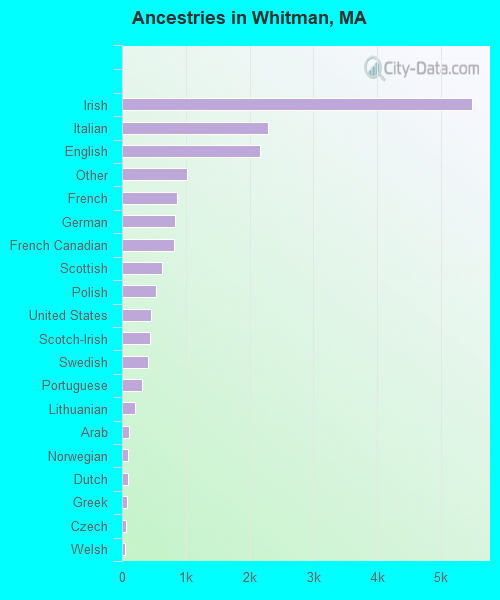
First ancestries reported:
- Irish: 5,481 (32.1%)
- Italian: 2,293 (13.4%)
- English: 2,170 (12.7%)
- Other: 1,016 (6.0%)
- French: 858 (5.0%)
- German: 830 (4.9%)
- French Canadian: 815 (4.8%)
- Scottish: 621 (3.6%)
- Polish: 532 (3.1%)
- United States: 459 (2.7%)
- Scotch-Irish: 437 (2.6%)
- Swedish: 406 (2.4%)
- Portuguese: 317 (1.9%)
- Lithuanian: 200 (1.2%)
- Arab: 109 (0.6%)
- Norwegian: 96 (0.6%)
- Dutch: 93 (0.5%)
- Greek: 75 (0.4%)
- Czech: 55 (0.3%)
- Welsh: 50 (0.3%)
- Subsaharan African: 40 (0.2%)
- Danish: 37 (0.2%)
- Russian: 17 (0.10%)
- West Indian: 17 (0.10%)
- Hungarian: 16 (0.09%)
- Slovak: 12 (0.07%)
Most common places of birth for foreign-born residents (%):
| Whitman: | 24.7% (76) |
| Massachusetts: | 5.2% (40,247) |
| Whitman: | 15.9% (49) |
| Massachusetts: | 3.3% (25,403) |
| Whitman: | 11.0% (34) |
| Massachusetts: | 1.6% (12,350) |
| Whitman: | 9.4% (29) |
| Massachusetts: | 2.3% (17,987) |
| Whitman: | 5.5% (17) |
| Massachusetts: | 1.8% (13,543) |
| Whitman: | 3.9% (12) |
| Massachusetts: | 1.9% (14,883) |
| Whitman: | 3.2% (10) |
| Massachusetts: | 4.7% (36,669) |
| Whitman: | 2.6% (8) |
| Massachusetts: | 0.4% (3,051) |
| Whitman: | 2.6% (8) |
| Massachusetts: | 8.6% (66,627) |
| Whitman: | 2.6% (8) |
| Massachusetts: | 1.7% (13,456) |
| Whitman: | 2.3% (7) |
| Massachusetts: | 0.5% (3,660) |
| Whitman: | 2.3% (7) |
| Massachusetts: | 0.9% (6,691) |
| Whitman: | 2.3% (7) |
| Massachusetts: | 0.4% (2,726) |
| Whitman: | 2.3% (7) |
| Massachusetts: | 0.1% (467) |
| Whitman: | 1.9% (6) |
| Massachusetts: | 1.7% (12,975) |
| Whitman: | 1.9% (6) |
| Massachusetts: | 1.0% (7,937) |
| Whitman: | 1.6% (5) |
| Massachusetts: | 1.0% (7,867) |
Place of birth for U.S.-born residents:
- This state: 12,236
- Other state: 1,259
- Northeast: 753
- Midwest: 119
- South: 235
- West: 152
65% of Whitman residents lived in the same house 5 years ago.
Out of people who lived in different houses, 62% lived in this county.
Out of people who lived in different counties, 81% lived in Massachusetts.
Education attainment for males 25 years and older:
- No schooling: 15
- Nursery to 4th grade: 4
- 5th and 6th grade: 4
- 7th and 8th grade: 23
- 9th grade: 33
- 10th grade: 122
- 11th grade: 90
- 12th grade, no diploma: 173
- High school graduate (or equivalency): 1,655
- Less than 1 year of college: 326
- Some college more than 1 year, no degree: 639
- Associate degree: 342
- Bachelor's degree: 673
- Master's degree: 155
- Professional school degree: 65
- Doctorate degree: 26

Education attainment for females 25 years and older:
- No schooling: 12
- Nursery to 4th grade: 0
- 5th and 6th grade: 0
- 7th and 8th grade: 44
- 9th grade: 37
- 10th grade: 126
- 11th grade: 69
- 12th grade, no diploma: 134
- High school graduate (or equivalency): 1,728
- Less than 1 year of college: 464
- Some college more than 1 year, no degree: 504
- Associate degree: 530
- Bachelor's degree: 811
- Master's degree: 172
- Professional school degree: 61
- Doctorate degree: 0


Housing units in structures:
- One, detached: 3,279
- One, attached: 148
- Two: 631
- 3 or 4: 528
- 5 to 9: 217
- 10 to 19: 53
- 20 to 49: 109
- 50 or more: 132
- Mobile homes: 7
Median worth of mobile homes: $96,917
Housing units lacking complete kitchen facilities: 0.0%

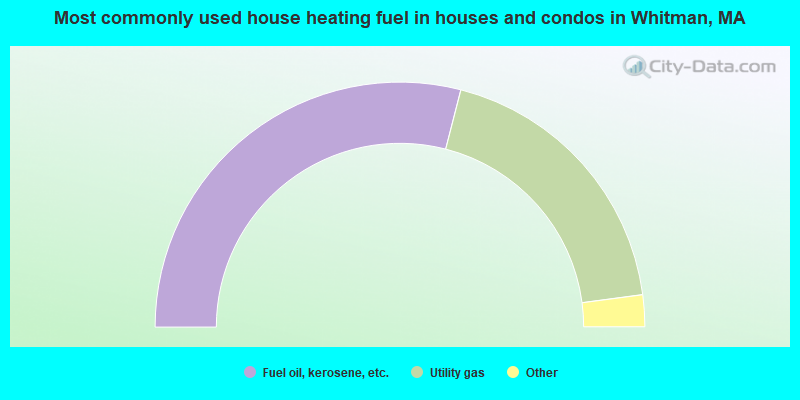
- 58.0%Fuel oil, kerosene, etc.
- 37.8%Utility gas
- 2.7%Electricity
- 0.6%Coal or coke
- 0.5%Bottled, tank, or LP gas
- 0.2%Other fuel
- 0.2%Wood
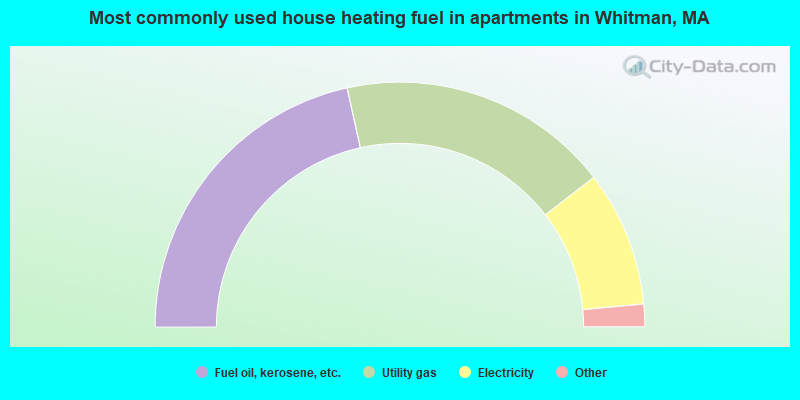
- 43.1%Fuel oil, kerosene, etc.
- 36.0%Utility gas
- 17.9%Electricity
- 2.0%Bottled, tank, or LP gas
- 0.6%No fuel used
- 0.4%Other fuel
Private vs. public school enrollment:
| Here: | 4.7% |
| Massachusetts: | 10.8% |
| Here: | 10.3% |
| Massachusetts: | 12.2% |
| Here: | 34.3% |
| Massachusetts: | 48.2% |


