Wheeling, WV (West Virginia) Houses and Residents
Estimated median house or condo value in 2022: $139,994 (it was $67,300 in 2000 )
Wheeling:
$139,994West Virginia:
$155,100
Lower value quartile - upper value quartile: $81,185 - $224,780Mean price in 2022: Detached houses: $197,055 Here:
$197,055State:
$206,655
Townhouses or other attached units: $117,828 Here:
$117,828State:
$205,683
In 2-unit structures: $102,795 Here:
$102,795State:
$127,101
In 3-to-4-unit structures: $105,608 Here:
$105,608State:
$136,692
In 5-or-more-unit structures: $112,754 Here:
$112,754State:
$177,533
Mobile homes: $60,342 Here:
$60,342State:
$63,963
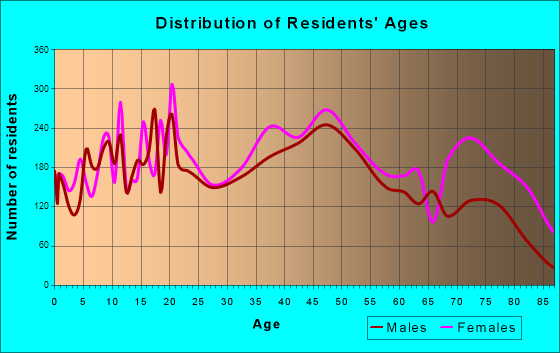
Total population: 27,790 (All urban)
Houses: 14,470 (11,794 occupied: 7,337 owner occupied, 4,756 renter occupied )
% of renters here:
39%State:
26%
Housing density: 1,040 houses/condos per square mile
Median price asked for vacant for-sale houses and condos in 2022: $114,268.
Median contract rent in 2022: $608 (lower quartile is $373, upper quartile is $763)
Median rent asked for vacant for-rent units in 2022: $721
Median gross rent in Wheeling, WV in 2022: $715
Housing units in Wheeling with a mortgage: 3,721 (489 second mortgage, 0 home equity loan, 454 both second mortgage and home equity loan )Houses without a mortgage: 161
Median household income for houses/condos with a mortgage: $93,215
Median household income for apartments without a mortgage: $52,143
Median monthly housing costs: $702
Data:
Median house or condo value ($)
Median house or condo value ($ change since 2000)
Median house or condo value ($) - White
Median house or condo value ($) - Black or African American
Median house or condo value ($) - Asian
Median house or condo value ($) - Hispanic or Latino
Median house or condo value ($) - American Indian and Alaska Native
Median house or condo value ($) - Multirace
Median house or condo value ($) - Other Race
Median price asked for mobile homes ($)
Household density (households per square mile)
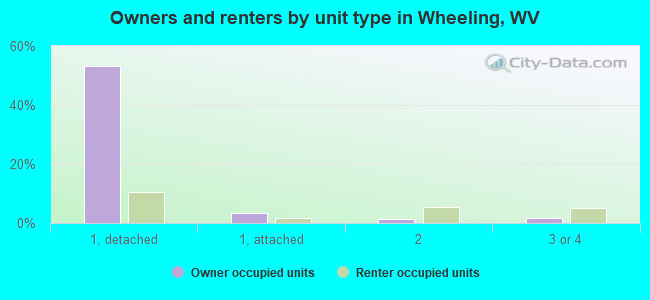
Mean house or condo value by units in structure - 1, detached ($)
Mean house or condo value by units in structure - 1, attached ($)
Mean house or condo value by units in structure - 2 ($)
Mean house or condo value by units in structure by units in structure - 3 or 4 ($)
Mean house or condo value by units in structure - 5 or more ($)
Mean house or condo value by units in structure - Boat, RV, van, etc. ($)
Mean house or condo value by units in structure - Mobile home ($)
Median contract rent ($)
Median contract rent - Lower quartile ($)
Median contract rent - Upper quartile ($)
Median gross rent ($)
Urban houses (%)
Rural houses (%)
Houses occupied (%)
Houses occupied (% change since 2000)
Houses owner occupied (%)
Houses owner occupied (% change since 2000)
Houses renter occupied (%)
Houses renter occupied (% change since 2000)
Vacant housing units - For rent (%)
Vacant housing units - For rent (% change since 2000)
Vacant housing units - For sale only (%)
Vacant housing units - For sale only (% change since 2000)
Vacant housing units - Rented or sold, not occupied (%)
Vacant housing units - Rented or sold, not occupied (% change since 2000)
Vacant housing units - For seasonal, recreational, or occasional use (%)
Vacant housing units - For seasonal, recreational, or occasional use (% change since 2000)
Vacant housing units - For migrant workers (%)
Vacant housing units - For migrant workers (% change since 2000)
Vacant housing units - Other vacant (%)
Vacant housing units - Other vacant (% change since 2000)
Median monthly housing costs ($)
Median household income for houses/condos with a mortgage ($)
Median household income for houses/condos without a mortgage ($)
Median household income ($)
Median household income ($) - White
Median household income ($) - Black or African American
Median household income ($) - Asian
Median household income ($) - Hispanic or Latino
Median household income ($) - American Indian and Alaska Native
Median household income ($) - Multirace
Median household income ($) - Other Race
Mortgage status - with mortgage (%)
Mortgage status - with second mortgage (%)
Mortgage status - with home equity loan (%)
Mortgage status - with both second mortgage and home equity loan (%)
Mortgage status - without a mortgage (%)
Median year house/condo built
Median year apartment built
Household type by relationship - Male householder living alone (%)
Household type by relationship - Male householder not living alone (%)
Household type by relationship - Female householder living alone (%)
Household type by relationship - Female householder not living alone (%)
Household type by relationship - Opposite-Sex spouse (%)
Household type by relationship - Same-Sex spouse (%)
Household type by relationship - Opposite-Sex unmarried partner (%)
Household type by relationship - Same-Sex unmarried partner (%)
Household type by relationship - In group quarters (%)
Size of family households - 2-person household (%)
Size of family households - 3-person household (%)
Size of family households - 4-person household (%)
Size of family households - 5-person household (%)
Size of family households - 6-person household (%)
Size of family households - 7-or-more-person household (%)
Size of nonfamily households - 1-person household (%)
Size of nonfamily households - 2-person household (%)
Size of nonfamily households - 3-person household (%)
Size of nonfamily households - 4-person household (%)
Size of nonfamily households - 5-person household (%)
Size of nonfamily households - 6-person household (%)
Size of nonfamily households - 7-or-moreperson household (%)
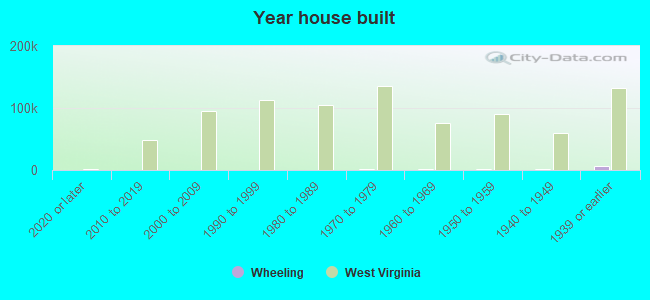
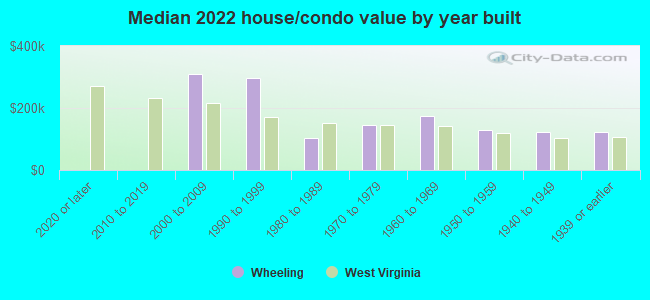
Year house built - Built 2010 or later (%)
Year house built - Built 2000 to 2009 (%)
Year house built - Built 1990 to 1999 (%)
Year house built - Built 1980 to 1989 (%)
Year house built - Built 1970 to 1979 (%)
Year house built - Built 1960 to 1969 (%)
Year house built - Built 1950 to 1959 (%)
Year house built - Built 1940 to 1949 (%)
Year house built - Built 1939 or earlier (%)
Median number of rooms in houses and condos
Median number of rooms in apartments
Median number of bedrooms in owner occupied houses
Mean number of bedrooms in owner occupied houses
Median number of bedrooms in renter occupied houses
Mean number of bedrooms in renter occupied houses
Median number of vehichles in owner occupied houses
Mean number of vehichles in owner occupied houses
Median number of vehichles in renter occupied houses
Mean number of vehichles in renter occupied houses
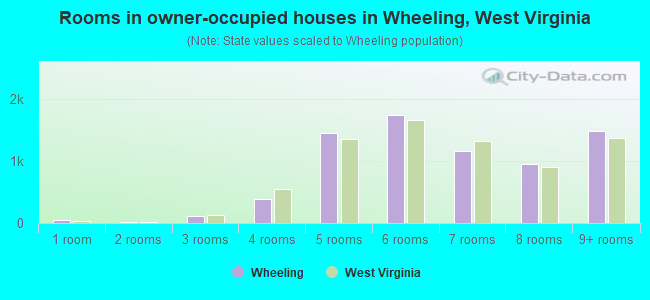
Rooms in owner-occupied houses - 1 room (%)
Rooms in owner-occupied houses - 2 rooms (%)
Rooms in owner-occupied houses - 3 rooms (%)
Rooms in owner-occupied houses - 4 rooms (%)
Rooms in owner-occupied houses - 5 rooms (%)
Rooms in owner-occupied houses - 6 rooms (%)
Rooms in owner-occupied houses - 7 rooms (%)
Rooms in owner-occupied houses - 8 rooms (%)
Rooms in owner-occupied houses - 9+ rooms (%)
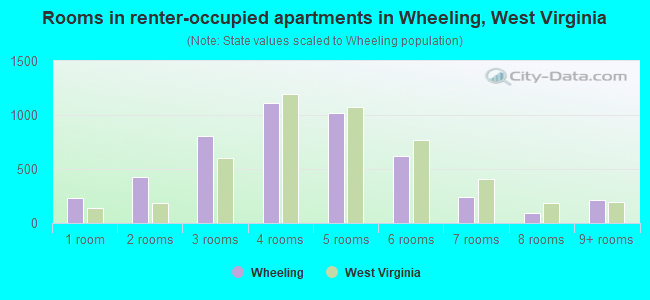
Rooms in renter-occupied houses - 1 room (%)
Rooms in renter-occupied houses - 2 rooms (%)
Rooms in renter-occupied houses - 3 rooms (%)
Rooms in renter-occupied houses - 4 rooms (%)
Rooms in renter-occupied houses - 5 rooms (%)
Rooms in renter-occupied houses - 6 rooms (%)
Rooms in renter-occupied houses - 7 rooms (%)
Rooms in renter-occupied houses - 8 rooms (%)
Rooms in renter-occupied houses - 9+ rooms (%)
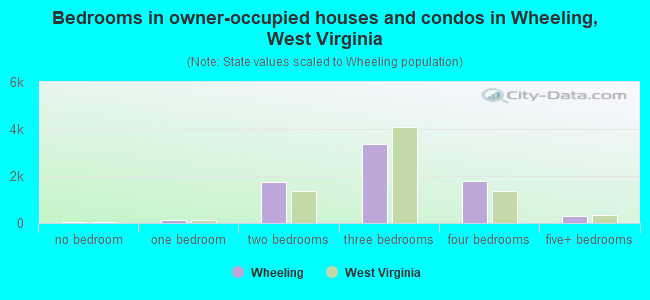
Bedrooms in owner-occupied houses - no bedrooms (%)
Bedrooms in owner-occupied houses - 1 bedroom (%)
Bedrooms in owner-occupied houses - 2 bedrooms (%)
Bedrooms in owner-occupied houses - 3 bedrooms (%)
Bedrooms in owner-occupied houses - 4 bedrooms (%)
Bedrooms in owner-occupied houses - 5+ bedrooms (%)
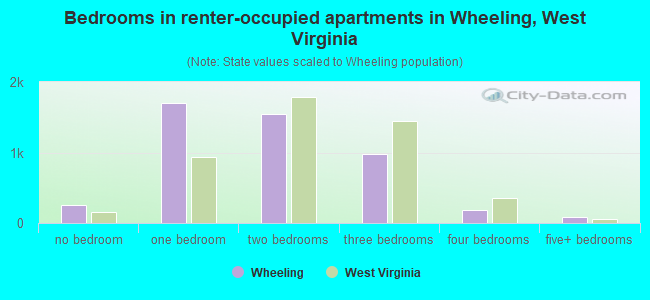
Bedrooms in renter-occupied houses - no bedrooms (%)
Bedrooms in renter-occupied houses - 1 bedroom (%)
Bedrooms in renter-occupied houses - 2 bedrooms (%)
Bedrooms in renter-occupied houses - 3 bedrooms (%)
Bedrooms in renter-occupied houses - 4 bedrooms (%)
Bedrooms in renter-occupied houses - 5+ bedrooms (%)
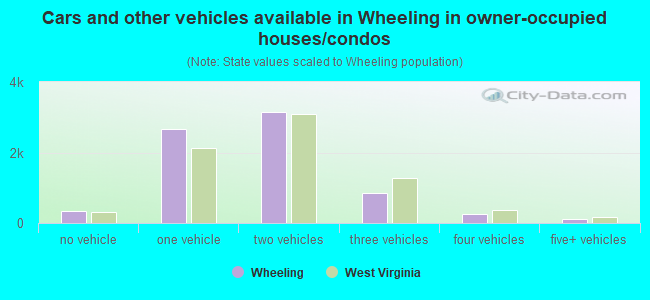
Vehicles available in owner-occupied houses - no vehicle available (%)
Vehicles available in owner-occupied houses - 1 vehicle available(%)
Vehicles available in owner-occupied houses - 2 Vehicles available (%)
Vehicles available in owner-occupied houses - 3 Vehicles available (%)
Vehicles available in owner-occupied houses - 4 Vehicles available (%)
Vehicles available in owner-occupied houses - 5+ Vehicles available (%)
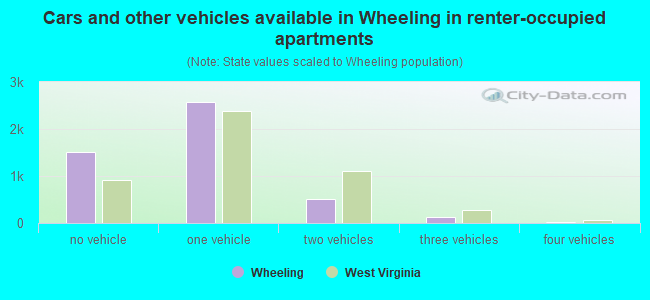
Vehicles available in renter-occupied houses - no vehicle available (%)
Vehicles available in renter-occupied houses - 1 vehicle available (%)
Vehicles available in renter-occupied houses - 2 Vehicles available (%)
Vehicles available in renter-occupied houses - 3 Vehicles available (%)
Vehicles available in renter-occupied houses - 4 Vehicles available (%)
Vehicles available in renter-occupied houses - 5+ Vehicles available (%)
Housing units in structures - 1, detached (%)
Housing units in structures - 1, attached (%)
Housing units in structures - 2 (%)
Housing units in structures - 3 or 4 (%)
Housing units in structures - 5 to 9 (%)
Housing units in structures - 10 to 19 (%)
Housing units in structures - 20 to 49 (%)
Housing units in structures - 50 or more (%)
Housing units in structures - Mobile home (%)
Housing units in structures - Boat, RV, van, etc. (%)
Housing units in structures - Owners - 1, detached (%)
Housing units in structures - Owners - 1, attached (%)
Housing units in structures - Owners - 2 (%)
Housing units in structures - Owners - 3 or 4 (%)
Housing units in structures - Owners - 5 to 9 (%)
Housing units in structures - Owners - 10 to 19 (%)
Housing units in structures - Owners - 20 to 49 (%)
Housing units in structures - Owners - 50 or more (%)
Housing units in structures - Owners - Mobile home (%)
Housing units in structures - Owners - Boat, RV, van, etc. (%)
Housing units in structures - Renters - 1, detached (%)
Housing units in structures - Renters - 1, attached (%)
Housing units in structures - Renters - 2 (%)
Housing units in structures - Renters - 3 or 4 (%)
Housing units in structures - Renters - 5 to 9 (%)
Housing units in structures - Renters - 10 to 19 (%)
Housing units in structures - Renters - 20 to 49 (%)
Housing units in structures - Renters - 50 or more (%)
Housing units in structures - Renters - Mobile home (%)
Housing units in structures - Renters - Boat, RV, van, etc. (%)
House/condo owner moved in on average (years ago)
Renter moved in on average (years ago)
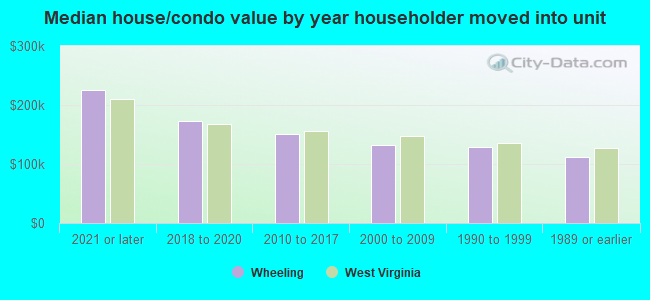
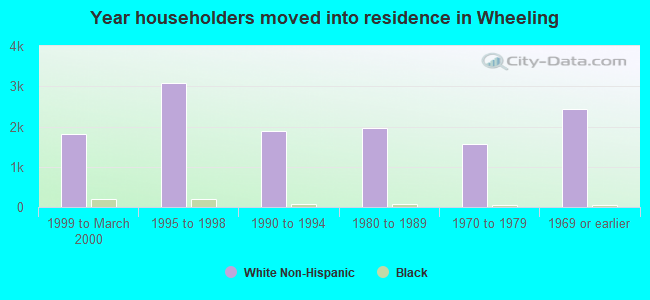
Year householder moved into unit - Moved in 1999 to March 2000 (%)
Year householder moved into unit - Moved in 1999 to March 2000 (%) - White
Year householder moved into unit - Moved in 1999 to March 2000 (%) - Black or African American
Year householder moved into unit - Moved in 1999 to March 2000 (%) - Asian
Year householder moved into unit - Moved in 1999 to March 2000 (%) - Hispanic or Latino
Year householder moved into unit - Moved in 1999 to March 2000 (%) - American Indian and Alaska Native
Year householder moved into unit - Moved in 1999 to March 2000 (%) - Multirace
Year householder moved into unit - Moved in 1999 to March 2000 (%) - Other Race
Year householder moved into unit - Moved in 1995 to 1998 (%)
Year householder moved into unit - Moved in 1995 to 1998 (%) - White
Year householder moved into unit - Moved in 1995 to 1998 (%) - Black or African American
Year householder moved into unit - Moved in 1995 to 1998 (%) - Asian
Year householder moved into unit - Moved in 1995 to 1998 (%) - Hispanic or Latino
Year householder moved into unit - Moved in 1995 to 1998 (%) - American Indian and Alaska Native
Year householder moved into unit - Moved in 1995 to 1998 (%) - Multirace
Year householder moved into unit - Moved in 1995 to 1998 (%) - Other Race
Year householder moved into unit - Moved in 1990 to 1994 (%)
Year householder moved into unit - Moved in 1990 to 1994 (%) - White
Year householder moved into unit - Moved in 1990 to 1994 (%) - Black or African American
Year householder moved into unit - Moved in 1990 to 1994 (%) - Asian
Year householder moved into unit - Moved in 1990 to 1994 (%) - Hispanic or Latino
Year householder moved into unit - Moved in 1990 to 1994 (%) - American Indian and Alaska Native
Year householder moved into unit - Moved in 1990 to 1994 (%) - Multirace
Year householder moved into unit - Moved in 1990 to 1994 (%) - Other Race
Year householder moved into unit - Moved in 1980 to 1989 (%)
Year householder moved into unit - Moved in 1980 to 1989 (%) - White
Year householder moved into unit - Moved in 1980 to 1989 (%) - Black or African American
Year householder moved into unit - Moved in 1980 to 1989 (%) - Asian
Year householder moved into unit - Moved in 1980 to 1989 (%) - Hispanic or Latino
Year householder moved into unit - Moved in 1980 to 1989 (%) - American Indian and Alaska Native
Year householder moved into unit - Moved in 1980 to 1989 (%) - Multirace
Year householder moved into unit - Moved in 1980 to 1989 (%) - Other Race
Year householder moved into unit - Moved in 1970 to 1979 (%)
Year householder moved into unit - Moved in 1970 to 1979 (%) - White
Year householder moved into unit - Moved in 1970 to 1979 (%) - Black or African American
Year householder moved into unit - Moved in 1970 to 1979 (%) - Asian
Year householder moved into unit - Moved in 1970 to 1979 (%) - Hispanic or Latino
Year householder moved into unit - Moved in 1970 to 1979 (%) - American Indian and Alaska Native
Year householder moved into unit - Moved in 1970 to 1979 (%) - Multirace
Year householder moved into unit - Moved in 1970 to 1979 (%) - Other Race
Year householder moved into unit - Moved in 1969 or earlier (%)
Year householder moved into unit - Moved in 1969 or earlier (%) - White
Year householder moved into unit - Moved in 1969 or earlier (%) - Black or African American
Year householder moved into unit - Moved in 1969 or earlier (%) - Asian
Year householder moved into unit - Moved in 1969 or earlier (%) - Hispanic or Latino
Year householder moved into unit - Moved in 1969 or earlier (%) - American Indian and Alaska Native
Year householder moved into unit - Moved in 1969 or earlier (%) - Multirace
Year householder moved into unit - Moved in 1969 or earlier (%) - Other Race
Housing units lacking complete plumbing facilities (%)
Housing units lacking complete kitchen facilities (%)
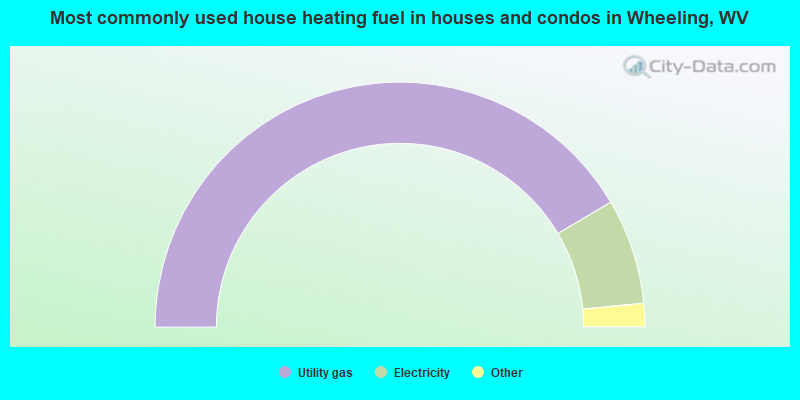
House heating fuel used in houses and condos - Utility gas (%)
House heating fuel used in houses and condos - Bottled, tank, or LP gas (%)
House heating fuel used in houses and condos - Electricity (%)
House heating fuel used in houses and condos - Fuel oil, kerosene, etc. (%)
House heating fuel used in houses and condos - Coal or coke (%)
House heating fuel used in houses and condos - Wood (%)
House heating fuel used in houses and condos - Solar energy (%)
House heating fuel used in houses and condos - Other fuel (%)
House heating fuel used in houses and condos - No fuel used (%)
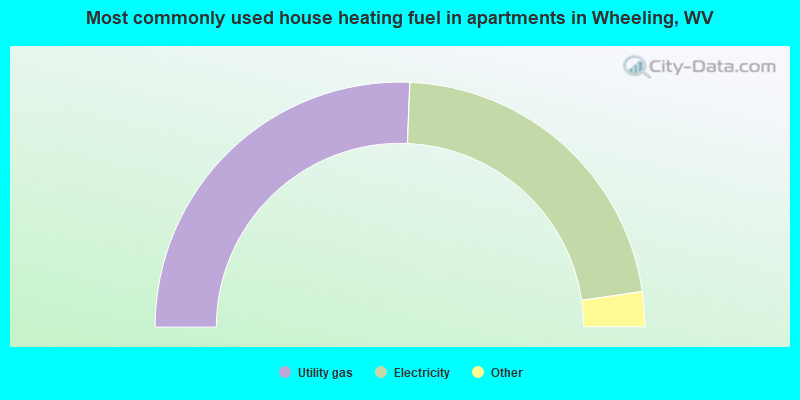
House heating fuel used in apartments - Utility gas (%)
House heating fuel used in apartments - Bottled, tank, or LP gas (%)
House heating fuel used in apartments - Electricity (%)
House heating fuel used in apartments - Fuel oil, kerosene, etc. (%)
House heating fuel used in apartments - Coal or coke (%)
House heating fuel used in apartments - Wood (%)
House heating fuel used in apartments - Solar energy (%)
House heating fuel used in apartments - Other fuel (%)
House heating fuel used in apartments - No fuel used (%)
Latest news about housing in Wheeling, WV collected exclusively by city-data.com from local newspapers, TV, and radio stations
Median year house/condo built: 1944Median year apartment built: 1963Household type by relationship:
Households: 26,632
Male householders: 5,495 (2,042 living alone ), Female householders: 6,147 (2,984 living alone )4,047 spouses (3,998 opposite-sex spouses ), 692 unmarried partners , (647 opposite-sex unmarried partners ), 6,644 children (6,092 natural , 250 adopted , 300 stepchildren ), 878 grandchildren , 380 brothers or sisters , 130 parents , 21 foster children , 287 other relatives , 730 non-relatives In group quarters: 1,177
Size of family households: 3,080 2-persons , 1,544 3-persons , 1,065 4-persons , 344 5-persons , 179 6-persons , 20 7-or-more-persons .
Size of nonfamily households: 5,197 1-person , 501 2-persons , 113 3-persons , 30 4-persons .
2,684 married couples with children. single-parent households (476 men , 1,402 women ).
97.5% of residents of Wheeling speak English at home. of residents speak Spanish at home (61% speak English very well , 13% speak English well , 24% speak English not well , 2% don't speak English at all ).of residents speak other Indo-European language at home (59% speak English very well , 15% speak English well , 26% speak English not well ).of residents speak Asian or Pacific Island language at home (69% speak English very well , 25% speak English well , 6% speak English not well ).of residents speak other language at home (100% speak English very well ).
Foreign born population: 659 (2.5%)of them are naturalized citizens )
Median number of rooms in houses and condos:
Median number of rooms in apartments
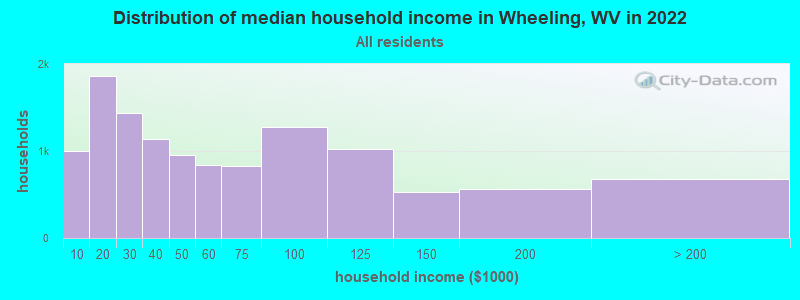
Wheeling, WV household income distribution 1,001 Less than $10,0001,863 $10,000 to $19,9991,432 $20,000 to $29,9991,136 $30,000 to $39,999951 $40,000 to $49,999842 $50,000 to $59,999823 $60,000 to $74,9991,277 $75,000 to $99,9991,026 $100,000 to $124,999532 $125,000 to $149,999559 $150,000 to $199,999674 $200,000 or more
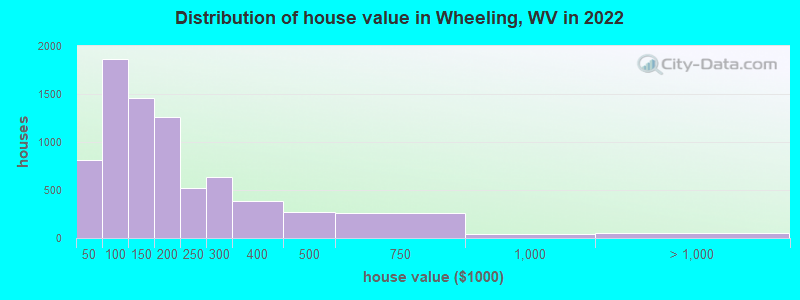
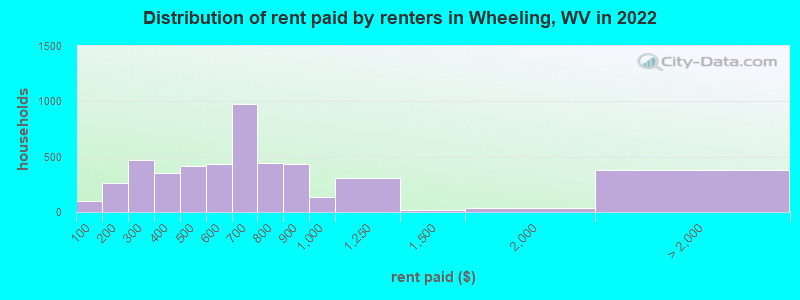
Home value of owner - occupied houses in 2022 in Wheeling, WV 49 Less than $10,000101 $10,000 to $14,99944 $15,000 to $19,999129 $20,000 to $24,999126 $25,000 to $29,99978 $30,000 to $34,99961 $35,000 to $39,999218 $40,000 to $49,999227 $50,000 to $59,999332 $60,000 to $69,999442 $70,000 to $79,999410 $80,000 to $89,999236 $90,000 to $99,999889 $100,000 to $124,999573 $125,000 to $149,999751 $150,000 to $174,999511 $175,000 to $199,999517 $200,000 to $249,999632 $250,000 to $299,999385 $300,000 to $399,999273 $400,000 to $499,999265 $500,000 to $749,99945 $750,000 to $999,99911 $1,000,000 to $1,499,99929 $1,500,000 to $1,999,9997 $2,000,000 or moreRent paid by renters in 2022 in Wheeling, WV 99 Less than $100176 $100 to $14988 $150 to $199286 $200 to $249185 $250 to $299170 $300 to $349184 $350 to $399196 $400 to $449221 $450 to $499252 $500 to $549182 $550 to $599601 $600 to $649372 $650 to $699219 $700 to $749227 $750 to $799437 $800 to $899138 $900 to $999306 $1,000 to $1,24922 $1,250 to $1,49932 $1,500 to $1,99937 $3,500 or more343 No cash rent
Percentage of workers working in this county: 76.7%Number of people working at home: 788 (7.1% of all workers )
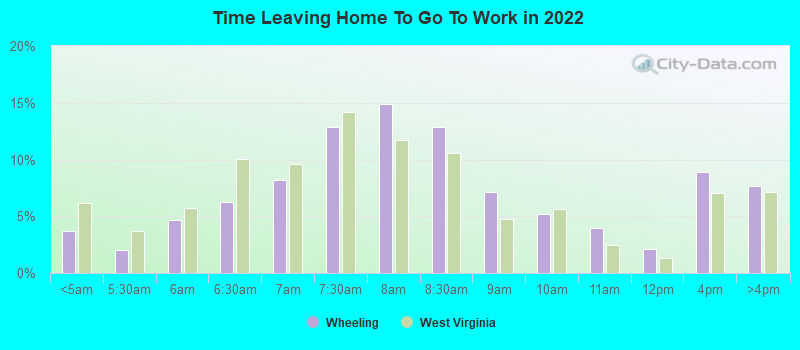
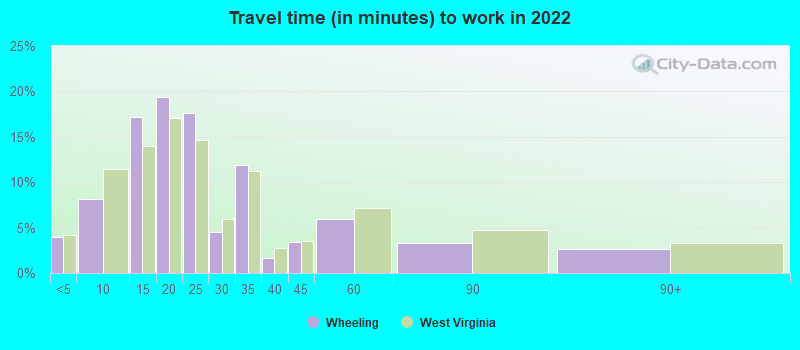
Travel time to work (commute)
Less than 5 minutes: 6865 to 9 minutes: 1,47310 to 14 minutes: 2,44415 to 19 minutes: 1,99920 to 24 minutes: 1,41725 to 29 minutes: 30230 to 34 minutes: 62935 to 39 minutes: 14440 to 44 minutes: 13045 to 59 minutes: 37760 to 89 minutes: 44090 or more minutes: 164
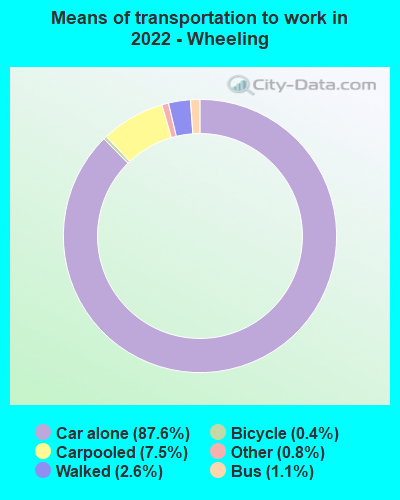
Means of transportation to work:
Drove a car alone: 17,985 (83.2%)Carpooled: 1,540 (7.1%)Bus : 214 (1.0%)Taxi: 192 (0.9%)Bicycle: 32 (0.1%)Walked: 501 (2.3%)Worked at home: 788 (3.6%)
Unemployment by race in 2022
Unemployment rate for White non-Hispanic residents 3.9% Males4.9% FemalesUnemployment rate for Black residents 22.2% Males10.4% FemalesUnemployment rate for two or more race residents 3.1% Males6.4% FemalesUnemployment rate for Hispanic or Latino residents 3.3% Males
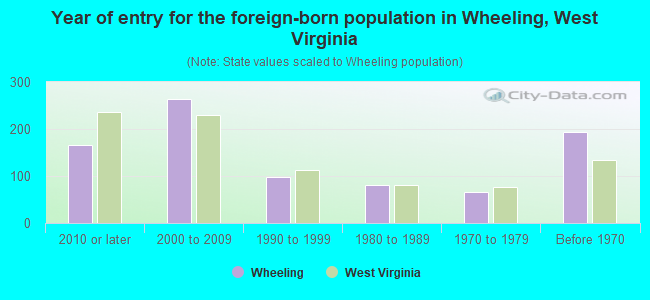
Year of entry for the foreign-born population in Wheeling, West Virginia
167 2010 or later 264 2000 to 2009 98 1990 to 1999 81 1980 to 1989 67 1970 to 1979 193 Before 1970
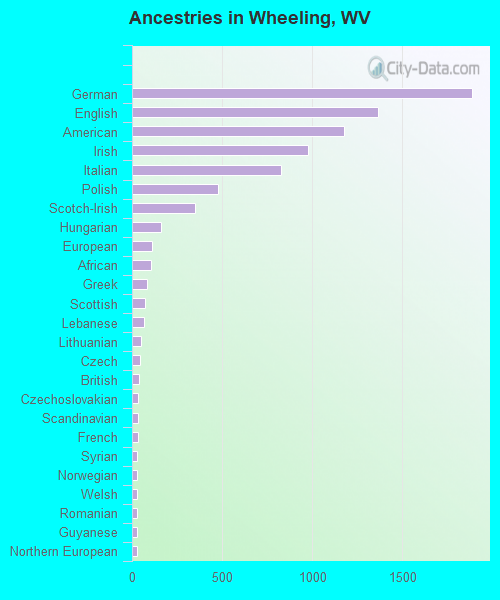
First ancestries reported:
German: 1,887 (19.5%)
English: 1,363 (14.1%)
American: 1,177 (12.2%)
Irish: 975 (10.1%)
Italian: 829 (8.6%)
Polish: 477 (4.9%)
Scotch-Irish: 352 (3.6%)
Hungarian: 161 (1.7%)
European: 113 (1.2%)
African: 106 (1.1%)
Greek: 81 (0.8%)
Scottish: 74 (0.8%)
Lebanese: 67 (0.7%)
Lithuanian: 50 (0.5%)
Czech: 42 (0.4%)
British: 41 (0.4%)
Czechoslovakian: 36 (0.4%)
Scandinavian: 35 (0.4%)
French: 34 (0.4%)
Syrian: 29 (0.3%)
Norwegian: 29 (0.3%)
Welsh: 28 (0.3%)
Romanian: 27 (0.3%)
Guyanese: 25 (0.3%)
Northern European: 25 (0.3%)
Croatian: 21 (0.2%)
Slovak: 20 (0.2%)
French Canadian: 16 (0.2%)
Basque: 15 (0.2%)
Dutch: 12 (0.1%)
Eastern European: 12 (0.1%)
Ukrainian: 11 (0.1%)
Iranian: 11 (0.1%)
Slovene: 8 (0.08%)
Russian: 7 (0.07%)
Austrian: 6 (0.06%)
Haitian: 5 (0.05%)
Serbian: 3 (0.03%)
Jamaican: 3 (0.03%)
Canadian: 1 (0.01%) Most common places of birth for foreign-born residents (%): Italy Wheeling:
18.3% (110)West Virginia:
2.1% (604)
Mexico Wheeling:
13.1% (79)West Virginia:
7.4% (2,143)
United Kingdom, excluding England and Scotland Wheeling:
10.6% (64)West Virginia:
1.5% (442)
Canada Wheeling:
9.8% (59)West Virginia:
4.3% (1,233)
Philippines Wheeling:
6.8% (41)West Virginia:
6.2% (1,798)
India Wheeling:
5.8% (35)West Virginia:
7.2% (2,098)
Other Eastern Europe Wheeling:
3.5% (21)West Virginia:
0.5% (143)
Colombia Wheeling:
3.0% (18)West Virginia:
0.8% (235)
Germany Wheeling:
2.8% (17)West Virginia:
5.5% (1,585)
Hong Kong Wheeling:
2.7% (16)West Virginia:
0.2% (52)
Moldova Wheeling:
2.5% (15)West Virginia:
0.1% (40)
Australia Wheeling:
2.5% (15)West Virginia:
0.5% (148)
Argentina Wheeling:
2.5% (15)West Virginia:
0.6% (173)
China, excluding Hong Kong and Taiwan Wheeling:
2.0% (12)West Virginia:
5.8% (1,673)
Iran Wheeling:
1.8% (11)West Virginia:
0.7% (196)
England Wheeling:
1.7% (10)West Virginia:
2.3% (665)
Venezuela Wheeling:
1.7% (10)West Virginia:
0.7% (199)
Place of birth for U.S.-born residents:
This state: 17,893Other state: 8,041Northeast: 2,208Midwest: 3,179South: 1,963West: 604 86.4% of Wheeling residents lived in the same house 1 years ago.
Out of people who lived in different houses, 30.0% lived in this county.
Out of people who lived in different counties, 51.1% lived in West Virginia.
Wheeling:
86.4%State average:
89.6%
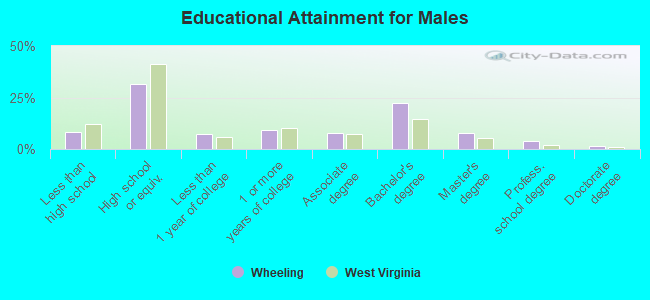
Education attainment for males 25 years and older:
No schooling: 80Nursery to 4th grade: 45th and 6th grade: 127th and 8th grade: 949th grade: 11510th grade: 10011th grade: 19912th grade, no diploma: 166High school graduate (or equivalency): 2,913Less than 1 year of college: 675Some college more than 1 year, no degree: 856Associate degree: 702Bachelor's degree: 2,068Master's degree: 725Professional school degree: 373Doctorate degree: 148
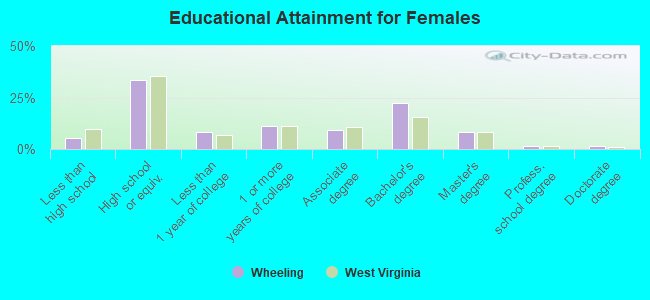
Education attainment for females 25 years and older:
No schooling: 67Nursery to 4th grade: 05th and 6th grade: 27th and 8th grade: 529th grade: 7010th grade: 21811th grade: 8412th grade, no diploma: 56High school graduate (or equivalency): 3,466Less than 1 year of college: 843Some college more than 1 year, no degree: 1,150Associate degree: 949Bachelor's degree: 2,308Master's degree: 863Professional school degree: 129Doctorate degree: 143
Housing units in structures:
One, detached: 8,809One, attached: 906Two: 1,0763 or 4: 1,1145 to 9: 51710 to 19: 24720 to 49: 47150 or more: 1,184Mobile homes: 143Median worth of mobile homes: $23,932
Housing units lacking complete plumbing facilities in 2022: 9.9%Housing units lacking complete kitchen facilities in 2022: 8.9%House/condo owner moved in on average 18 years ago
Renter moved in on average 3 years ago
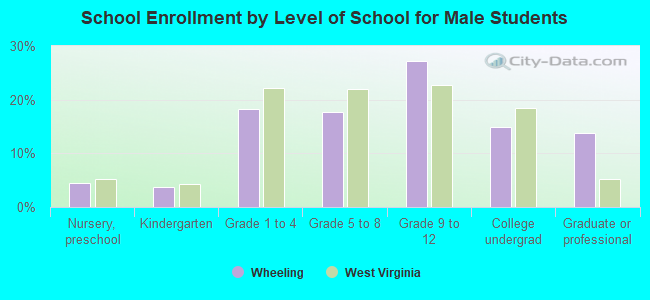
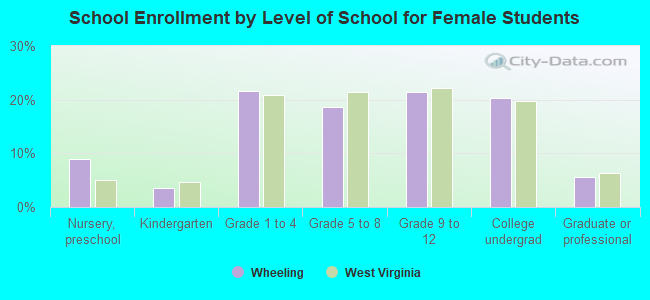
Private vs. public school enrollment:
Students in private schools in grades 1 to 8 (elementary and middle school): 613 Here:
28.2%West Virginia:
12.2%
Students in private schools in grades 9 to 12 (high school): 221 Here:
16.2%West Virginia:
8.8%
Students in private undergraduate colleges: 370 Here:
36.6%West Virginia:
17.3%