Jump to a detailed profile or search site with Google Custom Search

Weston, CT (Connecticut) Houses and Residents

Estimated median house or condo value in 2022: $1,368,694 (it was $633,100 in 2000)
Weston:

$1,368,694
Connecticut:

$347,200
Lower value quartile - upper value quartile: $916,394 - $1,731,596

Total population: 10,179 (Urban population: 8,855, Rural population: 1,182 (all nonfarm))

Houses: 3,532 (3,312 occupied: 3,086 owner occupied, 226 renter occupied)

% of renters here:

7%
State:

34%

Housing density: 178 houses/condos per square mile

Median price asked for vacant for-sale houses and condos in 2022 in this county: $820,471.

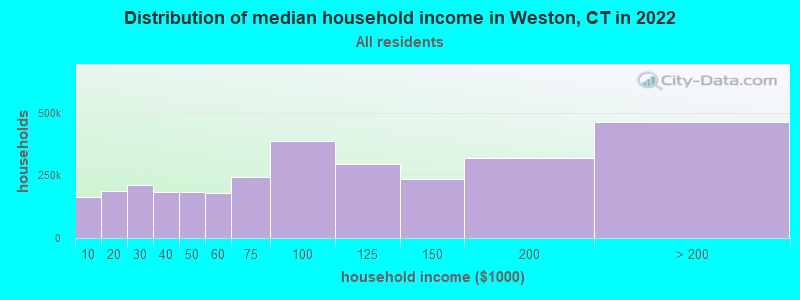
Median contract rent in 2022: $1,906 (lower quartile is $1,362, upper quartile is over $2,000)


Median gross rent in Weston, CT in 2022: over $2,000

Housing units in Weston with a mortgage: 2,242 (125 second mortgage, 468 home equity loan, 13 both second mortgage and home equity loan)
Houses without a mortgage: 643

Compare current foreclosures near Weston, CT:

Check out more offers near Weston, CT.
Powered by Foreclosure.com


Latest news about housing in Weston, CT collected exclusively by city-data.com from local newspapers, TV, and radio stations

Weston, CT forum
Discuss Weston, Connecticut housing on our local forum with over 2,400,000 registered users
Weston, Connecticut Age and Sex of Residents

Household type by relationship:

Households: 897,661
  • In family households: 768,709 (156,025 male householders, 76,871 female householders)
    178,028 spouses, 283,184 children (270,358 natural, 5,825 adopted, 7,001 stepchildren), 13,517 grandchildren, 10,152 brothers or sisters, 9,951 parents, foster children, 13,466 other relatives, 21,162 non-relatives
  • In nonfamily households: 128,952 (44,659 male householders (33,783 living alone)), 57,990 female householders (49,710 living alone)), 26,303 nonrelatives
  • In group quarters: 19,168 (9,152 institutionalized population)

167,032 married couples with children.
41,379 single-parent households (6,664 men, 34,715 women).

92.0% of residents of Weston speak English at home.
2.1% of residents speak Spanish at home (79% speak English very well, 4% speak English well, 17% speak English not well).
5.7% of residents speak other Indo-European language at home (76% speak English very well, 16% speak English well, 7% speak English not well).
0.2% of residents speak Asian or Pacific Island language at home (100% speak English very well).
0.1% of residents speak other language at home (100% speak English very well).

Foreign born population: 1,269 (11.9%)
(66.7% of them are naturalized citizens)

Median number of rooms in houses and condos:
Here:

9.7
State:

6.5

Median number of rooms in apartments
Here:

5.1
State:

4.0

Owner-occupied Renter-occupied
Bedrooms in owner-occupied houses and condos in Weston, Connecticut
  • Bedrooms in owner-occupied houses and condos in Weston, Connecticut
  • 0no bedroom
  • 121 bedroom
  • 1332 bedrooms
  • 7833 bedrooms
  • 1,4554 bedrooms
  • 7035+ bedrooms
Bedrooms in renter-occupied apartments in Weston, Connecticut
  • Bedrooms in renter-occupied apartments in Weston, Connecticut
  • 0no bedroom
  • 831 bedroom
  • 302 bedrooms
  • 523 bedrooms
  • 334 bedrooms
  • 285+ bedrooms
Owner-occupied Renter-occupied
Cars and other vehicles available in Weston in owner-occupied houses/condos
  • Cars and other vehicles available in Weston in owner-occupied houses/condos
  • 25no vehicle
  • 3091 vehicle
  • 1,6152 vehicles
  • 9083 vehicles
  • 1674 vehicles
  • 625+ vehicles
Cars and other vehicles available in Weston in renter-occupied apartments
  • Cars and other vehicles available in Weston in renter-occupied apartments
  • 0no vehicle
  • 1141 vehicle
  • 692 vehicles
  • 283 vehicles
  • 04 vehicles
  • 155+ vehicles
Owner-occupied Renter-occupied
Rooms in owner-occupied houses in Weston, Connecticut
  • Rooms in owner-occupied houses in Weston, Connecticut
  • 01 room
  • 02 rooms
  • 63 rooms
  • 424 rooms
  • 1435 rooms
  • 2336 rooms
  • 3807 rooms
  • 6078 rooms
  • 1,6759+ rooms
Rooms in renter-occupied apartments in Weston, Connecticut
  • Rooms in renter-occupied apartments in Weston, Connecticut
  • 01 room
  • 52 rooms
  • 423 rooms
  • 464 rooms
  • 375 rooms
  • 66 rooms
  • 327 rooms
  • 148 rooms
  • 449+ rooms
Year house built
Breakdown of mean house values by ages of householders
  • Weston, CT household income distribution

  • Distribution of median household income in Weston, CT in 2022
  • 168,899Less than $10,000
  • 193,100$10,000 to $19,999
  • 215,642$20,000 to $29,999
  • 189,365$30,000 to $39,999
  • 190,666$40,000 to $49,999
  • 184,402$50,000 to $59,999
  • 251,202$60,000 to $74,999
  • 395,360$75,000 to $99,999
  • 301,209$100,000 to $124,999
  • 240,276$125,000 to $149,999
  • 326,613$150,000 to $199,999
  • 473,618$200,000 or more

Percentage of workers working in this county: 70.7%
Number of people working at home: 799 (15.8% of all workers)

Travel time to work (commute)

  • Less than 5 minutes: 121
  • 5 to 9 minutes: 187
  • 10 to 14 minutes: 248
  • 15 to 19 minutes: 487
  • 20 to 24 minutes: 617
  • 25 to 29 minutes: 196
  • 30 to 34 minutes: 344
  • 35 to 39 minutes: 112
  • 40 to 44 minutes: 216
  • 45 to 59 minutes: 320
  • 60 to 89 minutes: 378
  • 90 or more minutes: 640

Means of transportation to work:

  • Drove a car alone: 2,973 (65.6%)
  • Carpooled: 134 (3.0%)
  • Subway or elevated: 12 (0.3%)
  • Railroad: 608 (13.4%)
  • Taxi: 7 (0.2%)
  • Motorcycle: 9 (0.2%)
  • Walked: 96 (2.1%)
  • Other means: 27 (0.6%)
  • Worked at home: 668 (14.7%)
Class of Workers in 2000
Year of entry for the foreign-born population in Weston, Connecticut
  • Year of entry for the foreign-born population in Weston, Connecticut
  • 1611995 to March 2000
  • 271990 to 1994
  • 851985 to 1989
  • 811980 to 1984
  • 1201975 to 1979
  • 831970 to 1974
  • 1061965 to 1969
  • 158Before 1965
Ancestries in Weston, CT <small>(Other ancestries excluded from the graph)</small>

First ancestries reported:

  • Other: 1,930 (15.7%)
  • Irish: 1,772 (14.4%)
  • Italian: 1,400 (11.4%)
  • English: 1,376 (11.2%)
  • German: 1,344 (10.9%)
  • United States: 698 (5.7%)
  • Russian: 691 (5.6%)
  • Polish: 614 (5.0%)
  • French: 450 (3.7%)
  • Swedish: 270 (2.2%)
  • Dutch: 263 (2.1%)
  • Hungarian: 197 (1.6%)
  • Norwegian: 159 (1.3%)
  • Scottish: 148 (1.2%)
  • Scotch-Irish: 127 (1.0%)
  • Lithuanian: 105 (0.9%)
  • Danish: 104 (0.8%)
  • Swiss: 86 (0.7%)
  • Arab: 82 (0.7%)
  • Welsh: 79 (0.6%)
  • Ukrainian: 76 (0.6%)
  • French Canadian: 70 (0.6%)
  • Czech: 68 (0.6%)
  • Greek: 65 (0.5%)
  • West Indian: 57 (0.5%)
  • Slovak: 33 (0.3%)
  • Portuguese: 29 (0.2%)
  • Subsaharan African: 15 (0.1%)

Most common places of birth for foreign-born residents (%):

United Kingdom
Weston:

10.8% (89)
Connecticut:

4.4% (16,395)

Canada
Weston:

9.9% (81)
Connecticut:

5.2% (19,083)

Germany
Weston:

7.4% (61)
Connecticut:

3.1% (11,432)

India
Weston:

6.1% (50)
Connecticut:

4.1% (15,108)

Italy
Weston:

5.1% (42)
Connecticut:

7.0% (26,023)

France
Weston:

4.3% (35)
Connecticut:

0.7% (2,742)

Ireland
Weston:

3.9% (32)
Connecticut:

1.2% (4,344)

Brazil
Weston:

3.5% (29)
Connecticut:

2.8% (10,379)

Poland
Weston:

3.5% (29)
Connecticut:

6.9% (25,507)

Belarus
Weston:

3.4% (28)
Connecticut:

0.1% (554)

Other Northern Europe
Weston:

3.3% (27)
Connecticut:

0.6% (2,220)

Other Eastern Europe
Weston:

3.2% (26)
Connecticut:

2.1% (7,596)

Romania
Weston:

3.0% (25)
Connecticut:

0.6% (2,371)

South Africa
Weston:

2.7% (22)
Connecticut:

0.3% (1,269)

China, excluding Hong Kong and Taiwan
Weston:

2.6% (21)
Connecticut:

2.5% (9,358)

Jamaica
Weston:

2.6% (21)
Connecticut:

7.2% (26,819)

Colombia
Weston:

2.4% (20)
Connecticut:

3.2% (12,009)

Korea
Weston:

1.9% (16)
Connecticut:

1.5% (5,508)

Other Western Europe
Weston:

1.9% (16)
Connecticut:

0.5% (1,983)

Egypt
Weston:

1.8% (15)
Connecticut:

0.3% (1,110)

Netherlands
Weston:

1.8% (15)
Connecticut:

0.4% (1,303)

Iran
Weston:

1.7% (14)
Connecticut:

0.4% (1,513)

Japan
Weston:

1.7% (14)
Connecticut:

0.9% (3,472)

Place of birth for U.S.-born residents:

  • This state: 2,908
  • Other state: 6,168
  • Northeast: 4,305
  • Midwest: 932
  • South: 529
  • West: 402

62% of Weston residents lived in the same house 5 years ago.
   Out of people who lived in different houses, 58% lived in this county.
   Out of people who lived in different counties, 4% lived in Connecticut.

Education attainment for males 25 years and older:

  • No schooling: 4
  • Nursery to 4th grade: 0
  • 5th and 6th grade: 6
  • 7th and 8th grade: 14
  • 9th grade: 15
  • 10th grade: 0
  • 11th grade: 0
  • 12th grade, no diploma: 36
  • High school graduate (or equivalency): 224
  • Less than 1 year of college: 18
  • Some college more than 1 year, no degree: 145
  • Associate degree: 75
  • Bachelor's degree: 1,295
  • Master's degree: 797
  • Professional school degree: 388
  • Doctorate degree: 78
Educational Attainment for Males

Education attainment for females 25 years and older:

  • No schooling: 0
  • Nursery to 4th grade: 0
  • 5th and 6th grade: 4
  • 7th and 8th grade: 8
  • 9th grade: 3
  • 10th grade: 6
  • 11th grade: 20
  • 12th grade, no diploma: 7
  • High school graduate (or equivalency): 331
  • Less than 1 year of college: 112
  • Some college more than 1 year, no degree: 396
  • Associate degree: 212
  • Bachelor's degree: 1,311
  • Master's degree: 697
  • Professional school degree: 155
  • Doctorate degree: 46
Educational Attainment for Females
Weston marital status for males
Weston marital status for females

Housing units in structures:

  • One, detached: 3,463
  • One, attached: 62
  • Two: 7
Year householders moved into residence in Weston
Houses and condos Apartments
Most commonly used house heating fuel in houses and condos in Weston, CT
  • 85.6%Fuel oil, kerosene, etc.
  • 8.8%Utility gas
  • 2.4%Bottled, tank, or LP gas
  • 2.2%Electricity
  • 0.5%Wood
  • 0.4%Other fuel
  • 0.2%No fuel used
Most commonly used house heating fuel in apartments in Weston, CT
  • 86.7%Fuel oil, kerosene, etc.
  • 9.7%Electricity
  • 3.5%Bottled, tank, or LP gas

Private vs. public school enrollment:

Students in private schools in grades 1 to 8 (elementary and middle school): 113
Here:

6.8%
Connecticut:

9.9%

Students in private schools in grades 9 to 12 (high school): 98
Here:

17.7%
Connecticut:

11.0%

Students in private undergraduate colleges: 97
Here:

49.5%
Connecticut:

33.4%
School Enrollment by Level of School for Male Students
School Enrollment by Level of School for Female Students
Age and Sex of Sensory-Disabled Noninstitutionalized Residents
Age and Sex of Physically-Disabled Noninstitutionalized Residents
Age and Sex of Mentally-Disabled Noninstitutionalized Residents
Age and Sex of Self-Care Disabled Noninstitutionalized Residents
Age and Sex of Go-Outside-Home Disabled Noninstitutionalized Residents
Age and Sex of Noninstitutionalized Residents with Employment Disability