Westmoreland, TN (Tennessee) Houses and Residents
| Westmoreland: | $251,295 |
| Tennessee: | $284,800 |
Mean price in 2022:
Detached houses: $265,870
Here: $265,870 State: $374,382 Mobile homes: $106,640
Here: $106,640 State: $101,421
Total population: 2,282 (Urban population: 0, Rural population: 2,146 (45 farm, 2,101 nonfarm))
Houses: 1,055 (974 occupied: 559 owner occupied, 426 renter occupied)
| % of renters here: | 43% |
| State: | 33% |
Housing density: 276 houses/condos per square mile
Median price asked for vacant for-sale houses and condos in 2022: $331,668.
Median contract rent in 2022: $755 (lower quartile is $575, upper quartile is $936)
Median rent asked for vacant for-rent units in 2022: $1,809
Median gross rent in Westmoreland, TN in 2022: $1,078
Housing units in Westmoreland with a mortgage: 353 (14 second mortgage, 0 home equity loan, 2 both second mortgage and home equity loan)
Houses without a mortgage: 5
Median household income for houses/condos with a mortgage: $78,906
Median household income for apartments without a mortgage: $81,297
Median monthly housing costs: $1,060
Compare current foreclosures in Westmoreland, TN:
| Photo | Address | Area | Beds / Baths | Price | Details |
|---|---|---|---|---|---|

|
#1
Old Highway 52
Westmoreland, TN 37186
|
- sq. feet
|
2 baths 4 beds |
show details | |

|
#2
Sumner Dr
Westmoreland, TN 37186
|
1,766 sq. feet
|
1 baths 4 beds |
show details | |

|
#3
Hawkins Rd # A
Westmoreland, TN 37186
|
1,792 sq. feet
|
2 baths - beds |
show details | |

|
#4
John Henry Rd
Westmoreland, TN 37186
|
1,757 sq. feet
|
2 baths - beds |
show details | |

|
#5
Hummingbird Hl
Westmoreland, TN 37186
|
1,749 sq. feet
|
2 baths - beds |
show details | |

|
#6
George Durham Rd
Westmoreland, TN 37186
|
2,300 sq. feet
|
2 baths - beds |
show details | |

|
#7
Old Highway 52
Westmoreland, TN 37186
|
924 sq. feet
|
1 baths - beds |
show details | |

|
#8
Eulia Ln
Westmoreland, TN 37186
|
1,240 sq. feet
|
1 baths - beds |
show details | |

|
#9
Lambert Dr
Westmoreland, TN 37186
|
1,910 sq. feet
|
2 baths - beds |
show details | |

|
#10
Lambert Dr
Westmoreland, TN 37186
|
1,225 sq. feet
|
2 baths - beds |
show details |
| Photo | Address | Area | Beds / Baths | Price | Details |
|---|---|---|---|---|---|

|
#11
Poplar Grove Rd
Westmoreland, TN 37186
|
- sq. feet
|
- baths - beds |
show details | |

|
#12
Siloam Church Rd
Westmoreland, TN 37186
|
- sq. feet
|
- baths - beds |
show details | |

|
#13
Gaines Hill Rd # B
Westmoreland, TN 37186
|
- sq. feet
|
- baths - beds |
show details | |

|
#14
Pumping Station Rd
Westmoreland, TN 37186
|
- sq. feet
|
- baths - beds |
show details | |

|
#15
Austin Peay Hwy
Westmoreland, TN 37186
|
- sq. feet
|
- baths - beds |
show details | |

|
#16
King Robert Ln
Westmoreland, TN 37186
|
- sq. feet
|
- baths - beds |
show details | |

|
#17
Lake Rd
Westmoreland, TN 37186
|
- sq. feet
|
- baths - beds |
show details | |

|
#18
Ben Rd
Westmoreland, TN 37186
|
- sq. feet
|
- baths - beds |
show details | |

|
#19
N Long Creek Rd
Westmoreland, TN 37186
|
- sq. feet
|
- baths - beds |
show details | |

|
#20
Austin Peay Hwy
Westmoreland, TN 37186
|
- sq. feet
|
- baths - beds |
show details |
| Photo | Address | Area | Beds / Baths | Price | Details |
|---|---|---|---|---|---|

|
#21
N 1st St Apt 7b
Westmoreland, TN 37186
|
- sq. feet
|
- baths - beds |
show details | |

|
#22
N 1st St
Westmoreland, TN 37186
|
- sq. feet
|
- baths - beds |
show details | |

|
#23
Buck Graves Rd
Westmoreland, TN 37186
|
- sq. feet
|
- baths - beds |
show details | |

|
#24
Pleasant Grove Rd
Westmoreland, TN 37186
|
- sq. feet
|
- baths - beds |
show details | |

|
#25
W Borders St
Westmoreland, TN 37186
|
- sq. feet
|
- baths - beds |
show details | |

|
#26
Ada Coats Rd
Westmoreland, TN 37186
|
1,386 sq. feet
|
- baths - beds |
show details | |

|
#27
Charles Brown Rd
Westmoreland, TN 37186
|
924 sq. feet
|
- baths - beds |
show details | |

|
#28
Ray St
Westmoreland, TN 37186
|
- sq. feet
|
- baths - beds |
show details | |

|
#29
Siloam Church Rd
Westmoreland, TN 37186
|
- sq. feet
|
- baths - beds |
show details | |

|
#30
Poplar St
Westmoreland, TN 37186
|
528 sq. feet
|
- baths - beds |
show details |
| Photo | Address | Area | Beds / Baths | Price | Details |
|---|---|---|---|---|---|

|
#31
Gaines Hill Rd # A
Westmoreland, TN 37186
|
- sq. feet
|
- baths - beds |
show details | |

|
#32
Absher Branch Rd
Westmoreland, TN 37186
|
- sq. feet
|
- baths - beds |
show details | |

|
Check over 1 million property listings on Foreclosure.com!
|
browse all offers | |||

Latest news about housing in Westmoreland, TN collected exclusively by city-data.com from local newspapers, TV, and radio stations

 | Looking to Move Northern (country) Nashville (5 replies) |
| New FedEx facility and 200 more jobs (4 replies) |
| Median Home Prices by County in Nashville MSA (11 replies) |
| Looking for rental home information for Sumner County,TN (5 replies) |
| Considering Moving to TN from California (13 replies) |
| Upper middle class area with couple acres of property (15 replies) |

Median year apartment built: 1990
Household type by relationship:
Households: 2,807- Male householders: 329 (69 living alone), Female householders: 632 (135 living alone)
518 spouses (518 opposite-sex spouses), 105 unmarried partners, (105 opposite-sex unmarried partners), 892 children (831 natural, 13 adopted, 47 stepchildren), 31 grandchildren, 14 brothers or sisters, 51 parents, 0 foster children, 49 other relatives, 69 non-relatives
- In group quarters: 111
Size of family households: 205 2-persons, 172 3-persons, 206 4-persons, 114 5-persons, 14 6-persons, 6 7-or-more-persons.
Size of nonfamily households: 210 1-person, 73 2-persons, 7 4-persons.
606 married couples with children.
115 single-parent households (2 men, 113 women).
99.1% of residents of Westmoreland speak English at home.
0.2% of residents speak Spanish at home (100% speak English not well).
Foreign born population: 10 (0.4%)
(100.0% of them are naturalized citizens)
| Here: | 6.1 |
| State: | 6.5 |
| Here: | 4.9 |
| State: | 4.4 |

- Bedrooms in owner-occupied houses and condos in Westmoreland, Tennessee
- 0no bedroom
- 01 bedroom
- 972 bedrooms
- 4163 bedrooms
- 404 bedrooms
- 65+ bedrooms

- Bedrooms in renter-occupied apartments in Westmoreland, Tennessee
- 14no bedroom
- 551 bedroom
- 1672 bedrooms
- 1603 bedrooms
- 314 bedrooms
- 05+ bedrooms

- Cars and other vehicles available in Westmoreland in owner-occupied houses/condos
- 11no vehicle
- 701 vehicle
- 2562 vehicles
- 1453 vehicles
- 534 vehicles
- 245+ vehicles

- Cars and other vehicles available in Westmoreland in renter-occupied apartments
- 75no vehicle
- 1411 vehicle
- 1462 vehicles
- 283 vehicles
- 364 vehicles
- 05+ vehicles

- Rooms in owner-occupied houses in Westmoreland, Tennessee
- 01 room
- 02 rooms
- 03 rooms
- 484 rooms
- 1555 rooms
- 1256 rooms
- 647 rooms
- 848 rooms
- 849+ rooms

- Rooms in renter-occupied apartments in Westmoreland, Tennessee
- 141 room
- 02 rooms
- 533 rooms
- 1104 rooms
- 1405 rooms
- 856 rooms
- 197 rooms
- 58 rooms
- 09+ rooms


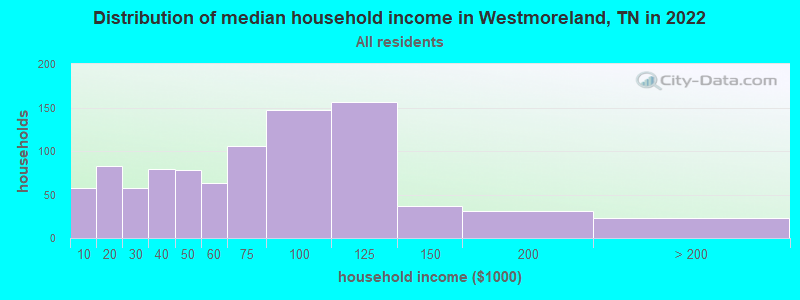
Westmoreland, TN household income distribution

- 58Less than $10,000
- 83$10,000 to $19,999
- 57$20,000 to $29,999
- 79$30,000 to $39,999
- 78$40,000 to $49,999
- 63$50,000 to $59,999
- 106$60,000 to $74,999
- 147$75,000 to $99,999
- 156$100,000 to $124,999
- 37$125,000 to $149,999
- 31$150,000 to $199,999
- 23$200,000 or more
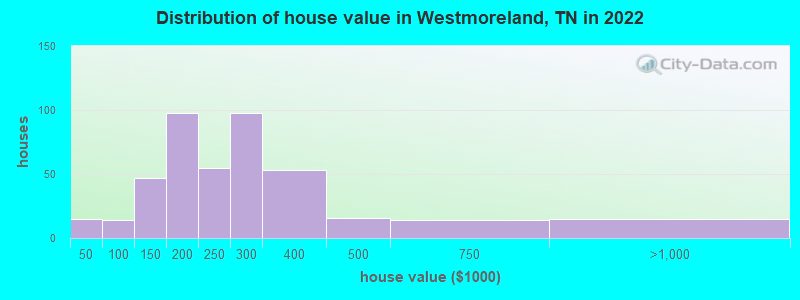
Home value of owner - occupied houses in 2022 in Westmoreland, TN
-
- 5$10,000 to $14,999
- 9$20,000 to $24,999
- 3$50,000 to $59,999
- 8$80,000 to $89,999
- 2$90,000 to $99,999
- 24$100,000 to $124,999
- 22$125,000 to $149,999
- 79$150,000 to $174,999
- 18$175,000 to $199,999
- 54$200,000 to $249,999
- 97$250,000 to $299,999
- 52$300,000 to $399,999
- 15$400,000 to $499,999
- 14$500,000 to $749,999
- 14$750,000 to $999,999
Rent paid by renters in 2022 in Westmoreland, TN
-
- 13$100 to $149
- 8$150 to $199
- 6$200 to $249
- 27$250 to $299
- 5$400 to $449
- 2$450 to $499
- 69$500 to $549
- 25$550 to $599
- 6$600 to $649
- 20$650 to $699
- 38$700 to $749
- 34$750 to $799
- 17$800 to $899
- 5$900 to $999
- 68$1,000 to $1,249
- 4$1,250 to $1,499
- 9No cash rent


Percentage of workers working in this county: 81.5%
Number of people working at home: 174 (14.1% of all workers)
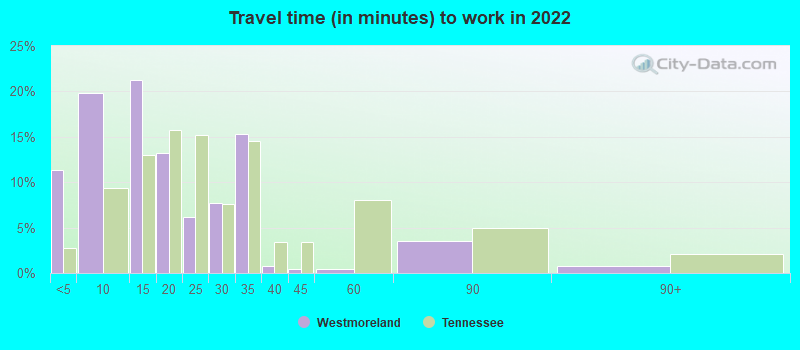
Travel time to work (commute)
- Less than 5 minutes: 79
- 5 to 9 minutes: 55
- 10 to 14 minutes: 25
- 15 to 19 minutes: 6
- 20 to 24 minutes: 140
- 25 to 29 minutes: 67
- 30 to 34 minutes: 271
- 35 to 39 minutes: 137
- 40 to 44 minutes: 65
- 45 to 59 minutes: 139
- 60 to 89 minutes: 65
- 90 or more minutes: 14
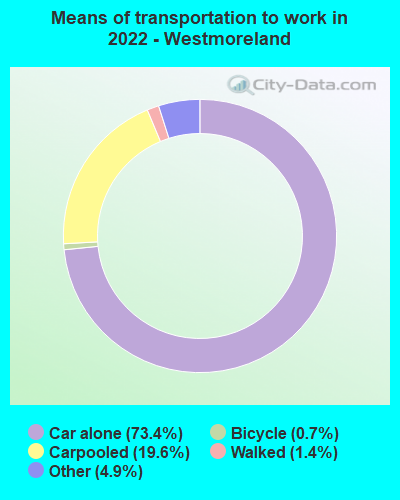
Means of transportation to work:
- Drove a car alone: 957 (64.7%)
- Carpooled: 271 (18.3%)
- Taxi: 79 (5.3%)
- Bicycle: 10 (0.7%)
- Walked: 18 (1.2%)
- Worked at home: 152 (10.3%)

- Unemployment by race in 2022
- Unemployment rate for White non-Hispanic residents
- 2.0%Males
- 4.5%Females
- Unemployment rate for two or more race residents
- 60.0%Males

- Year of entry for the foreign-born population in Westmoreland, Tennessee
- 02010 or later
- 02000 to 2009
- 01990 to 1999
- 51980 to 1989
- 01970 to 1979
- 5Before 1970

First ancestries reported:
- American: 529 (43.8%)
- English: 121 (10.0%)
- German: 80 (6.6%)
- Irish: 38 (3.1%)
- Greek: 27 (2.2%)
- Danish: 14 (1.2%)
- European: 12 (1.0%)
- Polish: 4 (0.3%)
Most common places of birth for foreign-born residents (%):
| Westmoreland: | 72.7% (8) |
| Tennessee: | 0.1% (299) |
Place of birth for U.S.-born residents:
- This state: 1,811
- Other state: 916
- Northeast: 116
- Midwest: 214
- South: 412
- West: 152
88.8% of Westmoreland residents lived in the same house 1 years ago.
Out of people who lived in different houses, 30.3% lived in this county.
Out of people who lived in different counties, 31.2% lived in Tennessee.
| Westmoreland: | 88.8% |
| State average: | 87.0% |
Education attainment for males 25 years and older:
- No schooling: 0
- Nursery to 4th grade: 0
- 5th and 6th grade: 0
- 7th and 8th grade: 28
- 9th grade: 4
- 10th grade: 6
- 11th grade: 30
- 12th grade, no diploma: 16
- High school graduate (or equivalency): 506
- Less than 1 year of college: 57
- Some college more than 1 year, no degree: 36
- Associate degree: 49
- Bachelor's degree: 39
- Master's degree: 17
- Professional school degree: 0
- Doctorate degree: 15

Education attainment for females 25 years and older:
- No schooling: 6
- Nursery to 4th grade: 0
- 5th and 6th grade: 11
- 7th and 8th grade: 29
- 9th grade: 7
- 10th grade: 74
- 11th grade: 41
- 12th grade, no diploma: 18
- High school graduate (or equivalency): 360
- Less than 1 year of college: 44
- Some college more than 1 year, no degree: 85
- Associate degree: 181
- Bachelor's degree: 109
- Master's degree: 19
- Professional school degree: 1
- Doctorate degree: 0


Housing units in structures:
- One, detached: 694
- One, attached: 27
- Two: 20
- 3 or 4: 66
- 5 to 9: 11
- 10 to 19: 37
- 20 to 49: 20
- Mobile homes: 176
Median worth of mobile homes: $128,186
House/condo owner moved in on average 10 years ago
Renter moved in on average 5 years ago

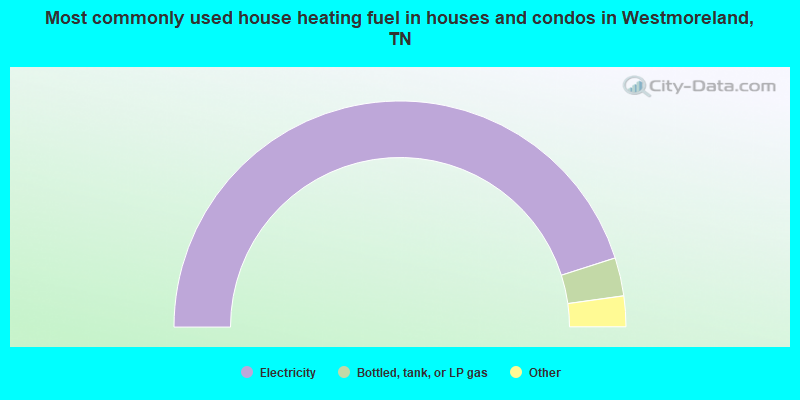
- 90.3%Electricity
- 5.5%Bottled, tank, or LP gas
- 2.8%Utility gas
- 1.3%No fuel used
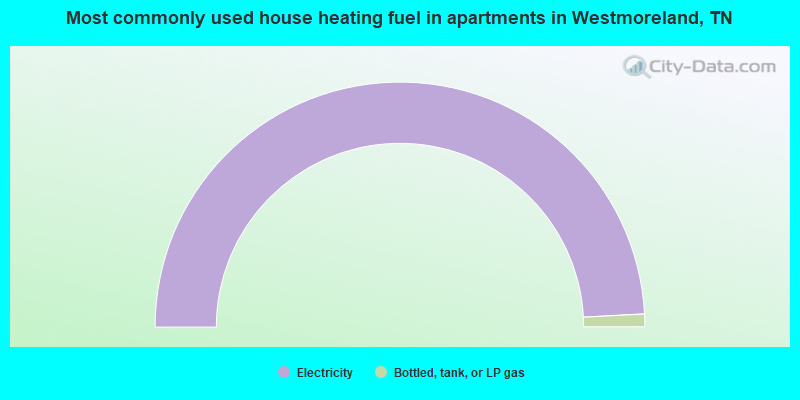
- 98.3%Electricity
- 1.7%Bottled, tank, or LP gas
Private vs. public school enrollment:
| Here: | 0.0% |
| Tennessee: | 15.0% |
| Here: | 5.3% |
| Tennessee: | 16.2% |
| Here: | 0.0% |
| Tennessee: | 23.5% |


