Westmont, PA (Pennsylvania) Houses and Residents
| Westmont: | $163,399 |
| Pennsylvania: | $245,500 |
Mean price in 2022:
Detached houses: $202,533
Here: $202,533 State: $317,202
Total population: 4,990 (All urban)
Houses: 2,120 (2,018 occupied: 1,644 owner occupied, 363 renter occupied)
| % of renters here: | 18% |
| State: | 31% |
Housing density: 894 houses/condos per square mile
Median price asked for vacant for-sale houses and condos in 2022 in this county: $90,499.
Median contract rent in 2022: $595 (lower quartile is $425, upper quartile is $829)
Median rent asked for vacant for-rent units in 2022: $565
Median gross rent in Westmont, PA in 2022: $907
Housing units in Westmont with a mortgage: 930 (82 second mortgage, 0 home equity loan, 73 both second mortgage and home equity loan)
Houses without a mortgage: 53
Median household income for houses/condos with a mortgage: $132,452
Median household income for apartments without a mortgage: $89,559
Median monthly housing costs: $1,007
Compare current foreclosures near Westmont, PA:
| Photo | Address | Area | Beds / Baths | Price | Details |
|---|---|---|---|---|---|

|
#1
Blacks Hill Rd
Boswell, PA 15531
|
1,168 sq. feet
|
1 baths 2 beds |
$120,750
|
show details |

|
#2
Greenich St
Johnstown, PA 15902
|
1,105 sq. feet
|
1 baths 3 beds |
$145,500
|
show details |

|
#3
Bunker Hill Rd
Central City, PA 15926
|
1,769 sq. feet
|
1 baths 3 beds |
$17,900
|
show details |

|
#4
W Milton St
Ebensburg, PA 15931
|
4,394 sq. feet
|
- baths 5 beds |
$169,000
|
show details |

|
#5
Fernwood Pl
Johnstown, PA 15905
|
1,248 sq. feet
|
1 baths 3 beds |
show details | |

|
#6
Route 259
Bolivar, PA 15923
|
1,574 sq. feet
|
2 baths 3 beds |
show details | |

|
#7
Somerset Ave
Windber, PA 15963
|
1,768 sq. feet
|
1 baths 3 beds |
show details | |

|
#8
Dalton Run Rd
Johnstown, PA 15905
|
- sq. feet
|
3 baths 4 beds |
show details | |

|
#9
Virginia Ave
Johnstown, PA 15906
|
1,160 sq. feet
|
1 baths 2 beds |
show details | |

|
#10
Hope St
Johnstown, PA 15902
|
1,318 sq. feet
|
2 baths 3 beds |
show details |
| Photo | Address | Area | Beds / Baths | Price | Details |
|---|---|---|---|---|---|

|
#11
Strangford Rd
Blairsville, PA 15717
|
- sq. feet
|
1 baths 2 beds |
show details | |

|
#12
Ivy St
Parkhill, PA 15945
|
- sq. feet
|
- baths - beds |
$39,900
|
show details |

|
#13
Stockholm Ave
Windber, PA 15963
|
1,472 sq. feet
|
1 baths 3 beds |
show details | |

|
#14
Plummer Rd
Sidman, PA 15955
|
- sq. feet
|
2 baths 2 beds |
show details | |

|
#15
Wilbur Rd
Stoystown, PA 15563
|
1,792 sq. feet
|
1 baths 4 beds |
show details | |

|
#16
Horner St
Windber, PA 15963
|
1,344 sq. feet
|
1 baths 3 beds |
show details | |

|
#17
Sherwood Dr
Johnstown, PA 15905
|
- sq. feet
|
- baths - beds |
$39,900
|
show details |

|
#18
Bedford St
Johnstown, PA 15902
|
- sq. feet
|
2 baths 3 beds |
show details | |

|
#19
Whispering Pines Rd
Cairnbrook, PA 15924
|
1,547 sq. feet
|
1 baths 4 beds |
show details | |

|
#20
Caroline St
Nanty Glo, PA 15943
|
- sq. feet
|
- baths - beds |
$34,900
|
show details |
| Photo | Address | Area | Beds / Baths | Price | Details |
|---|---|---|---|---|---|

|
#21
6th St
Windber, PA 15963
|
1,230 sq. feet
|
1 baths 2 beds |
show details | |

|
#22
E Crawford St
Ebensburg, PA 15931
|
- sq. feet
|
1 baths 4 beds |
show details | |

|
#23
Blue Bird Ln
Portage, PA 15946
|
- sq. feet
|
- baths - beds |
$19,900
|
show details |

|
#24
N Walnut St
Davidsville, PA 15928
|
1,935 sq. feet
|
2 baths 2 beds |
show details | |

|
#25
8th St
Windber, PA 15963
|
1,326 sq. feet
|
1 baths 3 beds |
show details | |

|
#26
Hayes St
Windber, PA 15963
|
1,191 sq. feet
|
1 baths 2 beds |
show details | |

|
#27
Somerset Ave
Windber, PA 15963
|
2,060 sq. feet
|
- baths 4 beds |
show details | |

|
#28
Rudder Rd
Ligonier, PA 15658
|
- sq. feet
|
- baths - beds |
show details | |

|
#29
3rd St
Saint Michael, PA 15951
|
- sq. feet
|
- baths - beds |
show details | |

|
#30
Water Ave
Saint Michael, PA 15951
|
- sq. feet
|
- baths - beds |
show details |
| Photo | Address | Area | Beds / Baths | Price | Details |
|---|---|---|---|---|---|

|
#31
Bracken St
Johnstown, PA 15909
|
- sq. feet
|
- baths - beds |
show details | |

|
#32
Ropers View Rd
Vintondale, PA 15961
|
- sq. feet
|
- baths - beds |
show details | |

|
#33
Route 711
New Florence, PA 15944
|
- sq. feet
|
- baths - beds |
show details | |

|
#34
Portage St
South Fork, PA 15956
|
- sq. feet
|
- baths - beds |
show details | |

|
#35
Rose St
South Fork, PA 15956
|
- sq. feet
|
- baths - beds |
show details | |

|
#36
Graham Ave
Windber, PA 15963
|
- sq. feet
|
- baths - beds |
show details | |

|
#37
Terrapin Dr
Windber, PA 15963
|
- sq. feet
|
- baths - beds |
show details | |

|
#38
Hutchison Hollow Rd
New Florence, PA 15944
|
- sq. feet
|
- baths - beds |
show details | |

|
#39
Railroad St
Windber, PA 15963
|
- sq. feet
|
- baths - beds |
show details | |

|
#40
Penn Ave
Hollsopple, PA 15935
|
- sq. feet
|
- baths - beds |
show details |
| Photo | Address | Area | Beds / Baths | Price | Details |
|---|---|---|---|---|---|

|
#41
Claruth Dr
Windber, PA 15963
|
- sq. feet
|
- baths - beds |
show details | |

|
#42
Route 403 Hwy S
Seward, PA 15954
|
- sq. feet
|
- baths - beds |
show details | |

|
#43
Ligonier St
New Florence, PA 15944
|
- sq. feet
|
- baths - beds |
show details | |

|
#44
Hollow Rd
South Fork, PA 15956
|
- sq. feet
|
- baths - beds |
show details | |

|
#45
Washington St
Seward, PA 15954
|
- sq. feet
|
- baths - beds |
show details | |

|
#46
Washington St
Seward, PA 15954
|
- sq. feet
|
- baths - beds |
show details | |

|
#47
William Penn Ave
Johnstown, PA 15909
|
- sq. feet
|
- baths - beds |
show details | |

|
#48
East Ave
Johnstown, PA 15905
|
- sq. feet
|
- baths - beds |
show details | |

|
#49
Hickory Dr Apt 6
Salix, PA 15952
|
- sq. feet
|
- baths - beds |
show details | |

|
Check over 1 million property listings on Foreclosure.com!
|
browse all offers | |||

Latest news about housing in Westmont, PA collected exclusively by city-data.com from local newspapers, TV, and radio stations

 | Affordable "small" towns with beautiful houses and downtowns? (58 replies) |
| Philadelphia suburb housing price is very high (23 replies) |
| SFH vs townhomes in suburbs of Philadelphia metro (14 replies) |
| Advice Needed by Retired Couple Moving to Philly Area (17 replies) |
| What neighborhoods should I look at? (42 replies) |
| Rental house in Carrick (9 replies) |

Median year apartment built: 1963
Household type by relationship:
Households: 4,896- Male householders: 1,211 (238 living alone), Female householders: 781 (236 living alone)
1,112 spouses (1,085 opposite-sex spouses), 175 unmarried partners, (175 opposite-sex unmarried partners), 1,429 children (1,348 natural, 27 adopted, 53 stepchildren), 31 grandchildren, 33 brothers or sisters, 20 parents, 0 foster children, 0 other relatives, 95 non-relatives
- In group quarters: 4
Size of family households: 849 2-persons, 220 3-persons, 234 4-persons, 119 5-persons, 35 6-persons, 49 7-or-more-persons.
Size of nonfamily households: 459 1-person, 65 2-persons.
788 married couples with children.
286 single-parent households (199 men, 87 women).
98.0% of residents of Westmont speak English at home.
1.4% of residents speak Spanish at home (93% speak English well, 7% speak English not well).
0.1% of residents speak other Indo-European language at home (100% speak English very well).
Foreign born population: 60 (1.2%)
(15.0% of them are naturalized citizens)
| Here: | 7.9 |
| State: | 6.8 |
| Here: | 5.9 |
| State: | 4.3 |

- Bedrooms in owner-occupied houses and condos in Westmont, Pennsylvania
- 0no bedroom
- 01 bedroom
- 1182 bedrooms
- 1,0213 bedrooms
- 3234 bedrooms
- 1825+ bedrooms

- Bedrooms in renter-occupied apartments in Westmont, Pennsylvania
- 0no bedroom
- 451 bedroom
- 1482 bedrooms
- 1603 bedrooms
- 04 bedrooms
- 115+ bedrooms

- Cars and other vehicles available in Westmont in owner-occupied houses/condos
- 0no vehicle
- 3881 vehicle
- 8762 vehicles
- 3023 vehicles
- 794 vehicles
- 05+ vehicles

- Cars and other vehicles available in Westmont in renter-occupied apartments
- 66no vehicle
- 1801 vehicle
- 1182 vehicles
- 03 vehicles
- 04 vehicles
- 05+ vehicles

- Rooms in owner-occupied houses in Westmont, Pennsylvania
- 01 room
- 02 rooms
- 03 rooms
- 274 rooms
- 835 rooms
- 3466 rooms
- 3167 rooms
- 3098 rooms
- 5649+ rooms

- Rooms in renter-occupied apartments in Westmont, Pennsylvania
- 01 room
- 02 rooms
- 03 rooms
- 874 rooms
- 455 rooms
- 1116 rooms
- 617 rooms
- 178 rooms
- 449+ rooms


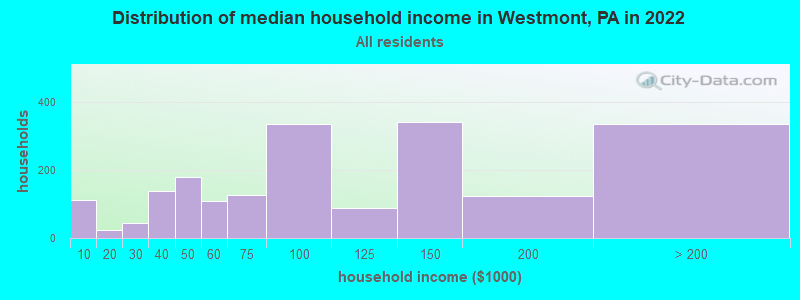
Westmont, PA household income distribution

- 112Less than $10,000
- 23$10,000 to $19,999
- 45$20,000 to $29,999
- 139$30,000 to $39,999
- 179$40,000 to $49,999
- 109$50,000 to $59,999
- 125$60,000 to $74,999
- 334$75,000 to $99,999
- 88$100,000 to $124,999
- 340$125,000 to $149,999
- 123$150,000 to $199,999
- 333$200,000 or more
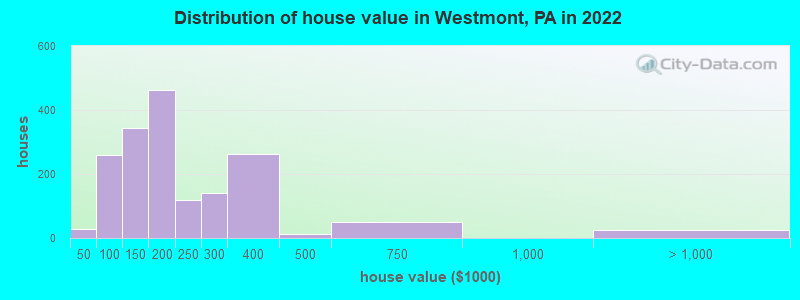
Home value of owner - occupied houses in 2022 in Westmont, PA
-
- 16$20,000 to $24,999
- 10$30,000 to $34,999
- 44$50,000 to $59,999
- 27$60,000 to $69,999
- 53$70,000 to $79,999
- 101$80,000 to $89,999
- 32$90,000 to $99,999
- 210$100,000 to $124,999
- 133$125,000 to $149,999
- 301$150,000 to $174,999
- 159$175,000 to $199,999
- 118$200,000 to $249,999
- 140$250,000 to $299,999
- 260$300,000 to $399,999
- 10$400,000 to $499,999
- 49$500,000 to $749,999
- 25$1,000,000 to $1,499,999
Rent paid by renters in 2022 in Westmont, PA
-
- 22$350 to $399
- 26$400 to $449
- 35$500 to $549
- 104$550 to $599
- 25$600 to $649
- 6$700 to $749
- 23$750 to $799
- 46$800 to $899
- 26$900 to $999
- 13$1,250 to $1,499


Percentage of workers working in this county: 82.1%
Number of people working at home: 459 (22.1% of all workers)
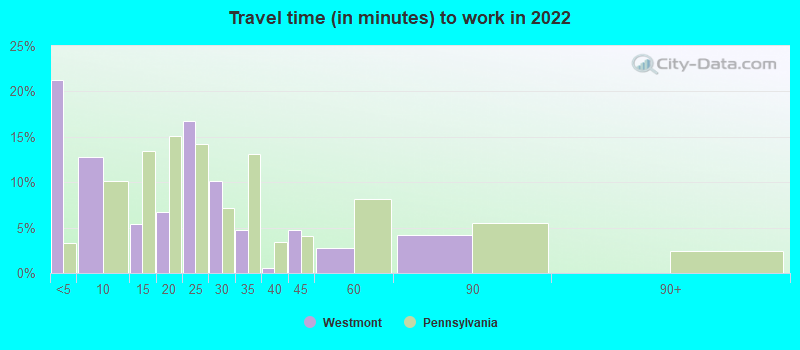
Travel time to work (commute)
- Less than 5 minutes: 95
- 5 to 9 minutes: 254
- 10 to 14 minutes: 353
- 15 to 19 minutes: 407
- 20 to 24 minutes: 136
- 25 to 29 minutes: 36
- 30 to 34 minutes: 33
- 35 to 39 minutes: 5
- 40 to 44 minutes: 57
- 45 to 59 minutes: 88
- 60 to 89 minutes: 134
- 90 or more minutes: 108
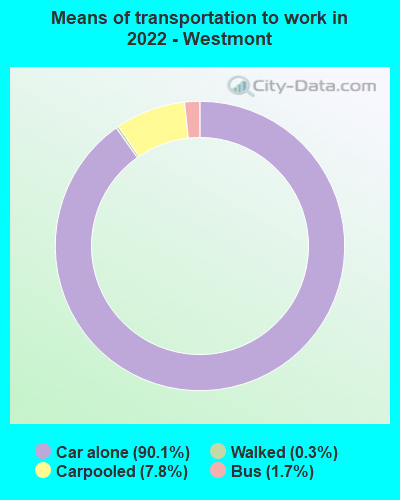
Means of transportation to work:
- Drove a car alone: 509 (55.1%)
- Carpooled: 43 (4.7%)
- Bus: 7 (0.8%)
- Walked: 1 (0.1%)
- Worked at home: 436 (47.2%)

- Unemployment by race in 2022
- Unemployment rate for White non-Hispanic residents
- 12.1%Males
- 1.3%Females
- Unemployment rate for Black residents
- 100.0%Females

- Year of entry for the foreign-born population in Westmont, Pennsylvania
- 392010 or later
- 52000 to 2009
- 01990 to 1999
- 01980 to 1989
- 01970 to 1979
- 52Before 1970

First ancestries reported:
- German: 684 (36.0%)
- Irish: 221 (11.6%)
- Italian: 188 (9.9%)
- European: 157 (8.3%)
- Polish: 122 (6.4%)
- American: 113 (5.9%)
- English: 63 (3.3%)
- Lebanese: 50 (2.6%)
- Slavic: 45 (2.4%)
- Ukrainian: 27 (1.4%)
- Hungarian: 23 (1.2%)
- Slovak: 23 (1.2%)
- Swedish: 19 (1.0%)
- Austrian: 15 (0.8%)
- Serbian: 15 (0.8%)
- Armenian: 13 (0.7%)
- Egyptian: 10 (0.5%)
- British: 9 (0.5%)
- Scandinavian: 9 (0.5%)
- Pennsylvania German: 5 (0.3%)
Most common places of birth for foreign-born residents (%):
| Westmont: | 165.3% (81) |
| Pennsylvania: | 0.2% (1,752) |
| Westmont: | 20.4% (10) |
| Pennsylvania: | 0.8% (7,272) |
Place of birth for U.S.-born residents:
- This state: 3,794
- Other state: 1,048
- Northeast: 169
- Midwest: 343
- South: 329
- West: 221
96.6% of Westmont residents lived in the same house 1 years ago.
Out of people who lived in different houses, 28.2% lived in this county.
Out of people who lived in different counties, 0.0% lived in Pennsylvania.
| Westmont: | 96.6% |
| State average: | 89.3% |
Education attainment for males 25 years and older:
- No schooling: 0
- Nursery to 4th grade: 0
- 5th and 6th grade: 0
- 7th and 8th grade: 0
- 9th grade: 0
- 10th grade: 15
- 11th grade: 0
- 12th grade, no diploma: 0
- High school graduate (or equivalency): 198
- Less than 1 year of college: 61
- Some college more than 1 year, no degree: 106
- Associate degree: 197
- Bachelor's degree: 978
- Master's degree: 147
- Professional school degree: 39
- Doctorate degree: 39

Education attainment for females 25 years and older:
- No schooling: 0
- Nursery to 4th grade: 0
- 5th and 6th grade: 0
- 7th and 8th grade: 9
- 9th grade: 0
- 10th grade: 0
- 11th grade: 0
- 12th grade, no diploma: 0
- High school graduate (or equivalency): 442
- Less than 1 year of college: 33
- Some college more than 1 year, no degree: 167
- Associate degree: 79
- Bachelor's degree: 720
- Master's degree: 198
- Professional school degree: 23
- Doctorate degree: 32


Housing units in structures:
- One, detached: 1,958
- One, attached: 85
- Two: 30
- 3 or 4: 44
House/condo owner moved in on average 24 years ago
Renter moved in on average 2 years ago

Private vs. public school enrollment:
| Here: | 15.8% |
| Pennsylvania: | 15.7% |
| Here: | 8.6% |
| Pennsylvania: | 13.4% |
| Here: | 0.0% |
| Pennsylvania: | 39.8% |


